. 2017 Jan 17;18(3):762-776.
doi: 10.1016/j.celrep.2016.12.063.

A Tissue-Mapped Axolotl De Novo Transcriptome Enables Identification of Limb Regeneration Factors

Affiliations

A Tissue-Mapped Axolotl De Novo Transcriptome Enables Identification of Limb Regeneration Factors

Donald M Bryant et al. Cell Rep. .

Abstract

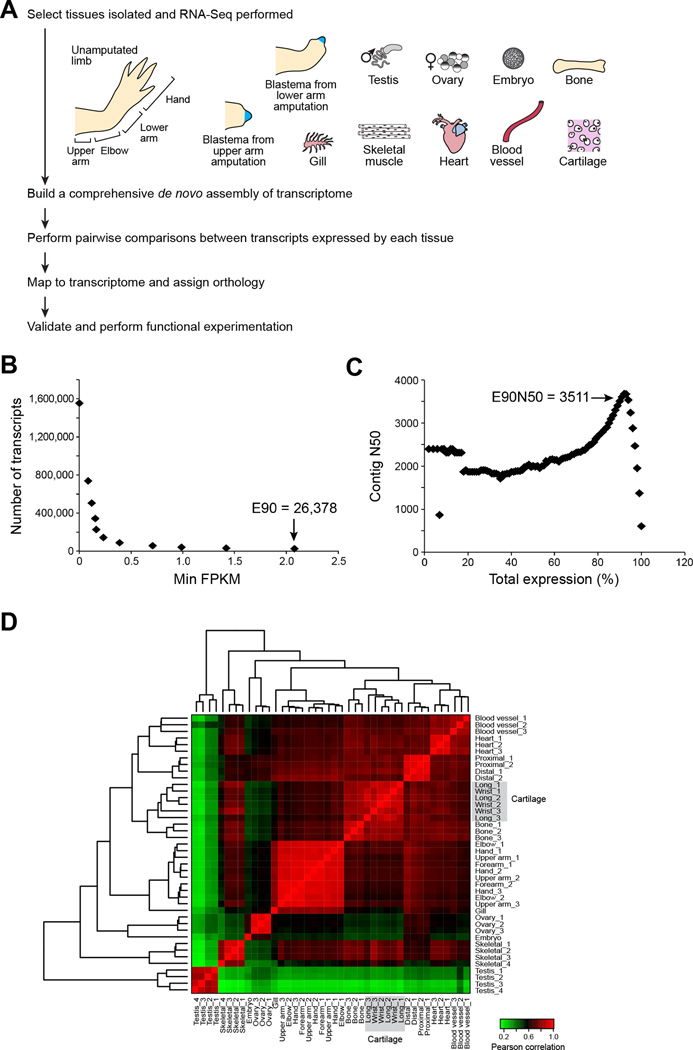
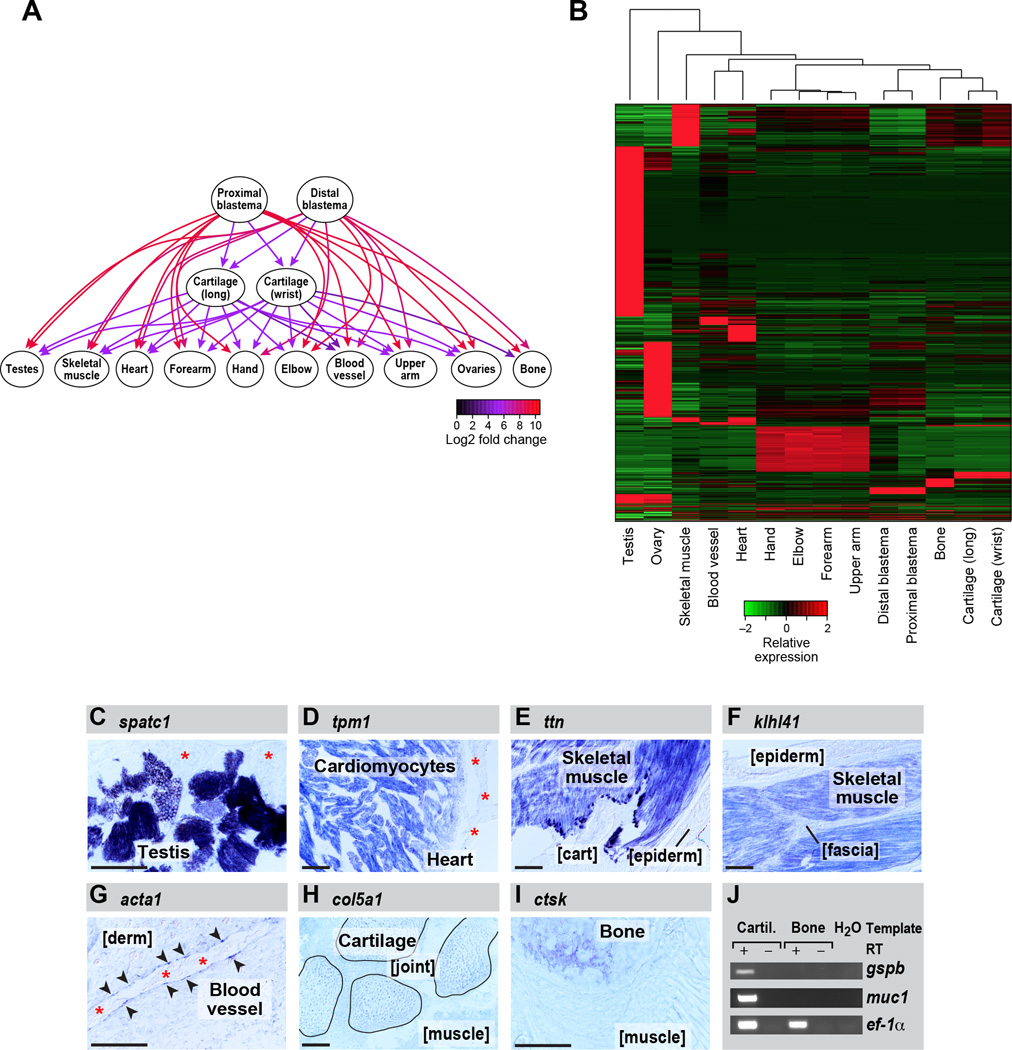
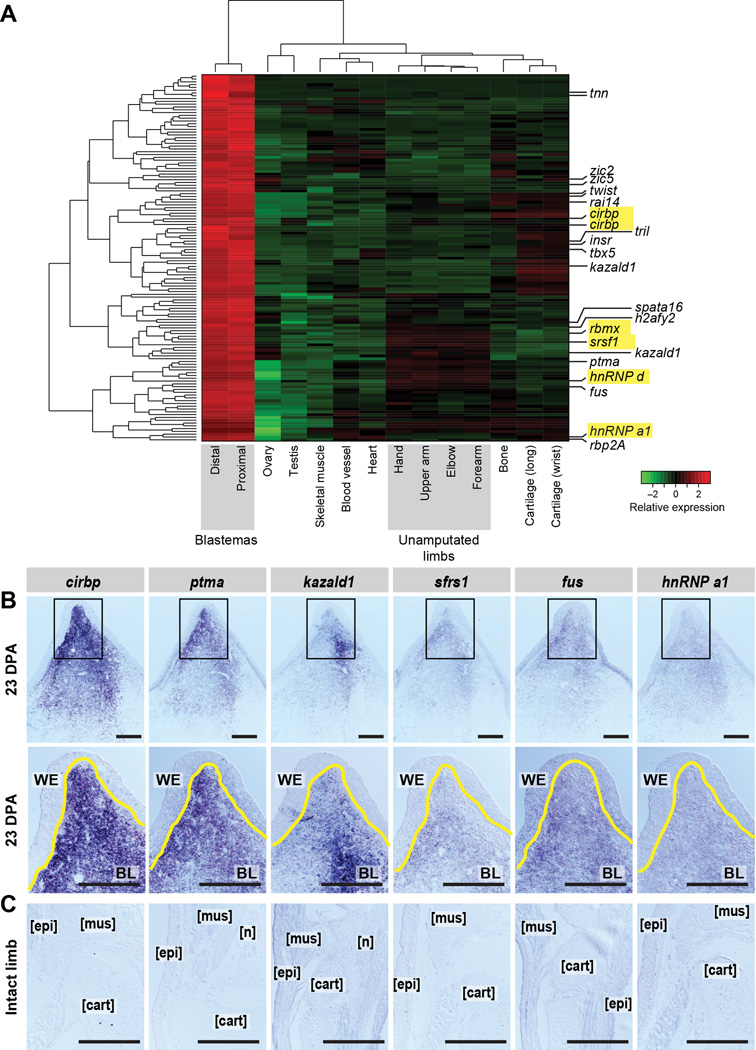
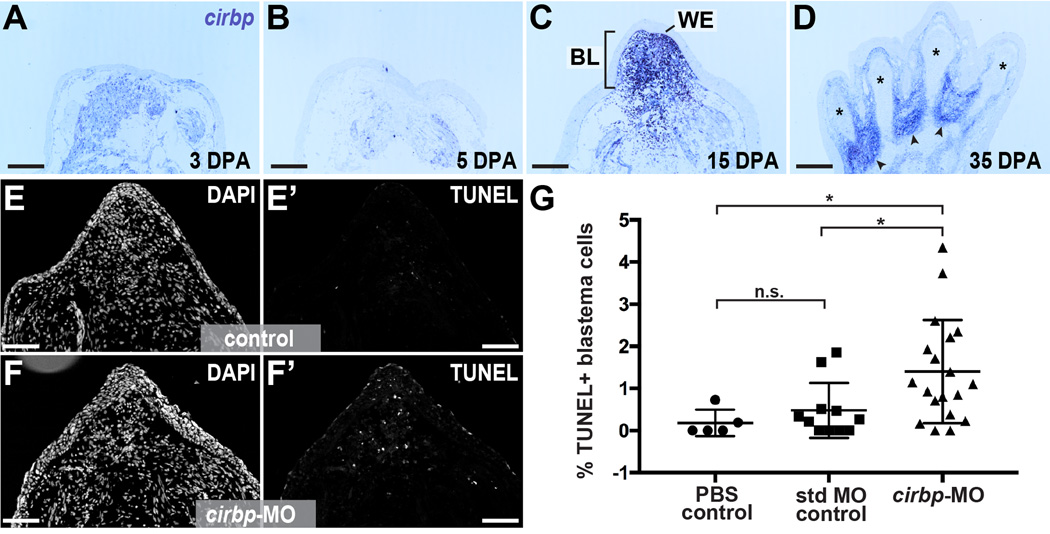
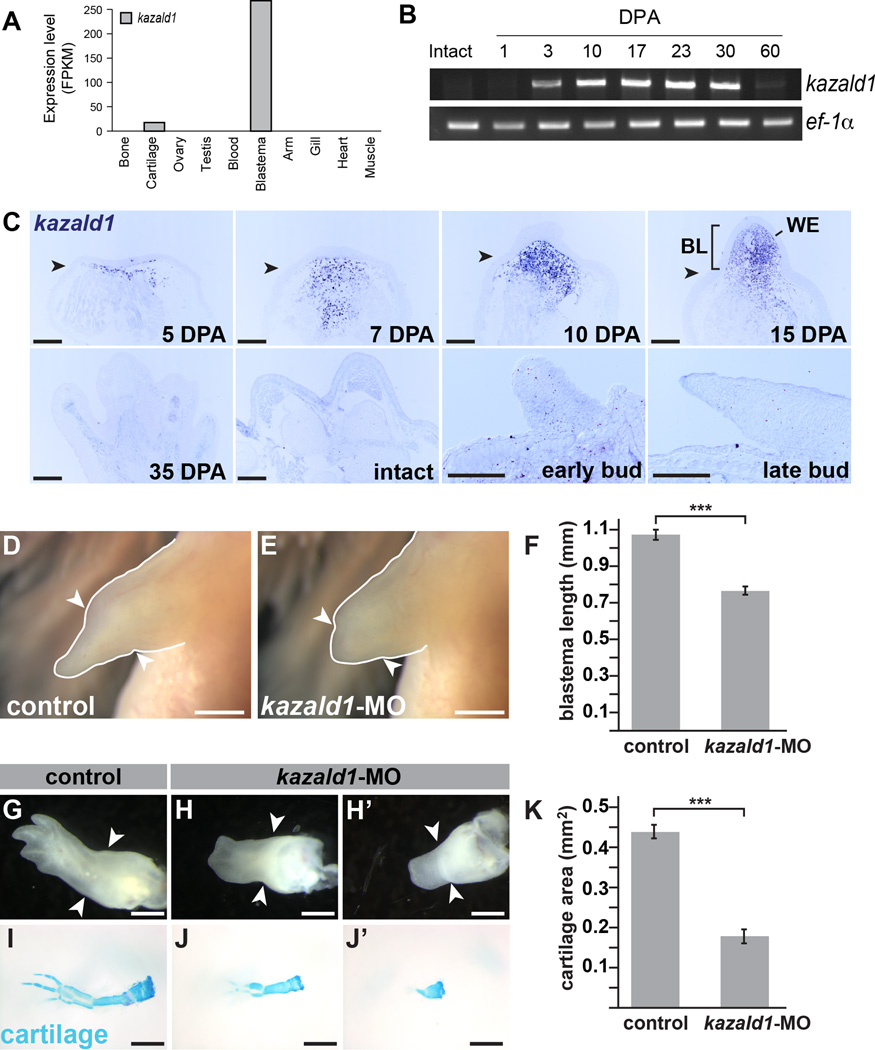
Mammals have extremely limited regenerative capabilities; however, axolotls are profoundly regenerative and can replace entire limbs. The mechanisms underlying limb regeneration remain poorly understood, partly because the enormous and incompletely sequenced genomes of axolotls have hindered the study of genes facilitating regeneration. We assembled and annotated a de novo transcriptome using RNA-sequencing profiles for a broad spectrum of tissues that is estimated to have near-complete sequence information for 88% of axolotl genes. We devised expression analyses that identified the axolotl orthologs of cirbp and kazald1 as highly expressed and enriched in blastemas. Using morpholino anti-sense oligonucleotides, we find evidence that cirbp plays a cytoprotective role during limb regeneration whereas manipulation of kazald1 expression disrupts regeneration. Our transcriptome and annotation resources greatly complement previous transcriptomic studies and will be a valuable resource for future research in regenerative biology.

Keywords: Trinity; Trinotate; axolotl; blastema; cirbp; expression analysis; kazald1; limb; regeneration; transcriptome.


Figures

Figure 1
Figure 1. Pipeline and assessment of read representation for de novo axolotl transcriptome
(A) Strategy for deriving a tissue-coded de novo transcriptome for axolotl. (B) The count of most highly expressed transcripts is plotted as a function of minimum expression value. 90% of the total expression (E90) is accounted for by the 26,378 most highly expressed transcripts. (C) The contig N50 value is computed for cumulative sets of most highly expressed transcripts. (D) Expression values for all tissue types were compared and Pearson correlation values were computed. Samples were clustered according to Pearson correlation values, indicating high similarity among sample replicates and between similar tissue types. See also Figure S1, Table S1, File S1 and File S2.
Figure 2
Figure 2. Differential gene expression analysis across each set of tissues identifies transcripts most enriched in specific tissue types
(A) Graph illustrating the methodology for the identification of genes that are tissue-enriched in the context of all tissue pairwise comparisons using kazal-type serine peptidase inhibitor domain 1 (kazald1) as an example. Directed edges are drawn from upregulated to downregulated tissues, and fold changes in expression are indicated by the edge colors. (B) Heatmap showing all transcripts that are enriched in specific tissue types. (C–J) RNA in situ hybridization performed on tissue sections. (C) speriolin (speri) is enriched in the germ cells in testis but not detectable in adjacent support cells (asterisks). (D) tropomyosin 1 (tpm1) is enriched in cardiomyocytes within the heart and is not detectably expressed by other heart cell types such as epicardium (asterisks). (E) titin is enriched in limb skeletal muscle but is not detectable in adjacent cartilage (cart) and epidermis (epiderm). (F) kelch repeat and BTB domain-containing protein 10 (kbtba) is highly enriched in skeletal muscle and not detectable in adjacent tissues such as epidermis (epiderm) and fascia. (G) actin, alpha1, skeletal muscle (acts) mRNA is enriched in the very thin layer of vascular endothelial cells lining the blood vessels (arrowheads) and absent from adjacent dermis (derm). Asterisks mark red blood cell clumps in the vessel lumen. (H) collagen type V alpha 1 (co5a1) expression is highly enriched in cartilage; shown are four carpals (outlined) within the wrist. Expression in joint (between carpals) and in adjacent muscle is diminished. (I) A bone-enriched marker, cathepsin k (catk), is highly expressed in ossified portions of the humerus, and low in adjacent muscle. (J) platelet binding protein GspB (gspb) and mucin 1 (muc1) are detected in cartilage but not bone by RT-PCR. eukaryotic translation elongation factor 1 alpha 1 (ef-1a) serves as the loading control. Scale bars (bottom left of each panel) are 100µm. See also Figure S7, Table S2, Table S3, File S1 and File S2.
Figure 3
Figure 3. Identification and validation of blastema-enriched transcripts
(A) We identified 159 transcripts (151 genes) enriched in blastema (the combination of proximal and distal blastema tissue) as compared to all other tissues. Those predicted to encode proteins with RNA-binding/regulation properties are highlighted yellow. (B–C) In situ hybridization for six highly blastema-enriched transcripts at 23 DPA (top two panels) and on intact limbs (lower panels). Second line of panels in (B) are higher magnifications of the boxed areas in above images. Yellow line marks WE/BL boundary. WE=wound epidermis, BL=blastema, mus= muscle, epi= epidermis, cart=cartilage, n= nerve. Scale bar is 500µm. See also Figure S3, Table S4, File S1 and File S2.
Figure 4
Figure 4. Axolotl Cold-Inducible RNA-binding Protein is a cytoprotective factor for blastema cells
(A–D) In situ hybridization for cirbp over course of regeneration. * denotes newly-differentiated cartilage in digits, arrowhead denotes interdigital regions. WE=wound epidermis, BL=blastema, mus= muscle, epi= epidermis, cart=cartilage, n= nerve. Scale bar is 500µm. (E-F’) Tissue sections from regenerating limbs treated with standard MO control (E-E’) and cirbp-targeting morpholino (F-F’) stained for nuclei (DAPI, E and F) and TUNEL (E’ and F’). Scale bar is 500µm. (G) Quantification of percentage of TUNEL (+) blastema cell nuclei in control and cirbp-MO-treated limbs. * indicates p < 0.05, n.s. indicates not significant. See also Figure S2 and File S1.
Figure 5
Figure 5. Kazald1 the most robust blastema marker, is required for limb regeneration
(A) Differential tissue expression analysis identifies kazald1 as the most blastema-enriched transcript compared to all other tissues sequenced. (B) RT-PCR performed on blastema cDNA samples throughout the course of regeneration for kazald1 expression. Kazald1 was not detected in intact limbs and at 1 DPA, and has dramatically diminished by 60 DPA. (C) In situ hybridization for kazald1 in the blastema over course of regeneration (top panels). Kazald1 is not detectable in regenerated limbs (35 DPA), intact limbs or in developing limb buds (lower panels). (D–E) Regenerating limbs at 19 DPA treated with control (D) or kazald1-targeting morpholino (E); quantified in (F). (G–J’) Regenerating limbs at 28 DPA treated with control (G) or kazald1-targeting morpholino (H-H’). (I–J’) Same specimens stained with Alcian blue to visualize cartilage; quantified in (K). Scale bar for all panels in C is 500µm; scale bar for D-E and H-J’ is 1mm. *** indicates p<0.001 and error bars are SEM. Arrowheads mark amputation plane in each image. BL=blastema, WE=wound epidermis. See also Figure S4, Figure S5, Figure S6, File S1 and File S2.
Figure 6
Figure 6. Transcripts differentially expressed in proximal versus distal elements
(A) Schematic illustrating specific elements of the hand and arm. (B) Differential gene expression analysis identifies transcripts that are enriched in distinct sections of the intact limb. (C) RT-PCR validation of select transcripts identified by differential expression analysis. (D) Gradient gene expression analysis identifies transcripts enriched in a gradient from proximal to distal or distal to proximal. (E) Schematic illustrating amputation planes for sampling of proximal and distal blastemas. (F) Differential expression analysis identifies transcripts that are enriched in proximal versus distal blastemas. (G) In situ and RT-PCR validation of computation predictions of differentially expressed transcripts in proximal and distal blastemas. See also Figure S7, Table S5, File S1 and File S2.

References

    1. Abdullayev I, Kirkham M, Bjorklund AK, Simon A, Sandberg R. A reference transcriptome and inferred proteome for the salamander Notophthalmus viridescens. Exp Cell Res. 2013;319:1187–1197. - PubMed
    1. Athippozhy A, Lehrberg J, Monaghan JR, Gardiner DM, Voss SR. Characterization of transcriptional responses of dorsal root ganglia cultured in the presence and absence of blastema cells from regenerating salamander limbs. Regeneration (Oxford) 2014;1:1–10. - PMC - PubMed
    1. Beauchemin M, Del Rio-Tsonis K, Tsonis PA, Tremblay M, Savard P. Graded expression of Emx-2 in the adult newt limb and its corresponding regeneration blastema. J Mol Biol. 1998;279:501–511. - PubMed
    1. Boeckmann B, Blatter MC, Famiglietti L, Hinz U, Lane L, Roechert B, Bairoch A. Protein variety and functional diversity: Swiss-Prot annotation in its biological context. Comptes rendus biologies. 2005;328:882–899. - PubMed
    1. Bolger AM, Lohse M, Usadel B. Trimmomatic: a flexible trimmer for Illumina sequence data. Bioinformatics. 2014;30:2114–2120. - PMC - PubMed

MeSH terms