. 2017 Jan 17;46(1):106-119.
doi: 10.1016/j.immuni.2016.12.014.

Follicular Dendritic Cell Activation by TLR Ligands Promotes Autoreactive B Cell Responses

Affiliations

Follicular Dendritic Cell Activation by TLR Ligands Promotes Autoreactive B Cell Responses

Abhishek Das et al. Immunity. .

Abstract

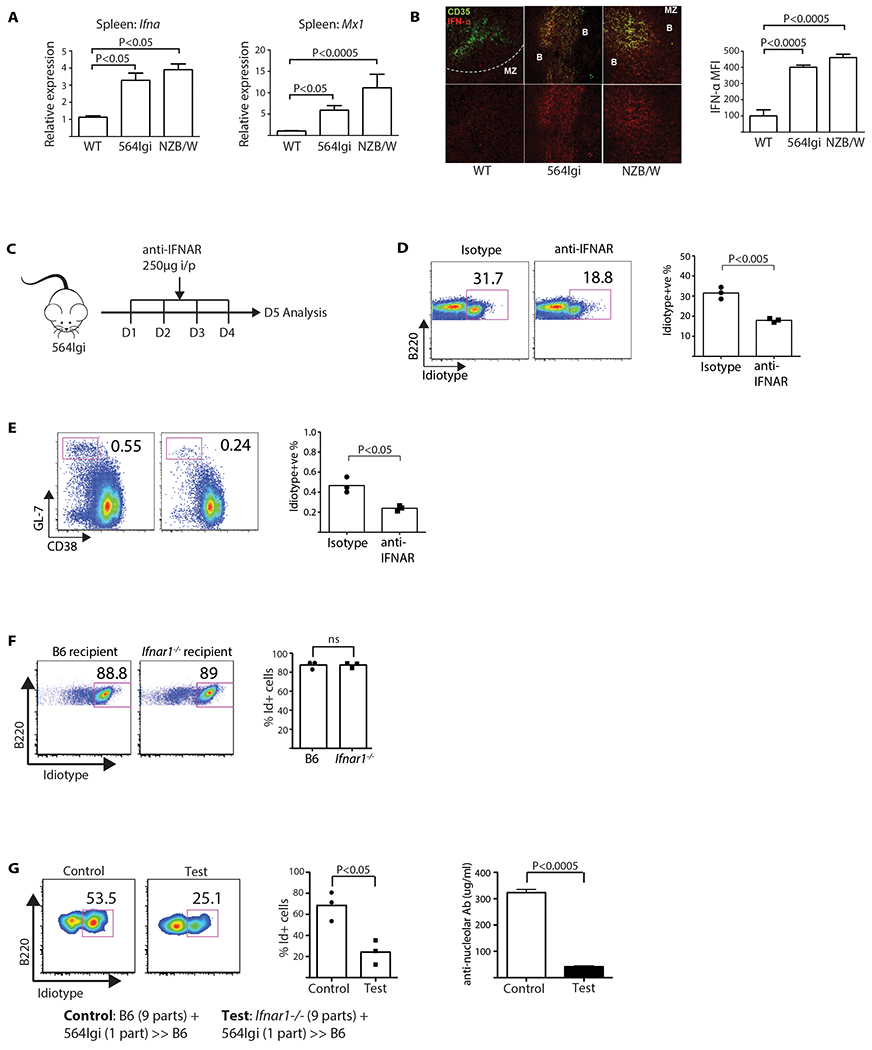
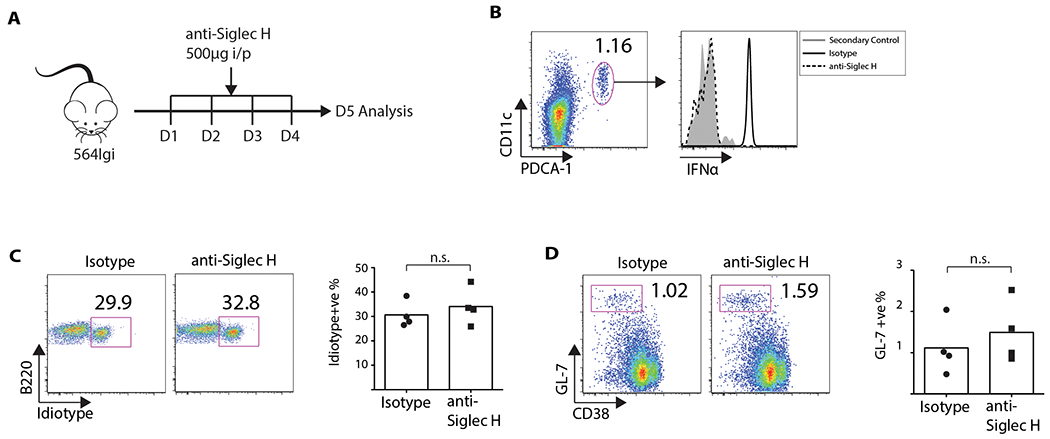
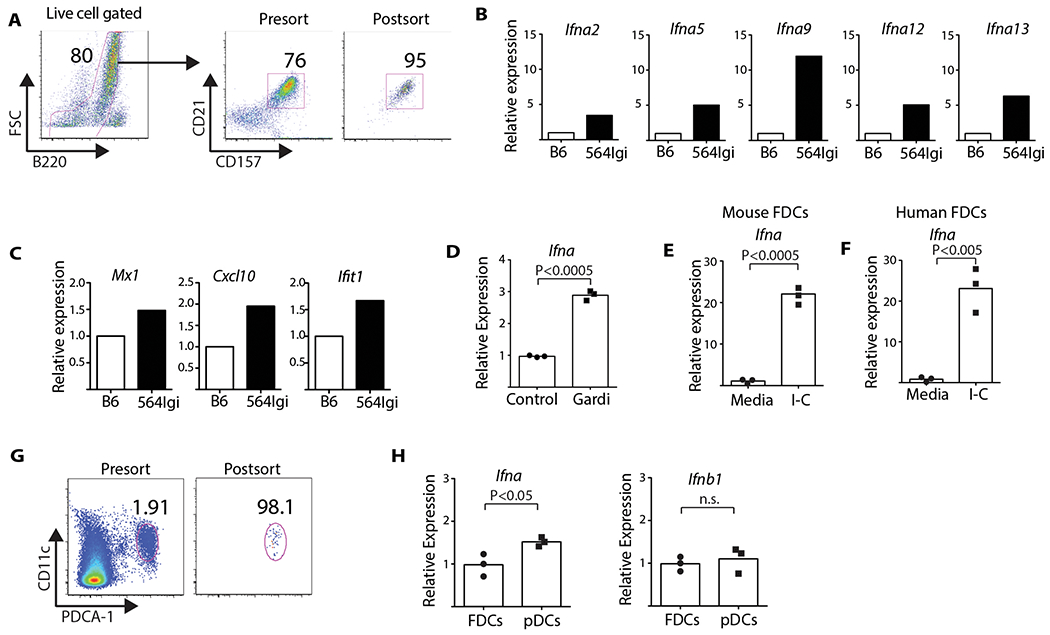
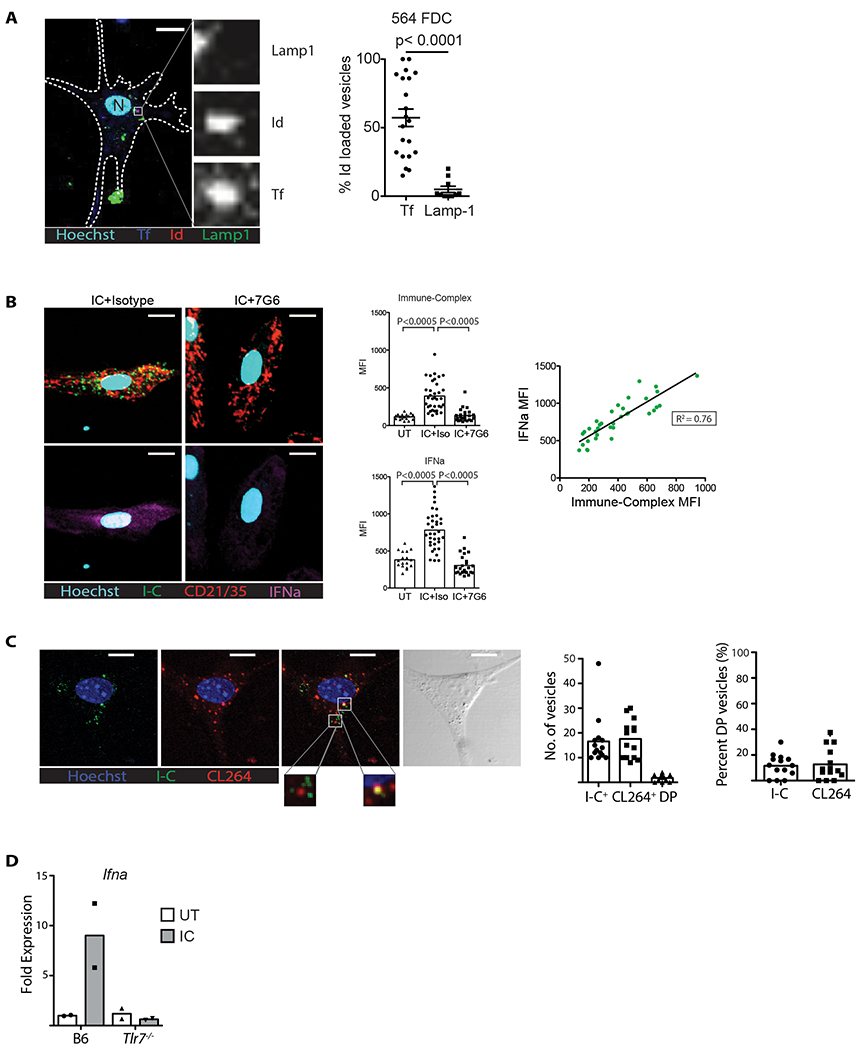
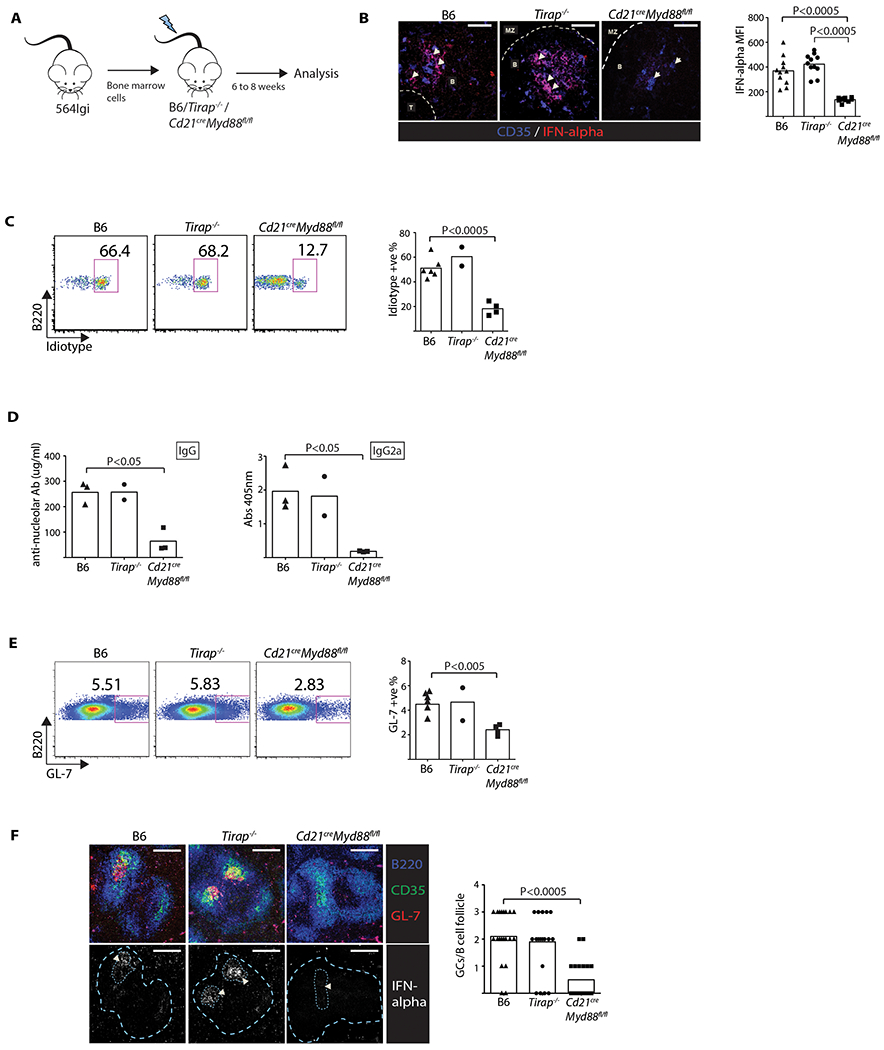
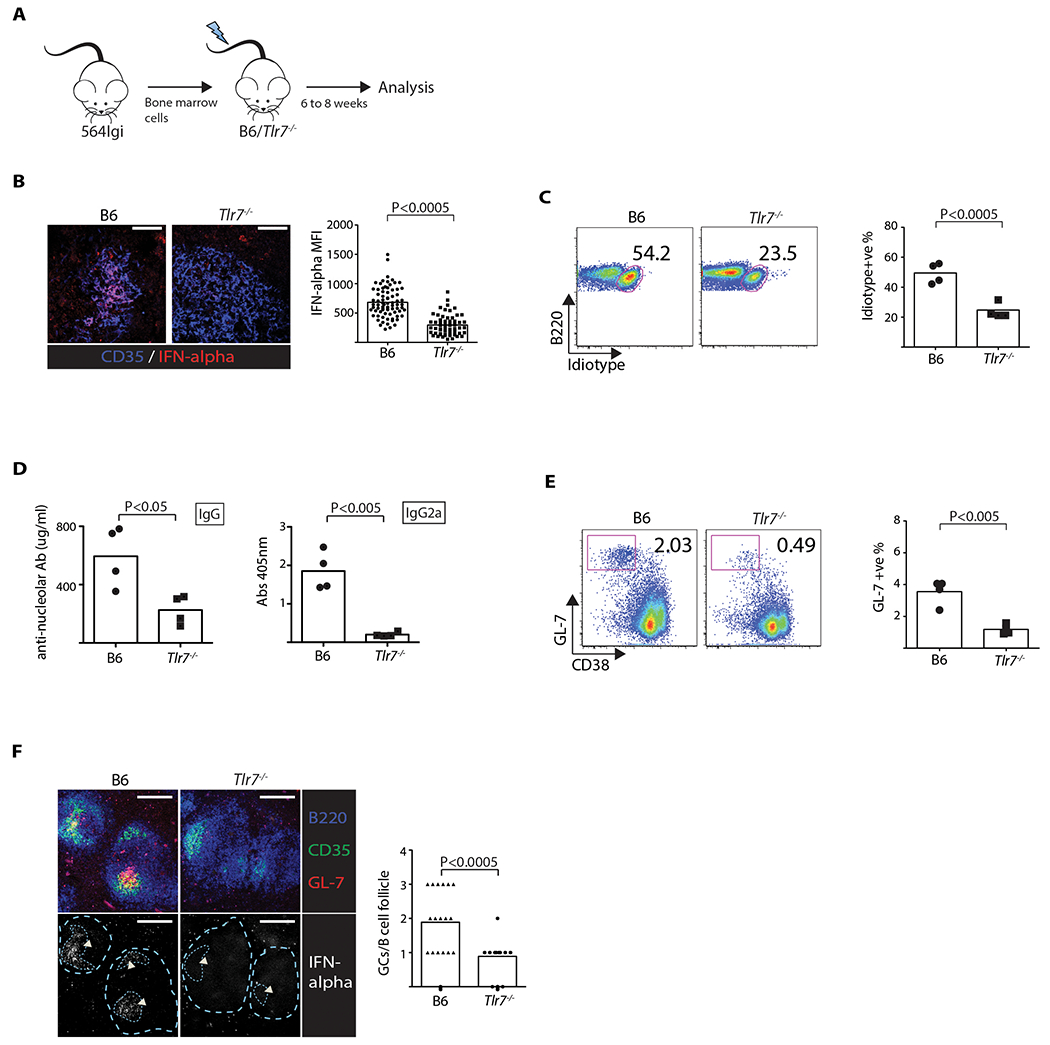
A hallmark of autoimmunity in murine models of lupus is the formation of germinal centers (GCs) in lymphoid tissues where self-reactive B cells expand and differentiate. In the host response to foreign antigens, follicular dendritic cells (FDCs) maintain GCs through the uptake and cycling of complement-opsonized immune complexes. Here, we examined whether FDCs retain self-antigens and the impact of this process in autoantibody secretion in lupus. We found that FDCs took up and retained self-immune complexes composed of ribonucleotide proteins, autoantibody, and complement. This uptake, mediated through CD21, triggered endosomal TLR7 and led to the secretion of interferon (IFN) α via an IRF5-dependent pathway. Blocking of FDC secretion of IFN-α restored B cell tolerance and reduced the amount of GCs and pathogenic autoantibody. Thus, FDCs are a critical source of the IFN-α driving autoimmunity in this lupus model. This pathway is conserved in humans, suggesting that it may be a viable therapeutic target in systemic lupus erythematosus.

Keywords: CD21; CD35; DAMP; TLR7; autoimmunity; follicular dendritic cells; immune complex; interferon-α; systemic lupus erythematosus.


Conflict of interest statement

COMPETING FINANCIAL INTERESTS

R.H., N.M., and G.C. are employees of MedImmune, LLC

Figures

Figure 1:
Figure 1:. IFNα is required for the maintenance of self-reactive B cells.
(A) Ifna and Mx1 expression measured by RT-PCR using splenic RNA from respective mice strains. Results representative of two experiments (one-way ANOVA, n = 6). (B) Spleen sections stained with anti-CD35 (green) and anti-IFNα (red), imaged by LSCM. Bar graph shows the MFI of IFNα (one-way ANOVA, n = 3). (C) Timeline of anti-IFNAR treatment. (D) FACS plots of mature Id+ B cell % in 564 Igi mice treated with anti-IFNAR (Student’s T test, n = 3, P < 0.005). Plots show two groups of mice gated on B220+ AA4.1 low cells. Each data point is one mouse. (E) Flow cytometry of spleen GC B cell % in anti-IFNAR treated 564 Igi mice (Student’s t test, n = 3, P < 0.05). Plots shown are gated on B220+ cells. Each data point is one mouse. (F) Plots are spleen cells gated on B220+ AA4.1 low cells. Data representative of two experiments. P values were calculated by Student’s t test; ns = not significant. (G) 564 Igi BM cells were mixed with either B6 (Ifnar1+/+) or Ifnar1−/− BM cells in a 1:9 ratio and transferred into irradiated B6 recipients. Left, representative flow-cytometry plots of mature Id+ B cells. Middle, mature Id+ cells in B6 controls vs. Ifnar1−/− BM donors (Student’s t test, n = 3, P < 0.05). Right, anti-nucleolar antibody titers between B6 controls (Ifnar1+/+) and Ifnar1−/− BM donors (Student’s t test, n = 3, P < 0.0005). Data representative of two experiments.
Figure 2:
Figure 2:. Absence of IFNα secretion by pDCs does not affect mature self-reactive B cells.
(A) 564 Igi mice were injected with 500 μg of anti-Siglec H (clone 440c). (B) Day 5, cells were stained for B220, CD11 c, and PDCA-1, followed by fixation-permeablization and staining for IFNα. Left, pDC gating. Right, IFNα MFI comparison. There were four mice per group. (C) FACS plots showing % mature Id+ B cells (Student’s t test, n = 4, P > 0.05). Gated on mature B220+ AA4.1 low cells. Bar graph has four mice per group. (D) FACS plots showing % GC B cells (Student’s t test, n = 4, P > 0.05). Gated on B220+ cells. Bar graph has four mice per group.
Figure 3:
Figure 3:. FDCs express Ifna in response to self-antigen (RNP)–IC and TLR7 activation, and at comparable levels to pDCs in the 564 Igi mouse.
(A) FDCs were purified as described in Methods. (B) Fluidigm analysis of mRNA expression of different Ifna isoforms. (C) IFNα-inducible genes expressed by FDCs: Mx1, Cxcl10, and Ifit1. (D) B6 FDCs from spleens treated with gardiquimod (1 μg/ml) for 6 hours. Bar graph shows relative level of Ifna (Student’s t test, n = 3, P < 0.0005). Data from three experiments. (E) Murine FDCs treated with RNP-IC. RT-PCR of Ifna levels (Student’s t test, n = 3, P < 0.0005). Data representative of three experiments. (F) FDCs isolated from human spleen incubated with RNP-IC. Primers designed to detect all isoforms of Ifna (Student’s t test, n = 3, P < 0.005). (G) Splenic pDCs (B220+CD11intPDCA-1+) isolated from 564 Igi mice were purified by sorting. FDCs were also isolated from the same mice. (H) Expression levels of Ifna and Ifnb1 measured by RT-PCR. Bar graphs show expression of Ifna and Ifnb1 in FDCs and pDCs (Student’s t test, n = 3, P < 0.05). Data representative of two experiments.
Figure 4:
Figure 4:. FDCs cycle self-antigen after internalization through CD21 and activate TLR7.
(A) Purified 564 Igi FDCs were treated with fluorescent-labeled transferrin ligand, stained for RNP-IC and Lamp1, and imaged by LSCM. Left, representative confocal image with Id+, transferrin ligand (Tf), or lysosome (Lamp1) stain. Tf (blue); Id (red); Lamp1 (green); Nucleus (cyan). Scale: 10 μm. Insets identify one Id+ Tf+ vesicle at higher magnification. Right, quantification of Id+ vesicles. Each data point is one cell (Student’s T test, P < 0.05). (B) B6 splenic FDCs treated with RNP-IC followed by anti-CD21 (7G6 clone). Representative LSCM panels; nucleus (cyan); Id+ vesicles (green); CD21/35 (red); IFNα (magenta). Scale: 10 μm. Top bar graph, MFI of Id+ vesicles in each cell quantified from three groups: untreated (UT), RNP-IC, and RNP-IC followed by purge with anti-CD21 (7G6) or isotype control (Iso) (Student’s t test, n = 35, P < 0.0005). Bottom bar graph, MFI of IFNα signal in each cell quantified from the same 3 groups (Student’s t test, n = 35, P < 0.0005). The dot plot shows the correlation between the RNP-IC and IFNα MFIs of each cell quantified. (C) Cultured B6 splenic FDCs treated with RNP-IC before labeling with CL264-rhodamine. Left, representative LSCM; nucleus (blue); Id+ (IC+) vesicles (green); CL264+ vesicles (red); combined red and green, and bright-field image. Scale: 10 μm. Insets show magnified examples of CL264+ vesicles with or without RNP-IC. Right, bar graphs compare the number of vesicles per cell stained for Id+ (IC+) alone, CL264+ alone, or both. Bar graph on far right compares % of double-positive vesicles of total Id+ (IC+) or CL264+. Representative of two experiments. (D) FDCs isolated from B6 or Tlr7−/− mice treated with RNP-IC overnight, then RT-PCR of Ifna levels. Data representative of two experiments.
Figure 5:
Figure 5:. FDCs maintain self-reactive B cells via the MyD88 pathway.
(A) Diagram of BM chimeras. (B) LSCM of spleen sections (60×) from BM recipients (one-way ANOVA, n = 11, P < 0.0005). Scale: 50 μm. Arrowheads indicate FDC networks. Data representative of two experiments. Bar graph of MFI of IFNα. Each data point is one continuous FDC area. (C) Flow cytometry plots showing mature % Id+ B cells in BM chimeras gated on mature B220 positive AA4.1 low cells (one-way ANOVA). Data from two experiments. (D) ELISA serum anti-nucleolar IgG (left panel) and IgG2a (right panel) levels in the BM chimeras (one-way ANOVA, n = 3, P < 0.05). (E) Flow cytometry plots showing GL7+ B cell frequencies (one-way ANOVA). Representative plots are gated on B220+GL7+ splenic B cells. Data from two experiments. (F) LSCM of spleen cryosections (20×) from the BM chimeras (one-way ANOVA, n = 20, P < 0.0005). Scale: 200 μm. Arrowheads indicate FDC/GC area. GC areas and follicle boundaries are indicated by dotted lines in second row of images. Data representative of two experiments. Bar graph indicates number of GCs per B-cell follicle. Each data point is one follicle.
Figure 6:
Figure 6:. Autoreactive B cells and autoantibody production is dependent on TLR7 expression by stromal cells.
(A) Diagram of BM chimeras. (B) IFNα expression within FDC network based on LSCM of spleen sections (60×) (Student’s t test, n = 75, P < 0.0005). Scale: 50 μm. Data representative of two experiments. Bar graph of MFI of IFNα. Each data point is one continuous FDC area. (C) FACS plots showing mature Id+ B cell frequencies (Student’s t test, n = 4, P < 0.0005). Plots shown are gated on B220+ AA4.1 low cells. Each data point is one mouse. Data representative of two experiments. Bar graphs represent pooled results. (D) ELISA data showing serum anti-nucleolar IgG (left panel) and IgG2a (right panel) (Student’s t test, n = 4, P < 0.05). (E) FACS of splenic GL7+ CD38 GC B cell frequencies (Student’s t test, n = 4, P < 0.005). Plots shown are gated on B220+ cells. Data representative of three experiments. Each data point is one mouse. (F) LSCM of spleen sections (20×) (one-way ANOVA, n = 18, P < 0.0005). Scale: 200 μm. Arrowheads indicate FDC/GC area. GC areas and follicle boundaries are indicated by dotted lines in second row of images. Data representative of two experiments. Bar graph indicates number of GCs per B-cell follicle. Each data point is one B-cell follicle.

References

    1. Allen CD, Okada T, and Cyster JG (2007a). Germinal-center organization and cellular dynamics. Immunity 27, 190–202. - PMC - PubMed
    1. Allen CD, Okada T, Tang HL, and Cyster JG (2007b). Imaging of germinal center selection events during affinity maturation. Science 315, 528–531. - PubMed
    1. Allman D, Lindsley RC, DeMuth W, Rudd K, Shinton SA, and Hardy RR (2001). Resolution of three nonproliferative immature splenic B cell subsets reveals multiple selection points during peripheral B cell maturation. Journal of immunology 167, 6834–6840. - PubMed
    1. Baccala R, Gonzalez-Quintial R, Schreiber RD, Lawson BR, Kono DH, and Theofilopoulos AN (2012). Anti-IFN-alpha/beta receptor antibody treatment ameliorates disease in lupus-predisposed mice. Journal of immunology 189, 5976–5984. - PMC - PubMed
    1. Banchereau R, Hong S, Cantarel B, Baldwin N, Baisch J, Edens M, Cepika AM, Acs P, Turner J, Anguiano E, et al. (2016). Personalized Immunomonitoring Uncovers Molecular Networks that Stratify Lupus Patients. Cell 165, 551–565. - PMC - PubMed

Publication types

MeSH terms