. 2017 Jan 17;46(1):51-64.
doi: 10.1016/j.immuni.2016.12.015.

SATB1 Expression Governs Epigenetic Repression of PD-1 in Tumor-Reactive T Cells

Affiliations

SATB1 Expression Governs Epigenetic Repression of PD-1 in Tumor-Reactive T Cells

Tom L Stephen et al. Immunity. .

Abstract

Despite the importance of programmed cell death-1 (PD-1) in inhibiting T cell effector activity, the mechanisms regulating its expression remain poorly defined. We found that the chromatin organizer special AT-rich sequence-binding protein-1 (Satb1) restrains PD-1 expression induced upon T cell activation by recruiting a nucleosome remodeling deacetylase (NuRD) complex to Pdcd1 regulatory regions. Satb1 deficienct T cells exhibited a 40-fold increase in PD-1 expression. Tumor-derived transforming growth factor β (Tgf-β) decreased Satb1 expression through binding of Smad proteins to the Satb1 promoter. Smad proteins also competed with the Satb1-NuRD complex for binding to Pdcd1 enhancers, releasing Pdcd1 expression from Satb1-mediated repression, Satb1-deficient tumor-reactive T cells lost effector activity more rapidly than wild-type lymphocytes at tumor beds expressing PD-1 ligand (CD274), and these differences were abrogated by sustained CD274 blockade. Our findings suggest that Satb1 functions to prevent premature T cell exhaustion by regulating Pdcd1 expression upon T cell activation. Dysregulation of this pathway in tumor-infiltrating T cells results in diminished anti-tumor immunity.


Figures

Figure 1
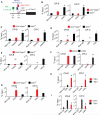
Figure 1. TCR-Activation-Induced Satb1 Expression Is Impaired by Tgf-β
(A) Expression levels of Satb1 in negatively purified mouse CD4 or CD8 T cell splenocytes stimulated or not with plate bound CD3 (5 μg/mL) and CD28 (1 μg/mL) for 30 hours, with or without Tgf-β1 (5 ng/mL). Representative of three independent experiments. (B) Human CD4 and CD8 T cells at rest or CD3-CD28-activated with beads for 30 hr in the presence or the absence of Tgf-β1 (5 ng/mL). (C) OT1 T cells activated for ~65 hr with BMDCs previously pulsed for 15 hr with 1 μg/mL of ovalbumin (Sigma-Aldrich), where Tgf-β (5 ng/mL) was added on day 0 or day 2. Representative of three independent experiments. (D) Smad2/3 binding to the Satb1 promoter region. Chromatin was immunoprecipitated (IPed) with anti-Smad2/3 or control IgG from negatively immunopurified mouse CD8 T cells activated for 24 hr. Enrichment of the Satb1 promoter sequence in IPed chromatin was quantified by real-time qPCR. Pooled from two independent experiments with similar results. (E) Proliferation of CD4+ and CD8+ T cells from CD4CreSatb1f/f versus Satb1f/f mice, activated for 3 days with CD3-CD28 beads. Representative of three independent experiments. (F) Analysis of CD3 T cells in the spleen of 5- to 10-week-old CD4CreSatb1f/fOT1 versus Satb1f/fOT1 TCR transgenic mice. (G) Mature Vβ5+ OT1 T cells in the periphery of CD4CreSatb1f/f OT1 mice. Representative of three independent experiments. (H) T cells from indicated mice were labeled with Cell Trace Violet and incubated for ~65 hours at a 1:10 ratio with BMDCs pulsed with ovalbumin. Representative of three independent experiments. (I) IFN-γ production by CD4 and CD8 T cell splenocytes from CD4CreSatb1f/f versus Satb1f/f mice stimulated with plate-bound CD3 (5 μg/mL) and CD28 (1 μg/mL) for 30 hr. Representative of three mice. (J) Expression of different cytokine receptors in CD8 T cell splenocytes from CD4CreSatb1f/f versus Satb1f/f mice stimulated with plate-bound CD3 (5 μg/mL) and CD28 (1 μg/mL) plus 30 U of IL-2 for 30 hr. Representative of three mice. Bar graphs represent mean ± SEM.
Figure 2
Figure 2. Satb1-Deficient T Cells Overexpress PD-1 upon TCR Activation
Negatively immunopurified CD4CreSatb1f/f and control Satb1f/f T cell splenocytes were activated for 60 hr with CD3-CD28 beads. (A) Expression levels of PD-1 in activated versus unstimulated cells in both populations. (B) Negatively purified CD8 T cell splenocytes from CD4CreSatb1f/fOT1 and control Satb1f/fOT1 transgenic mice were incubated for ~65 hours at a 1:10 ratio with BMDCs, which were pulsed with 50 ug/mL full-length ovalbumin for 3–15 hr. PD-1 expression in resting vs. activated T cells in both groups is shown. (C) PD-1 expression in antigen-experienced (CD44+) versus CD44 (top), and recently activated (CD69+) versus CD69 (bottom) splenic T cells from Satb1-deficient or WT mice. (D) Expression of PD-1 in CD44+CD69+Satb1f/fCre-ERT2+RosaYFP T cells activated with plate-bound CD3 and soluble CD28 antibodies for 36 hr in the presence of 1 μg/mL of tamoxifen compared to identically activated T cells incubated with vehicle. (E) Negatively purified CD8 T cell splenocytes from CD4CreSatb1f/fOT1 and control Satb1f/fOT1 transgenic mice were incubated for ~65 hours at a 1:10 ratio with OVA-pulsed BMDCs, and surface expression of the indicated inhibitory and co-stimulatory molecules were compared. (F) PD-1 expression in ≥ 6-week-old CD4CreSatb1f/f, VavCreSatb1f/f, and control Satb1f/f double positive thymocytes. All representative of ≥ 3 independent experiments.
Figure 3
Figure 3. Tgf-β Regulates PD-1 Expression in Activated T Cells
(A) Expression levels of PD-1 in negatively purified WT mouse CD4 and CD8 T cell splenocytes at rest or CD3-CD28-activated (beads) for 48 hr with 50 U of IL-2/mL in the presence or the absence of Tgf-β1 (5 ng/mL). Representative of two independent experiments. (B) PD-1 expression in CD4 and CD8 T cells negatively purified from human peripheral blood, at rest or CD3-CD28-activated for 60 hr, in the presence or the absence of Tgf-β1 (5 ng/mL). Representative of ≥ 3 independent experiments. (C) Expression of PD-1 in negatively immunopurified Satb1f/fCre-ERT2+RosaYFP T cell splenocytes activated CD3-CD28-coated beads for 32 hr in the presence of 1 μg/mL of tamoxifen (bottom) ± 5 ng/mL of Tgf-β compared to identically activated Satb1f/fCre-ERT2+RosaYFP T cells without tamoxifen treatment (top). Representative of three independent experiments. (D) Expression levels of PD-1 in negatively purified WT mouse CD4 and CD8 T cell splenocytes at rest without cytokines for 48 hr in the presence or the absence of Tgf-β1 (5 ng/mL). Representative of two mice. (E) T cell splenocytes from WT and dnTGF-βRII mice were primed for 9 days against BMDCs pulsed with UV+gamma-irradiated ID8-Defb29/Vegf-a tumor cells. Tumor-antigen-primed T cells were then i.p. transferred into congenic day 35 ID8-Defb29/Vegf-a tumor-bearing mice, and peritoneal wash cells were analyzed by flow cytometry 3 days later. Representative of three different mice. (F) Smad2/3 binding to the CR-C regulatory region upstream of PD-1. Chromatin was IPed with anti-Smad2/3 or control IgG from negatively immunopurified mouse CD8 T cells activated for 24 hr. Enrichment was quantified by real-time qPCR. Pooled from two independent experiments with comparable results. (G) Expression of PD-1 in negatively immunopurified CD4 and CD8 T cell splenocytes from Satb1f/f (top) versus CD4CreSatb1f/f(bottom) mice activated CD3-CD28-coated beads for 30 hr in the presence or the absence of 5 ng/mL of Tgf-β. Representative of two independent experiments. (H) Rag1−/− mice received different combinations of negatively immunopurified, aged-matched control Satb1f/f versus CD4CreSatb1f/f CD4 and CD8 T cell splenocytes I.V. (106 and 500,000, respectively). Expression of PD-1 in CD3+CD8+ T cells was analyzed in peripheral blood after 7 days (four mice per group, with similar results in each mouse). * p <0.05; ** p <0.01, unpaired t test. Bar graphs represent mean ± SEM.
Figure 4
Figure 4. Satb1 Physically Interacts with Other Members of the NuRD Repressor Complex
Negatively immunopurified CD8 T cell splenocytes from CD4CreSatb1f/f and control Satb1f/f mice were activated for 60 hr with CD3-CD28 beads. (A) p66α was IPed from the extracted proteins, followed by immunoblotting for Satb1. Irrelevant rabbit IgG was used as an additional control. (B) IP using anti-Hdac2 antibodies under identical conditions. (C) Same using anti-Cdh4 antibodies. (D) Reverse IP with Satb1 and immunoblotting for Cdh4. All representative of two independent experiments. See also Tables S1 and S2.
Figure 5
Figure 5. Satb1 Recruits a NuRD Complex to CR-B and CR-C Regulatory Elements Upstream of Pdcd1 Transcription Start Site, Resulting in Histone De-acetylation
(A) Schematic depiction of the CR-C regulatory region specifically amplified with DNA ChIP-ed with both anti-Smad2/3 and anti-Satb1 antibodies, but not control IgGs. (B) Chromatin was IPed with anti-Satb1 (clone#EPR3895) or control IgGs from negatively immunopurified control Satb1f/f (black) versus CD4CreSatb1f/f (red) mouse CD8 T cells, previously CD3-CD28-activated for 30 hr. Percent of input before IP (1% gel input values) was quantified by real-time qPCR in chromatin IPed with anti-Satb1 antibodies (clone#P472) versus irrelevant IgGs using primers specific for CR-B and CR-C sequences. (C–E) ChIp-PCR quantification of the same CR-B and CR-C sequences using Satb1f/f/CD4CreSatb1f/f mouse CD8 T cells handled as above IPed with specific antibodies for the Gatd2a (C), Cdh4 (D), or Hdac2 (E) elements of the NuRD complex. (F) ChIP PCR quantification of CR-B and CR-C in chromatin IPed with anti-H3Ac antibodies versus irrelevant IgGs using Satb1f/fCD8 T cells activated in the presence of 1 μM of the HDAC1/2 inhibitor CI-994. (G) Same experiment using activated Satb1f/f versus CD4CreSatb1f/f CD8 T cells. (H and I) ChIP PCR quantification of CR-B and CR-C in chromatin IPed with anti-H3Ac (H) or anti-Satb1 (I) antibodies versus irrelevant IgGs from with Satb1f/f CD8 T cells activated in the presence versus the absence of Tgf-β1 (5 ng/mL). All pooled from ≥ three independent experiments with ≥ three replicates. * p <0.05, unpaired t test. Bar graphs represent mean ± SEM. See also Figure S2.
Figure 6
Figure 6. Satb1 Expression Is Lower in Human Ovarian Cancer-Infiltrating CTLs Compared to Peripheral Blood
(A) SATB1 expression quantified through intracellular staining in CD45RA (previously activated) CD8 T cells from buffy coats from the peripheral blood of four healthy donors, as well as in activated CD8 T cells infiltrating six freshly dissociated stage III-IV human serous ovarian carcinoma specimens. Gated on Aqua Live Dead (viability probe) negative, CD45RACD8+ T cells. Anti-SATB1, clone 14/SATB1. (B) Expression of intracellular SATB1 and IFN-γ, and extracellular PD-1, in CD45RACD8+ T cells from freshly dissociated stage III-IV serous ovarian cancer patients. Gated on Zombie yellow (viability probe) negative, CD45RACD8+ T cells. Anti-SATB1, clone EPR3895. (C) Intracellular SATB1 expression in CD45RACD8+ T cells from buffy coats from the peripheral blood of five additional advanced serous ovarian cancer patients compared to their counterparts in matching freshly dissociated tumors. Gated on Zombie yellow (viability probe) negative, CD45RACD8+ T cells. Anti-SATB1, clone EPR3895. (D) Comparison of PD-1 expression in the same tumor-infiltrating versus autologous peripheral blood CD45RACD8+ T cells.
Figure 7
Figure 7. Tumor-Induced Satb1 Decreased Expression Results in Anti-tumor T Cell Paralysis at Tumor Beds
(A and B) T cell splenocytes from Satb1f/f and CD4CreSatb1f/f mice were primed for 6 days against BMDCs pulsed with UV+gamma-irradiated ID8-Defb29-Vegf-a tumor cells. Tumor antigen-primed T cells were then i.p. transferred into congenic day 35 ID8-Defb29-Vegf-a tumor-bearing mice, FACS-sorted from peritoneal wash 3 days later, and subjected to Granzyme B (A, right) and Ifn-γ (B, right) ELISPOT analysis, again using ID8-Defb29-Vegf-a tumor-pulsed-BMDCs. An aliquot of day 6 primed T cells was kept in vitro for 3 days as a control and subjected to identical ELISPOT analysis for Granzyme B (A, left) and Ifn-γ (B, left). All representative of ≥ two independent experiments. (C) T cells from Satb1f/f and CD4CreSatb1f/f mice were primed for 6 days as in (A) and (B) and transferred (106 per mouse) into the peritoneal cavity of ID8-Defb29-Vegf-a tumor-bearing mice at days 7 and 10 after tumor challenge. Differences in survival are shown and compared to PBS-treated mice. Representative of two independent experiments with 5 mice per group. (D) Satb1-dependent differences in anti-tumor T cell activity disappeared when PD-L1 is neutralized with 100 mg of specific antibodies every 5 days, starting at day 7 after tumor challenge (representative of two additional independent experiments, each with five mice per group; with similar results). (E) T cells from Satb1f/f and CD4CreSatb1f/f mice were primed as in (A–C) and transferred (106 per mouse) into the peritoneal cavity of Lewis Lung Carcinoma-bearing mice at days 7 and 10 after tumor challenge. Differences in survival are shown. Representative of two independent experiments, with five mice/group per experiment. (F) Rag1−/− mice were challenged with Lewis Lung Carcinoma 10 days after receiving (I.V.) 106 negatively immunopurified CD4 T cells from Satb1f/f mice, admixed with 500,000 CD8 T cells from either CD4CreSatb1f/f or Satb1f/f mice. Differences in survival are shown (five mice per group). * p <0.05, unpaired t test or long-rank (survival). Bar graphs represent mean ± SEM. See also Figure S3.

Comment in

References

    1. Ahmadzadeh M, Rosenberg SA. TGF-beta 1 attenuates the acquisition and expression of effector function by tumor antigen-specific human memory CD8 T cells. J. Immunol. 2005;174:5215–5223. - PMC - PubMed
    1. Alvarez JD, Yasui DH, Niida H, Joh T, Loh DY, Kohwi-Shigematsu T. The MAR-binding protein SATB1 orchestrates temporal and spatial expression of multiple genes during T-cell development. Genes Dev. 2000;14:521–535. - PMC - PubMed
    1. Austin JW, Lu P, Majumder P, Ahmed R, Boss JM. STAT3, STAT4, NFATc1, and CTCF regulate PD-1 through multiple novel regulatory regions in murine T cells. J. Immunol. 2014;192:4876–4886. - PMC - PubMed
    1. Avram D, Califano D. The multifaceted roles of Bcl11b in thymic and peripheral T cells: impact on immune diseases. J. Immunol. 2014;193:2059–2065. - PMC - PubMed
    1. Baas M, Besançon A, Goncalves T, Valette F, Yagita H, Sawitzki B, Volk HD, Waeckel-Enée E, Rocha B, Chatenoud L, You S. TGFb-dependent expression of PD-1 and PD-L1 controls CD8(+) T cell anergy in transplant tolerance. eLife. 2016;5:e08133. - PMC - PubMed

Publication types

MeSH terms

Substances