. 2017 Apr 1;312(4):C446-C458.
doi: 10.1152/ajpcell.00367.2016. Epub 2017 Jan 18.

Kinetic analyses of vasculogenesis inform mechanistic studies

Affiliations

Kinetic analyses of vasculogenesis inform mechanistic studies

Kaela M Varberg et al. Am J Physiol Cell Physiol. .

Abstract

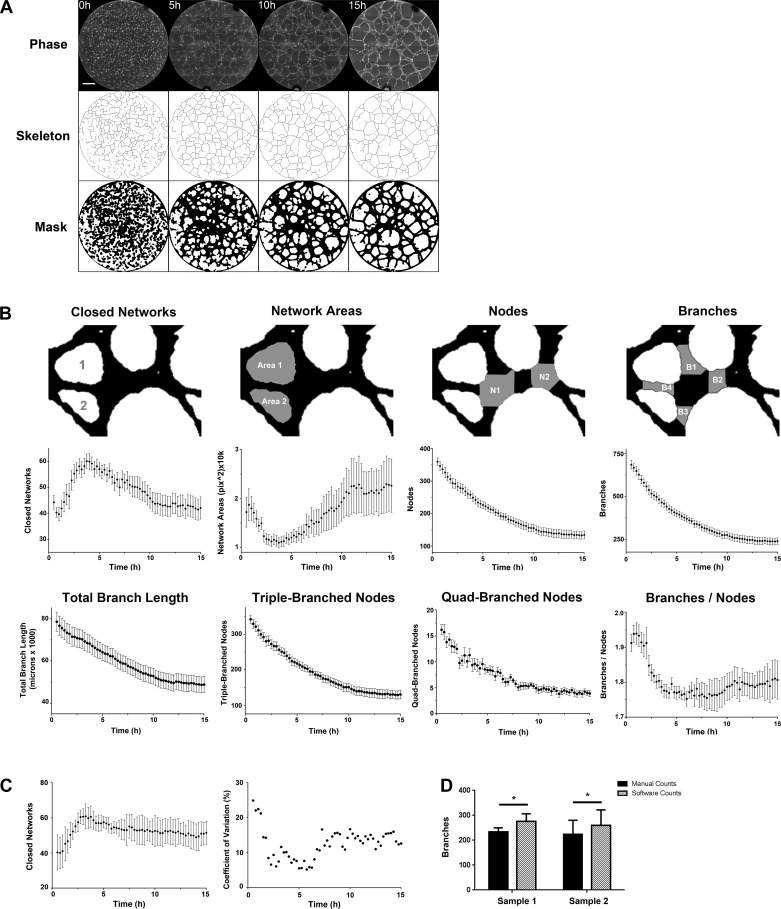
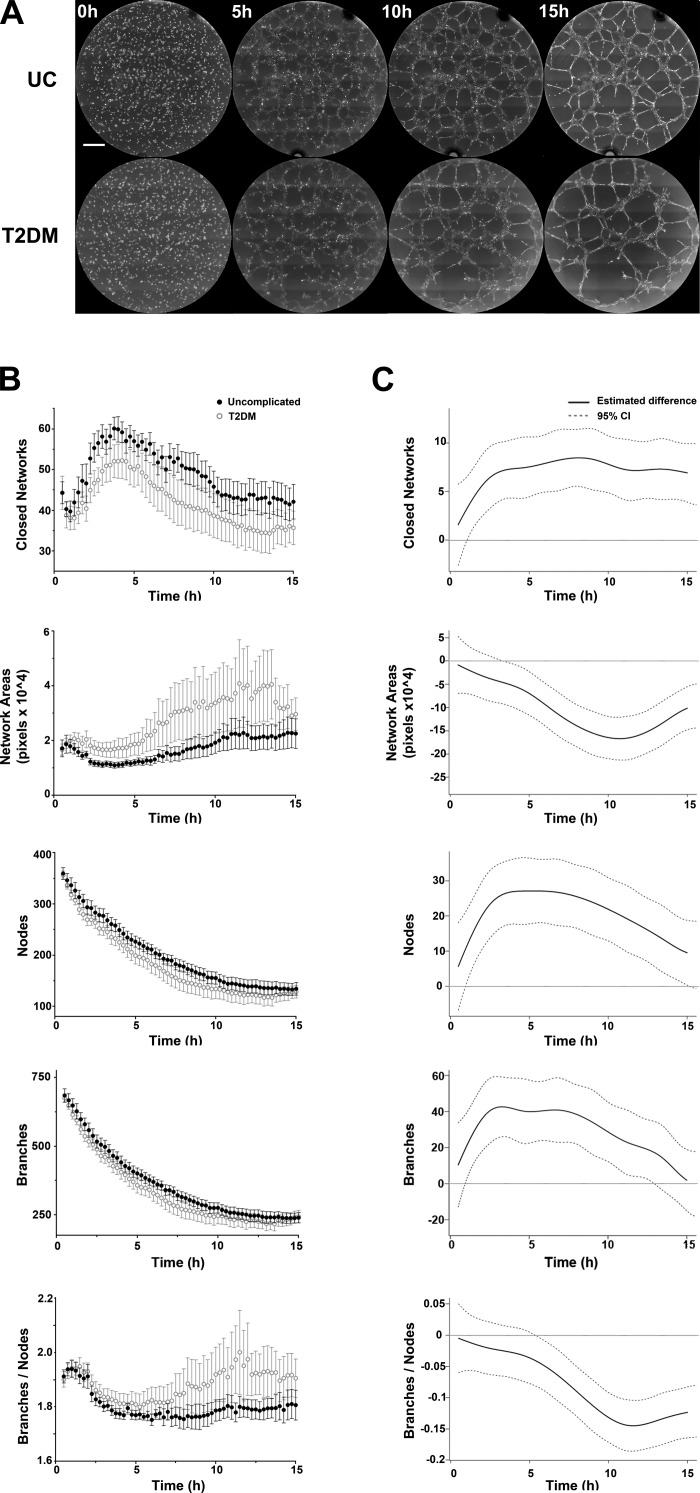
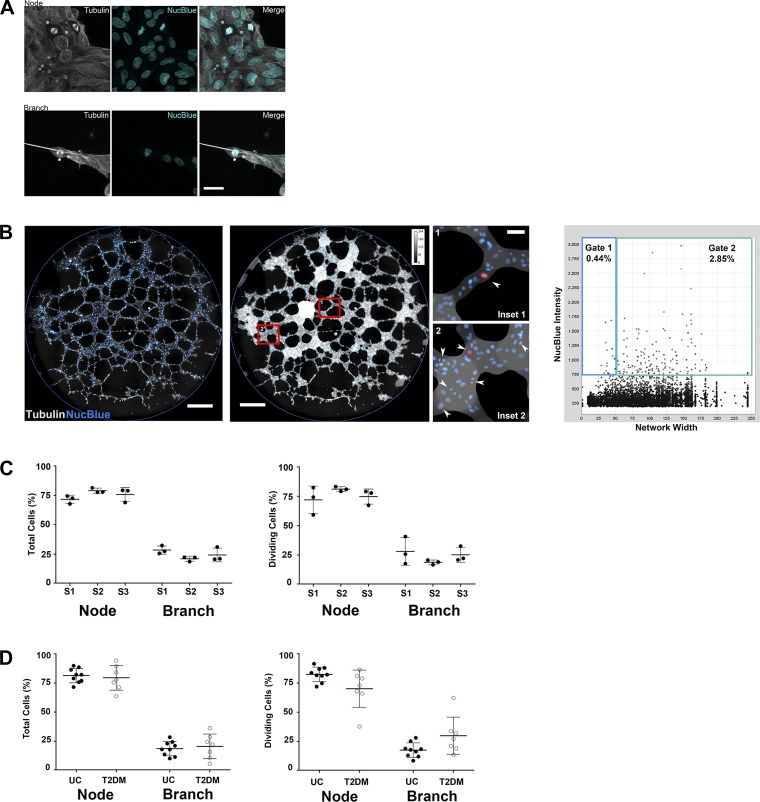
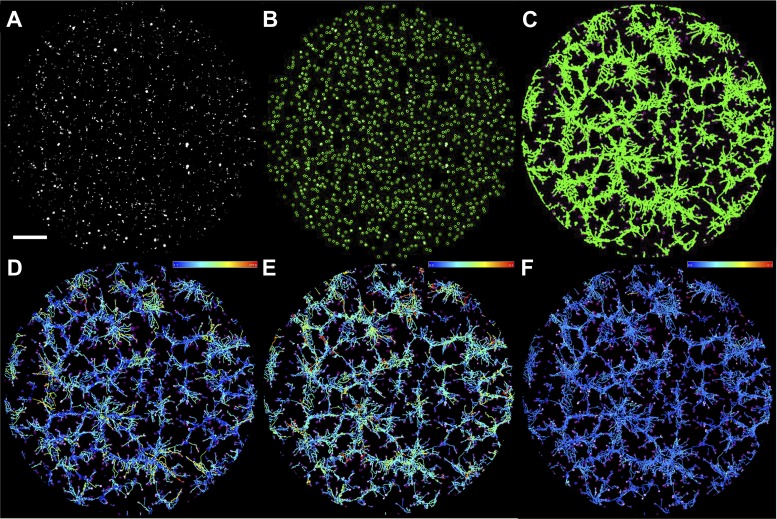
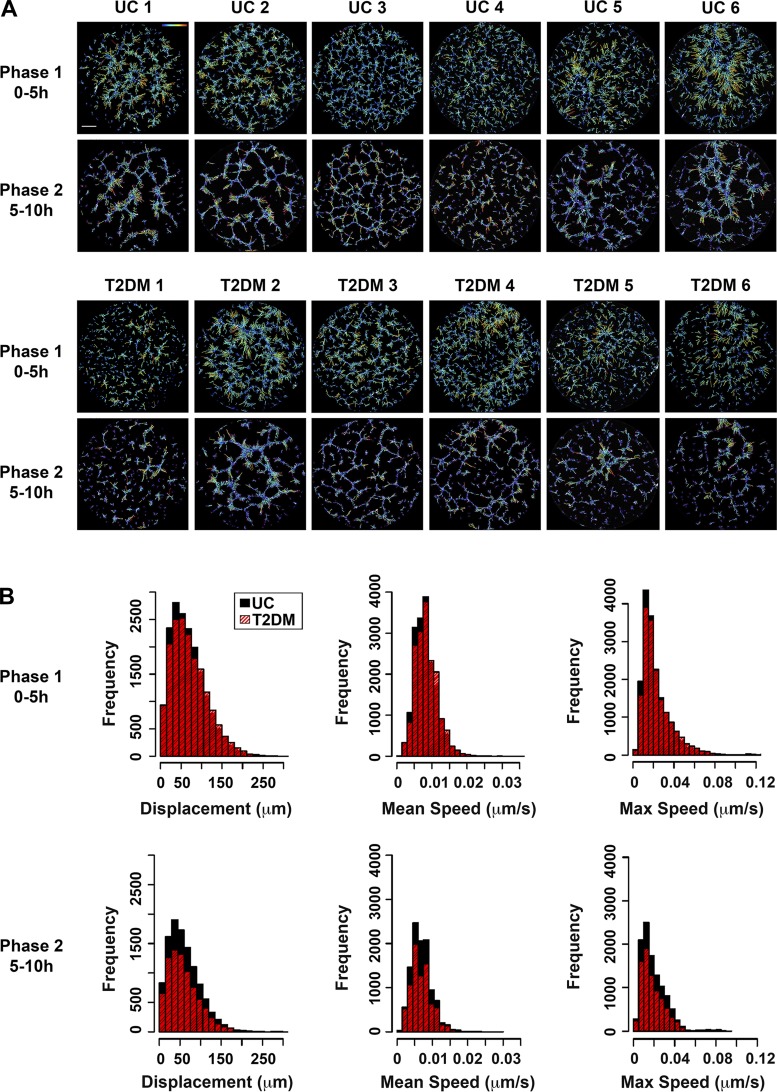
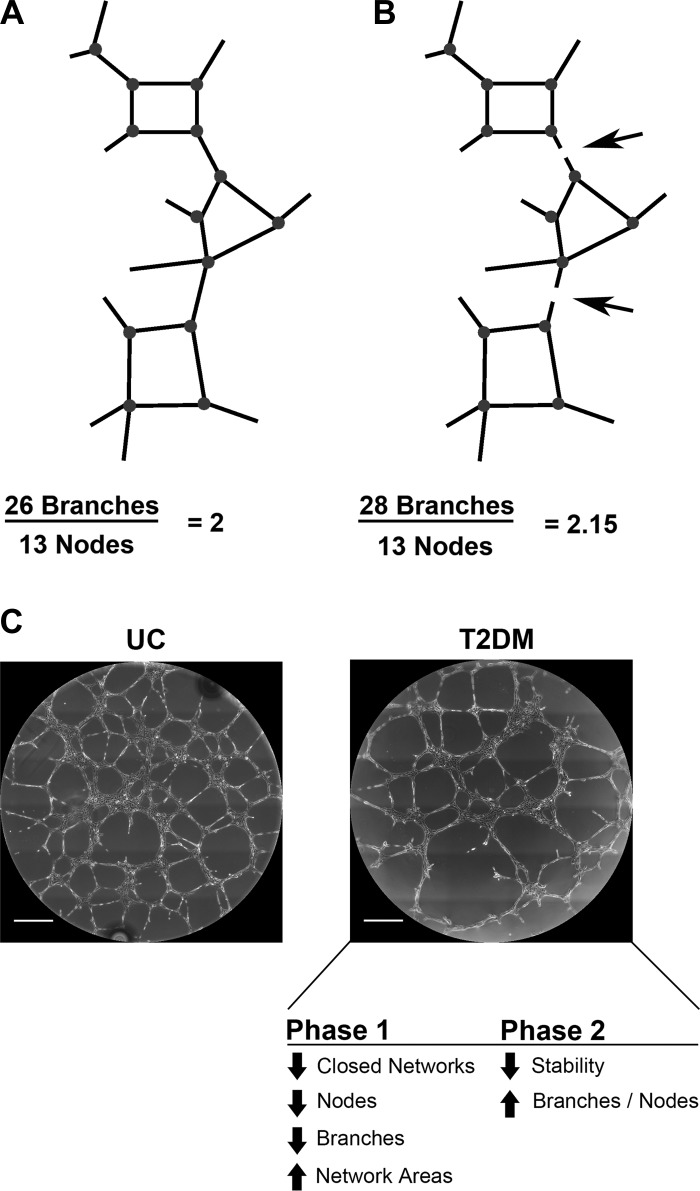
Vasculogenesis is a complex process by which endothelial stem and progenitor cells undergo de novo vessel formation. Quantitative assessment of vasculogenesis is a central readout of endothelial progenitor cell functionality. However, current assays lack kinetic measurements. To address this issue, new approaches were developed to quantitatively assess in vitro endothelial colony-forming cell (ECFC) network formation in real time. Eight parameters of network structure were quantified using novel Kinetic Analysis of Vasculogenesis (KAV) software. KAV assessment of structure complexity identified two phases of network formation. This observation guided the development of additional vasculogenic readouts. A tissue cytometry approach was established to quantify the frequency and localization of dividing ECFCs. Additionally, Fiji TrackMate was used to quantify ECFC displacement and speed at the single-cell level during network formation. These novel approaches were then implemented to identify how intrauterine exposure to maternal diabetes mellitus (DM) impairs fetal ECFC vasculogenesis. Fetal ECFCs exposed to maternal DM form fewer initial network structures, which are not stable over time. Correlation analyses demonstrated that ECFC samples with greater division in branches form fewer closed network structures. Additionally, reductions in average ECFC movement over time decrease structural connectivity. Identification of these novel phenotypes utilizing the newly established methodologies provides evidence for the cellular mechanisms contributing to aberrant ECFC vasculogenesis.

Keywords: diabetes; endothelial; migration; proliferation; vasculogenesis.


Figures

Fig. 1.
Fig. 1.
Kinetic Analysis of Vasculogenesis (KAV) quantitates network metrics. A: images of ECFC network formation were captured every 15 min for 15 h by phase-contrast microscopy. Representative phase-contrast images at 5-h increments, starting at the time of plating (t = 0), are shown. The phase-contrast images were analyzed using KAV to produce both “skeleton” and “mask” renditions of the network structure. The scale bar represents 500 µm. B: mean data of four parameters of network structure are illustrated. Data were quantitated using the newly developed KAV Fiji plug-in over a 15-h period. The top row is a magnified region of mask and depicts, in gray, the parameter analyzed in the line graphs below. Line graphs for the following parameters are shown: closed networks, network area, nodes, branches, total branch length, triple-branched nodes, quadruple-branches nodes, and the ratio of branches to nodes. The line graphs represent the mean ± SE data for 10 separate patient samples from uncomplicated pregnancies. C: to determine day-to-day variation of the assay design, KAV analysis was run for a single ECFC sample on 3 different days. Data shown represent means ± SD. Coefficient of variation (%) is shown for the data in C. D: to validate the KAV software, manual scoring of network formation was compared with data generated by KAV for two individual ECFC samples on 4 different experimental days. The number of branches detected was significantly increased when using KAV compared with manual counting for both samples (*P < 0.05). Data are shown as means ± SD.
Fig. 2.
Fig. 2.
ECFCs from T2DM pregnancies exhibit impaired network formation. A: representative phase-contrast images of ECFCs plated on Matrigel at 5-h increments, starting at the time of plating (t = 0), are shown. ECFCs were obtained from uncomplicated pregnancies (UC) and pregnancies complicated by T2DM. The scale bar represents 500 µm. B: Kinetic Analysis of Vasculogenesis (KAV) software quantitated closed networks, network areas, nodes, branches, and the ratio of total branches divided by total nodes for both UC (●) and T2DM pregnancies (○). The data illustrated represent the means ± SE of 10 separate ECFC samples from each experimental group. C: differences between the mean kinetic curves of the two experimental groups for each parameter are shown as solid black lines with the 95% confidence interval (CI) represented by dotted lines. A significant difference between the curves for a specific time point is detected if the CI of the difference curve does not cross the reference line (y = 0) at that time point.
Fig. 3.
Fig. 3.
Tissue cytometry quantifies the frequency and localization of proliferating ECFCs on Matrigel. A: ECFCs were plated on Matrigel for 5 h, then fixed and stained for α-tubulin (gray) and NucBlue (cyan). Representative photomicrographs of dividing cells in a node and branch are shown. The scale bar represents 30 µm. B: immunofluorescence imaging was performed on entire wells (left, representative image, scale bar = 500 µm). Tissue cytometry (TC) analysis generated an overlay based on α-tubulin immunofluorescence (middle), which was used to quantitate network width and discriminate between node and branch structures. Mitotic cells, highlighted in red, were in branches (inset 1) and nodes (inset 2). TC integrated network width and NucBlue fluorescence intensity to generate scatterplots (right) that included all cells detected in the network (n = 4,733 cells). Gating identified mitotic cells within branches (gate 1) and nodes (gate 2). Scale bars represent 500 µm (panels at left and in middle) and 50 µm (inset 1). C: percentage of total ECFCs (left) and percentage of mitotic ECFCs (right) located in nodes or branches was determined by TC for three independent ECFC samples on 3 days (S1, sample 1; S2, sample 2; S3, sample 3). Individual points represent data from different days. Means ± SD are shown. D: percentage of total ECFCs (left) and percentage of mitotic ECFCs (right) located in nodes or branches was determined for UC and T2DM experimental groups. Graphs represent means ± SD (individual points represent a unique ECFC sample).
Fig. 4.
Fig. 4.
ECFC motility was assessed during network formation using Fiji TrackMate. A: representative photomicrograph of nuclear GFP-labeled ECFCs immediately following plating on Matrigel. GFP fluorescence is shown in gray. B: GFP signal was used to segment individual ECFCs in TrackMate. ECFCs identified by the system are highlighted in green circles. C: the series of fluorescence images acquired over time were analyzed as stacks using Fiji TrackMate. TrackMate produces paths, shown in green, representative of total cell movement over the imaging interval (10 h shown). DF: individual ECFC paths are color coded by the software on the basis of variables such as displacement (D), maximum speed (E), and mean speed (F). The color scales indicate the displacement or speed ranges, with high values depicted by orange/red and low values represented by blue. The scale bar represents 500 µm.
Fig. 5.
Fig. 5.
ECFCs exhibit a wide range of motility. A: time-lapse images of network formation were captured over 10 h. ECFC displacement was assessed separately for phase 1 (0–5 h) and phase 2 (5–10 h). Data from six UC and six T2DM-exposed ECFC samples are shown. A colored path represents total displacement, with greater displacement indicated by orange/red and less displacement indicated in blue. A color scale is located in uncomplicated 1 (UC 1), upper right corner. The scale bar represents 500 µm. B: histograms represent the frequency of ECFC displacement, mean speed, and maximum (max) speed in phases 1 and 2 for UC (black) and T2DM (red) samples. Approximately 35,000 individual ECFCs were analyzed for phase 1 (n = 20 samples, 10 UC and 10 T2DM), and 20,000 individual ECFCs were analyzed for phase 2 (n = 15, 8 UC and 7 T2DM).
Fig. 6.
Fig. 6.
Schematic of network connectivity models of T2DM ECFC phenotypes. A: a model network structure composed of 26 branches and 13 nodes is completely connected to create 1 continuous structure. Because of structure continuity, even though each node has three to four branches, the ratio of branches to nodes equals 2. B: the same network structure is shown, but with breaks in two branches (arrows). No longer a continuous structure, the number of branches identified by KAV increases by 2, resulting in an increase in the branch-to-node ratio to 2.15. Decreased network connectivity results in discontinuous structures, which increases the ratio of branches to nodes. Network structures not to scale. C: representative phase-contrast images from UC and T2DM experimental groups are shown. In summary, our data support a model whereby, in phase 1, T2DM samples exhibit decreased closed networks, nodes, and branches resulting in increased network areas. These changes in early network formation contribute to an overall decrease in network stability leading to an increase in the branch-to-node ratio in phase 2, changes indicative of decreased network connectivity. Scale bars represent 500 µm.

Similar articles

Cited by

References

    1. Abcam Anti-alpha tubulin antibody (DM1A) [Online]. http://www.abcam.com/alpha-tubulin-antibody-dm1a-loading-control-ab7291..... [2017].
    1. Allier CP, Kesavan SV, Coutard JG, Cioni O, Momey F, Navarro F, Menneteau M, Chalmond B, Obeid P, Haguet V, David-Watine B, Dubrulle N, Shorte S, van der Sanden B, Di Natale C, Hamard L, Wion D, Dolega ME, Picollet-D'hahan N, Gidrol X, Dinten JM. Video lensfree microscopy of 2D and 3D cultures of cells. In: Proceedings of SPIE, Imaging, Manipulation, and Analysis of Biomolecules, Cells, and Tissues XII, edited by Farkas DL, Nicolau DV, and Leif RC. San Francisco, CA: SPIE, 2014, vol. 8947, p. 89471H. doi:10.1117/12.2038098. - DOI
    1. Arganda-Carreras I, Fernández-González R, Muñoz-Barrutia A, Ortiz-De-Solorzano C. 3D reconstruction of histological sections: application to mammary gland tissue. Microsc Res Tech 73: 1019–1029, 2010. doi:10.1002/jemt.20829. - DOI - PubMed
    1. Arnaoutova I, Kleinman HK. In vitro angiogenesis: endothelial cell tube formation on gelled basement membrane extract. Nat Protoc 5: 628–635, 2010. doi:10.1038/nprot.2010.6. - DOI - PubMed
    1. Asahara T. Cell therapy and gene therapy using endothelial progenitor cells for vascular regeneration. Handb Exp Pharmacol 180: 181–194, 2007. doi:10.1007/978-3-540-68976-8_8. - DOI - PubMed

LinkOut - more resources