. 2017 Apr 1;117(4):1512-1523.
doi: 10.1152/jn.00704.2016. Epub 2017 Jan 18.

Furosemide depresses the presynaptic fiber volley and modifies frequency-dependent axonal excitability in rat hippocampus

Affiliations

Furosemide depresses the presynaptic fiber volley and modifies frequency-dependent axonal excitability in rat hippocampus

Mogens Andreasen et al. J Neurophysiol. .

Abstract

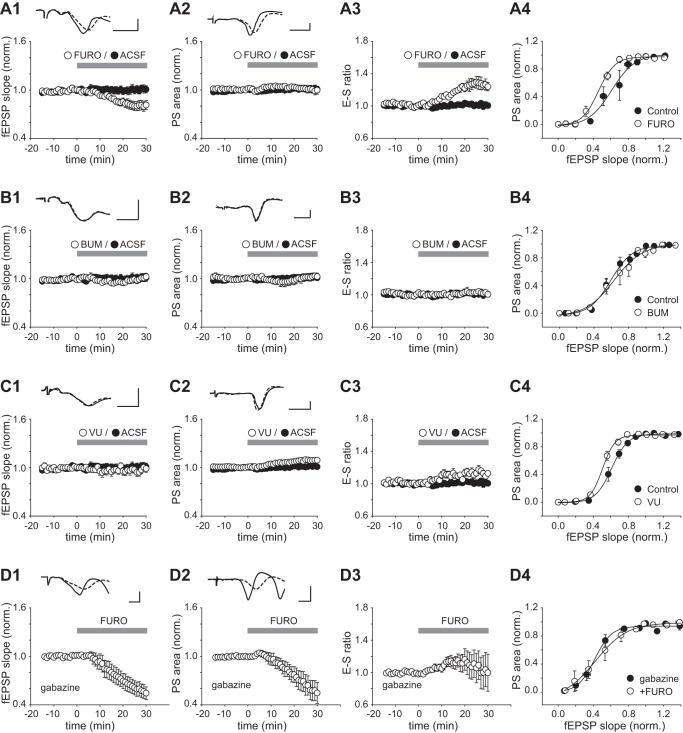
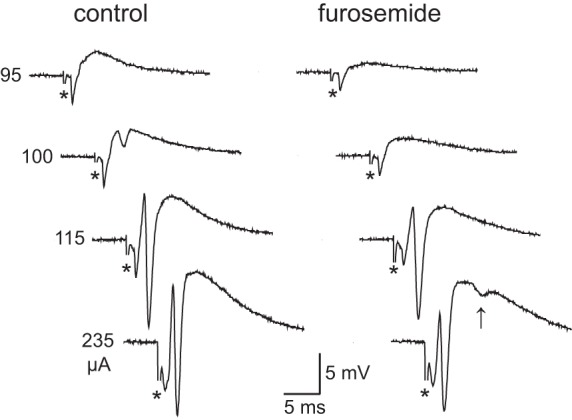
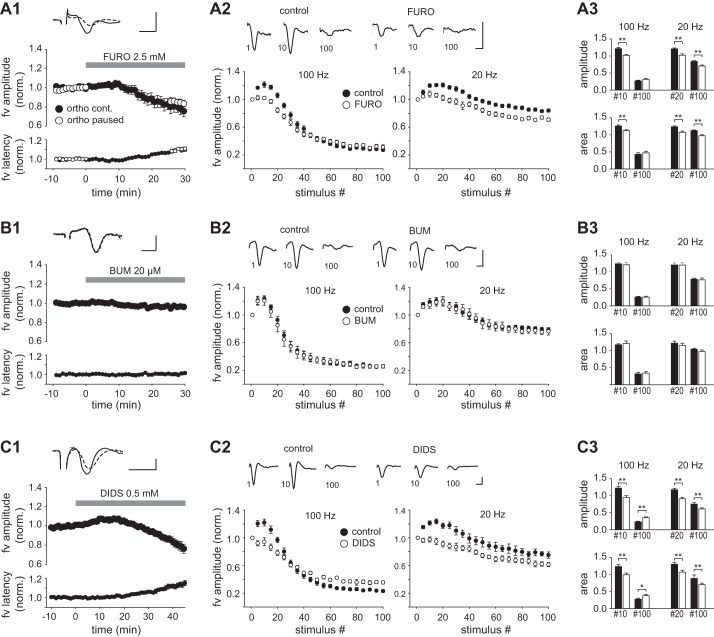
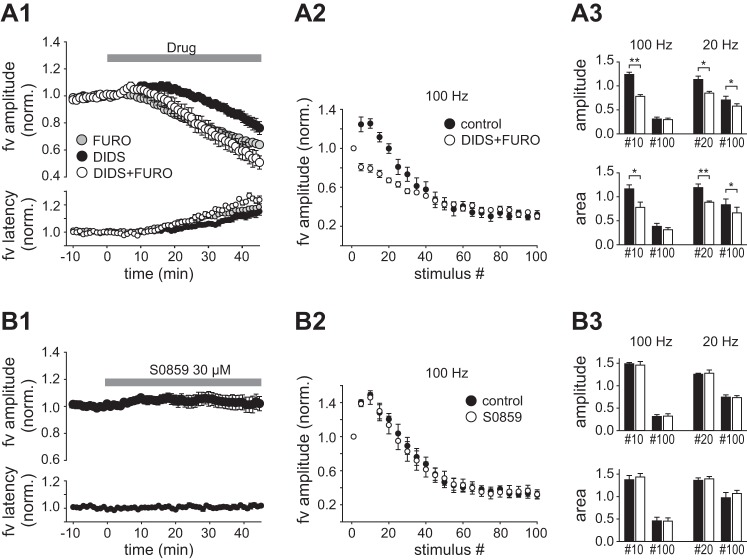
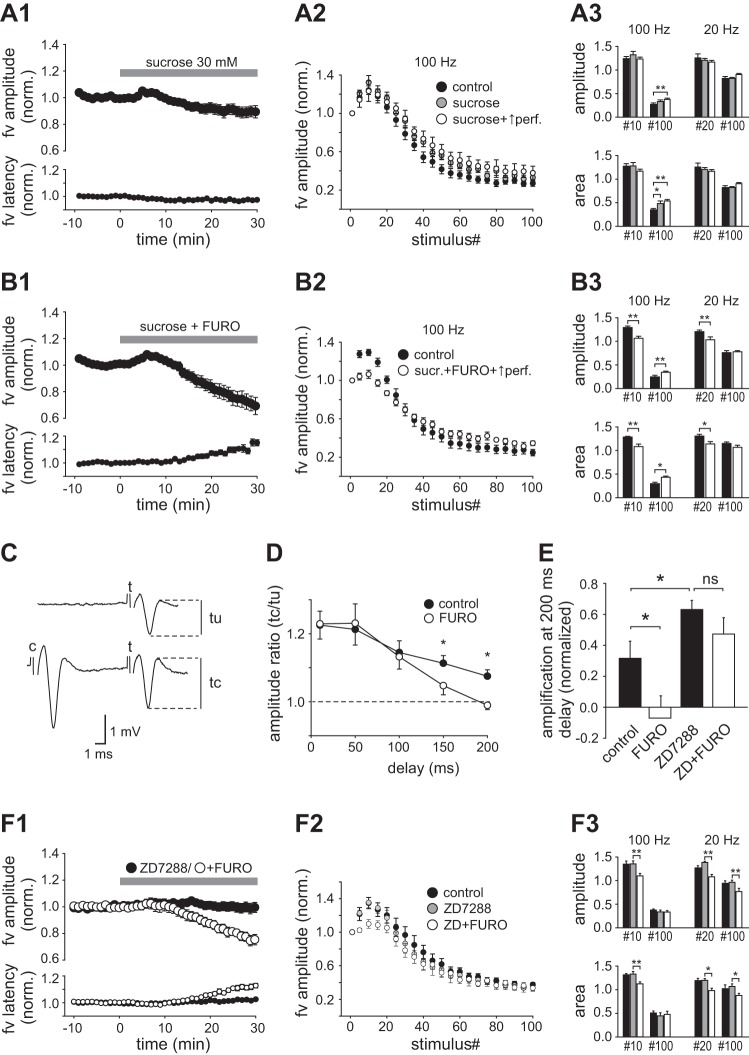
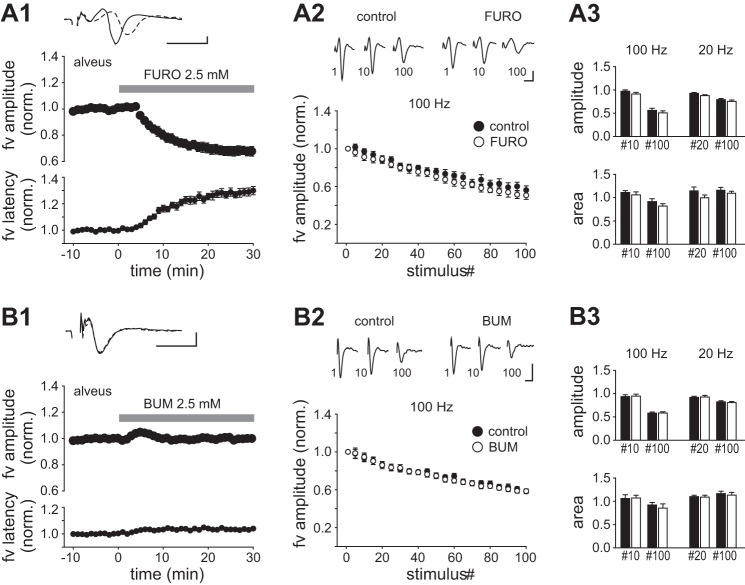
The loop diuretic furosemide is known to have anticonvulsant effects, believed to be exerted through blockade of glial Na+-K+-2Cl- cotransport causing altered volume regulation in brain tissue. The possibility that direct effects of furosemide on neuronal properties could also be involved is supported by previous observations, but such effects have not been thoroughly investigated. In the present study we show that furosemide has two opposing effects on stimulus-induced postsynaptic excitation in the nonepileptic rat hippocampal slice: 1) an enhancement of e-s coupling, which depended on intact GABAA transmission and was partially mimicked by selective blockade of K+-2Cl- cotransport, and 2) a decrement of field excitatory postsynaptic potentials. The balance between these effects varied, depending on the amount of synaptic drive. In addition, the compound action potential (fiber volley) recorded from the stimulated Schaffer collateral axons in stratum radiatum showed a progressive decrease during perfusion of furosemide. This effect was activity-independent, was mimicked by the stilbene derivative DIDS, and could be reproduced on fiber volleys in the alveus. Furosemide also reduced the initial enhancement of the fiber volley observed during trains of high-frequency stimulation (HFS). Results of hyperosmotic expansion of the extracellular volume, with 30 mM sucrose, indicated that both the induction and antagonism of the HFS-induced enhancement were independent of signaling via the extracellular space. Furosemide caused an increased decay of paired-pulse-induced supranormal axonal excitability, which was antagonized by ZD7288. We conclude that furosemide decreases axonal excitability and prevents HFS-induced hyperexcitability via mechanisms downstream of blockage of anion transport, which could include hyperpolarization of axonal membranes.NEW & NOTEWORTHY This study shows that the anion transporter antagonists furosemide and DIDS cause a marked decrease of axonal excitability in rat hippocampal CA1 region and prevent the induction of activity-dependent hyperexcitability in Schaffer collateral axons. The data are consistent with direct effects on axonal membrane properties. We also find that activity-dependent enhancement and depression of axonal excitability can be modified independently, suggesting that these events are governed by different underlying processes.

Keywords: anion transport; axon; excitability; fiber volley; furosemide.


Figures

Fig. 1.
Fig. 1.
Effects of furosemide, bumetanide, and VU0240551 on e-s coupling in the CA1 area. A1–A3: normalized fEPSP slope, PS area, and e-s ratio vs. time in a control period 0–15 min before and 0–30 min after switch to a perfusion medium containing either furosemide (FURO; 2.5 mM) or no added drug (ACSF). Each point represents the average value ± SE from 9 experiments. A1 and A2, top: example records of fEPSPs and PSs averaged over the last 5 min in control (solid trace) and the last 5 min in furosemide (dashed trace). A4: e-s coupling curves showing averaged results from the same experiments. Data were obtained in a control period >15 min before (control) and after 30-min exposure to furosemide (FURO). B–D: plots and traces as in A, but instead of furosemide bumetanide (BUM; 20 µM) was applied in B, VU0240551 (VU; 20 µM) was applied in C, and furosemide (2.5 mM) was applied in the presence of gabazine (15 µM; perfused for >20 min before recordings began) in D. Scale bars: 2 ms, 5 mV throughout.
Fig. 2.
Fig. 2.
Effects of furosemide on stimulus-induced population activity: field potentials in str. pyramidale in response to afferent stimuli at different intensities (95–235 µA) before (control) and after 30-min perfusion of furosemide (2.5 mM). Note that in the presence of furosemide the 100-µA stimulus becomes subthreshold (with respect to the PS) and an extra PS is apparent with the 235-µA stimulus (indicated by arrow). Asterisks denote stimulus artifacts.
Fig. 3.
Fig. 3.
Effects of furosemide, bumetanide, and DIDS on the fiber volley in CA1 str. radiatum. A1: plots of the normalized amplitude and latency to peak of the fiber volley (fv) vs. time, 0–10 min before and 0–30 min after starting perfusion of furosemide. Symbols represent the means ± SE of 12 consecutive responses (1 min) evoked by continuous orthodromic stimulation (filled circles) or paused (0–25 min) stimulation (open circles). Top: example records of averaged fiber volleys taken 0–1 min before (solid trace) and 29–30 min after starting perfusion of furosemide (dashed trace). A2: averaged fiber volley amplitude as function of stimulus number in HFS trains of 100 Hz and 20 Hz (100 stimuli in both). Results from every 5th stimulus are shown. Measurements were done >10 min before (control) and after exposure to furosemide for >30 min (FURO). Data from each experiment were normalized to the amplitude at stimulus 1. Means ± SE from 17 experiments are shown. Top: example records of fiber volleys evoked at stimuli 1, 10, and 100 during a 100-Hz train. A3: summary histograms comparing the normalized amplitudes (top) and areas (bottom) of near-maximally enhanced fiber volleys (stimulus 10 at 100 Hz; stimulus 20 at 20 Hz) and of the volleys evoked at stimulus 100 in control (filled bars) and in the presence of furosemide (open bars). B and C: plots as in A, but instead of furosemide bumetanide (20 µM, 30 min) was applied in B and DIDS (0.5 mM, 45 min) was applied in C. Data in A–C were all obtained in the presence of CNQX (20 µM), MK 801 (10 µM), and CGP55845 (2 µM). Scale bars: 1 ms, 2 mV. *P < 0.05; **P < 0.01.
Fig. 4.
Fig. 4.
Effects of coapplied DIDS and furosemide and of S0859 on the fiber volley. A1: normalized fiber volley amplitude and latency recorded during washin of furosemide (2.5 mM, n = 5), DIDS (0.5 mM, n = 9), or the 2 drugs combined (n = 5). A2: fiber volley amplitude as function of stimulus number (normalized to stimulus 1) in HFS trains of 100 Hz before (control) and after 45-min perfusion of DIDS + furosemide. A3: summary histograms comparing amplitude (top) and area (bottom) of near-maximally enhanced fiber volleys (stimulus 10 at 100 Hz; stimulus 20 at 20 Hz) and of the volleys evoked at stimulus 100 from the control period (filled bars) and in the presence of DIDS + furosemide (open bars) B: plots as in A but recorded with perfusion of S0859 (30 µM). *P < 0.05; **P < 0.01.
Fig. 5.
Fig. 5.
Effects of sucrose on the fiber volley and modification of paired-pulse enhancement of excitability by furosemide and ZD7288. A1: normalized fiber volley amplitude and latency before (10 min) and during perfusion of sucrose (30 min). A2: fiber volley amplitude as function of stimulus number in 100-Hz trains evoked before sucrose (control), during perfusion of sucrose at normal rate (1 ml/min; sucrose), and after 5 min of increased perfusion rate (3 ml/min; sucrose + ↑perf). A3: comparison of amplitudes (top) and areas (bottom) of near-maximally enhanced fiber volleys (stimulus 10 at 100 Hz; stimulus 20 at 20 Hz) and of volleys evoked at stimulus 100 in the control period (filled bars) and in the presence of sucrose with normal (gray bars) and increased (open bars) perfusion rate. B: plots as in A, but with coapplication of sucrose (30 mM) and furosemide (2.5 mM). In B2 and B3 only control data and data with high perfusion rate (with sucrose and furosemide) are included. C: recordings of fiber volleys evoked by equal test stimuli (t) in the absence (tu) and presence (tc) of a preceding conditioning stimulus (c) of larger intensity. Stimulation frequency = 0.1 Hz. D: amplitude ratio (tc/tu) plotted as a function of delay from the conditioning stimulus in the control condition and during perfusion of furosemide (2.5 mM). E: fiber volley amplification [(tc − tu)/tu] at 200-ms delay normalized to the amplification at 50-ms delay (= 1.0) in the control condition and during perfusion of furosemide (2.5 mM), ZD7288 (20 µM), and the 2 drugs combined. F: plots as in A, showing effects of ZD7288 (20 µM) applied alone and furosemide (2.5 mM) applied during continuous perfusion of ZD7288. *P < 0.05; **P < 0.01.
Fig. 6.
Fig. 6.
Effects of furosemide and bumetanide on fiber volleys in the alveus. A1: time course of the amplitude and latency to peak (normalized) of the fiber volley measured in the alveus before and during perfusion of furosemide. Top: example records show fiber volley before (solid trace) and after 29–30 min in furosemide (dashed trace). A2: fiber volley amplitude as function of stimulus number in HFS trains of 100 Hz before (control) and after exposure to furosemide for >30 min (FURO). Top: records of fiber volleys evoked at stimuli 1, 10, and 100 (100 Hz). A3: comparison of the normalized amplitudes (top) and areas (bottom) of fiber volleys evoked at stimuli 10 (100 Hz), 20 (20 Hz), and 100 (100 Hz and 20 Hz) taken from control period (filled bars) and in the presence of furosemide (open bars). B: plots as in A, but instead of furosemide bumetanide (20 µM, 30 min) was perfused. All recordings were done with CNQX (20 µM), MK 801 (10 µM), and CGP55845 (2 µM) present. Scale bars: 1 ms, 2 mV.

Similar articles

Cited by

References

    1. Ahmad S, Clarke L, Hewett AJ, Richens A. Controlled trial of frusemide as an antiepileptic drug in focal epilepsy. Br J Clin Pharmacol 3: 621–625, 1976. doi:10.1111/j.1365-2125.1976.tb04885.x. - DOI - PMC - PubMed
    1. Deisz RA, Lux HD. The role of intracellular chloride in hyperpolarizing post-synaptic inhibition of crayfish stretch receptor neurones. J Physiol 326: 123–138, 1982. doi:10.1113/jphysiol.1982.sp014181. - DOI - PMC - PubMed
    1. Deisz RA, Wierschke S, Schneider UC, Dehnicke C. Effects of VU0240551, a novel KCC2 antagonist, and DIDS on chloride homeostasis of neocortical neurons from rats and humans. Neuroscience 277: 831–841, 2014. doi:10.1016/j.neuroscience.2014.07.037. - DOI - PubMed
    1. Deitmer JW, Rose CR. Ion changes and signalling in perisynaptic glia. Brain Res Brain Res Rev 63: 113–129, 2010. doi:10.1016/j.brainresrev.2009.10.006. - DOI - PubMed
    1. Delpire E, Days E, Lewis LM, Mi D, Kim K, Lindsley CW, Weaver CD. Small-molecule screen identifies inhibitors of the neuronal K-Cl cotransporter KCC2. Proc Natl Acad Sci USA 106: 5383–5388, 2009. doi:10.1073/pnas.0812756106. - DOI - PMC - PubMed

MeSH terms

LinkOut - more resources