

Protein synthesis inhibition and GADD34 control IFN-β heterogeneous expression in response to dsRNA
- PMID: 28100675
- PMCID: PMC5350567
- DOI: 10.15252/embj.201695000
Protein synthesis inhibition and GADD34 control IFN-β heterogeneous expression in response to dsRNA
Abstract
In innate immune responses, induction of type-I interferons (IFNs) prevents virus spreading while viral replication is delayed by protein synthesis inhibition. We asked how cells perform these apparently contradictory activities. Using single fibroblast monitoring by flow cytometry and mathematical modeling, we demonstrate that type-I IFN production is linked to cell's ability to enter dsRNA-activated PKR-dependent translational arrest and then overcome this inhibition by decreasing eIF2α phosphorylation through phosphatase 1c cofactor GADD34 (Ppp1r15a) expression. GADD34 expression, shown here to be dependent on the IRF3 transcription factor, is responsible for a biochemical cycle permitting pulse of IFN synthesis to occur in cells undergoing protein synthesis inhibition. Translation arrest is further demonstrated to be key for anti-viral response by acting synergistically with MAVS activation to amplify TBK1 signaling and IFN-β mRNA transcription, while GADD34-dependent protein synthesis recovery contributes to the heterogeneous expression of IFN observed in dsRNA-activated cells.
Keywords: RIG‐I‐like receptors; cGAMP; integrated stress response; puromycin; stress granules.
© 2017 The Authors.
Figures
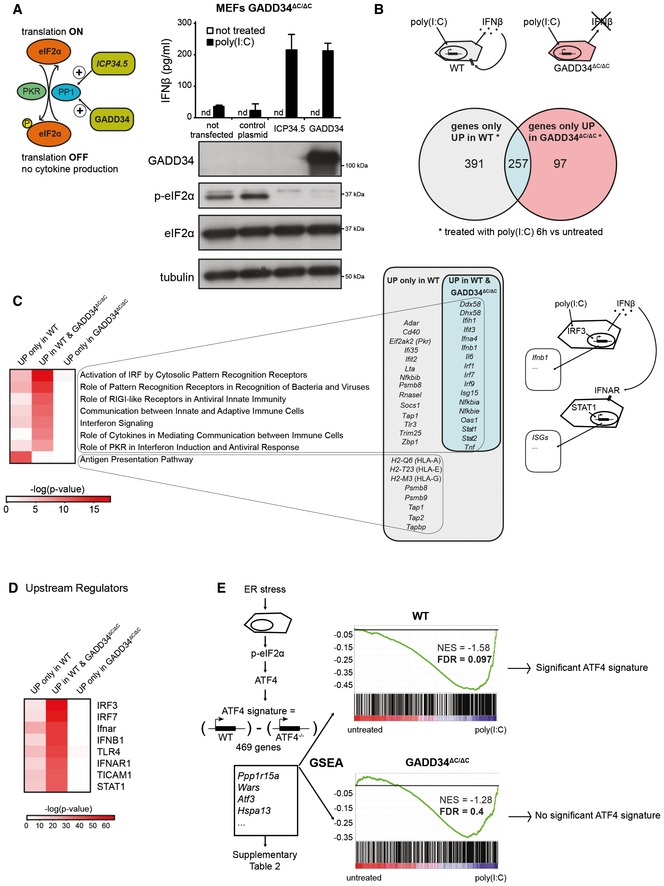
Left: Graphical abstract of GADD34 and herpes simplex viral protein ICP34.5 effects on translation initiation. ICP34.5 mimics PP1 cofactor GADD34 activity and contributes to dephosphorylation of eIF2α. As a result, the translation inhibition mediated by eIF2α kinases such as PKR is relieved. Right: GADD34ΔC/ΔC MEFs were transfected with the indicated plasmid constructs 24 h before HMW poly(I:C) delivery. After 6 h of treatment, culture supernatants were collected and IFN‐β production was measured by ELISA (mean ± SD of three independent experiments). Representative detection of GADD34, eIF2α, and p‐eIF2α by immunoblot in the lysate of the same group of cells. Tubulin is used as a loading control. “nd” stands for “not detected”.
Top: Schematic representation of WT cells treated with poly(I:C) and producing IFN‐β. This cytokine triggers specific signaling via IFNAR receptor in an autocrine or paracrine manner, whereas GADD34ΔC/ΔC MEFs do not produce IFN‐β. Bottom: Venn diagram representation of statistically upregulated genes in WT and GADD34ΔC/ΔC MEFs after 6 h of HMW poly(I:C) treatment. The complete sets of genes are detailed in Appendix Table S1.
Heat maps of selected pathways found enriched by ingenuity pathway analysis (IPA) for the DEGs depicted in Venn diagrams. Selected genes belonging at least to one of the IPA pathways are shown and grouped according to their expression specificity. Right: Schematic representation of poly(I:C)‐treated cells showing IRF3‐dependent induction of genes, like IFN‐β, and the concomitant induction in neighboring cells of IFN‐stimulated genes (ISGs) after IFNAR stimulation.
Heat‐map representation of selected putative upstream regulators found enriched by IPA for the different DEGs sets.
Gene set enrichment analyses (GSEAs) of a defined ATF4 gene expression regulated signature (Appendix Table S2), on the pairwise comparisons of WT MEFs untreated vs poly(I:C) (left panel) and GADD34ΔC/ΔC MEFs untreated vs poly(I:C) (right panel). The more the ATF4 regulated signature gene set is differentially expressed between conditions, the more the bar code is shifted to the corresponding extremity. NES: normalized enrichment score; FDR: false discovery rate.
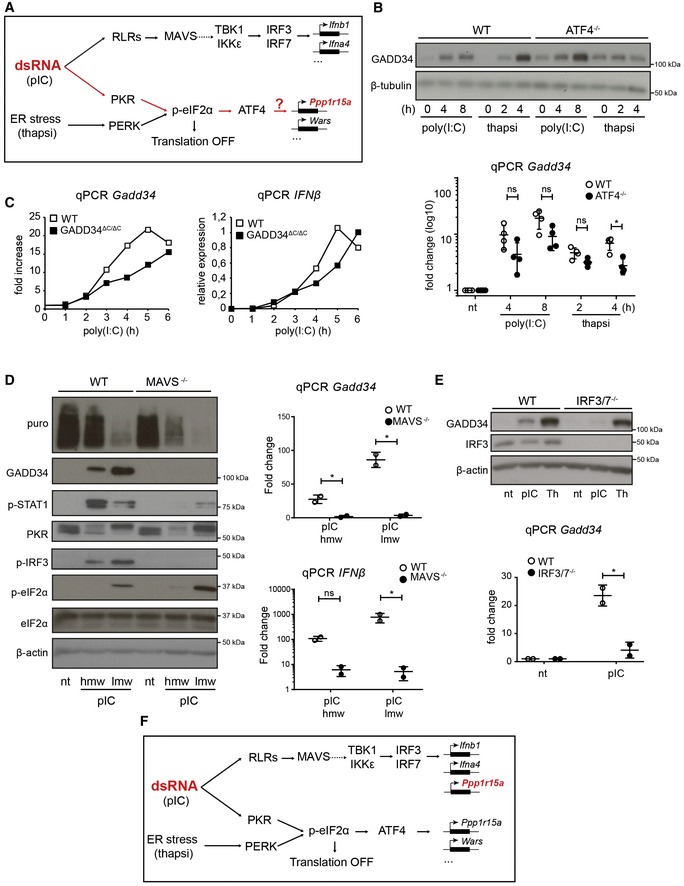
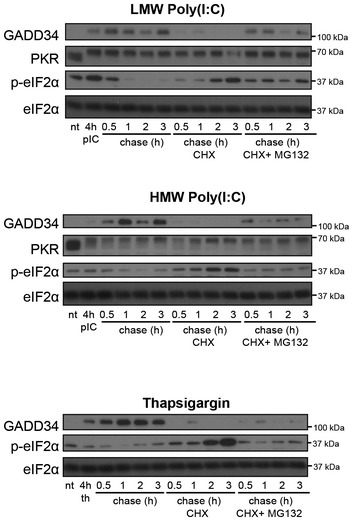
Schematic representation of known signaling pathways involved during dsRNA response and the UPR. Two distinct pathways are triggered in the cytosol of infected cells: RIG‐I‐like receptors (RLRs) detect dsRNA and trigger IRF3 activation via MAVS, while PKR stimulation leads to protein translation inhibition and ATF4‐dependent gene transcription (e.g., GADD34), as observed after PERK activation during thapsigargin‐induced ER stress.
WT and ATF4−/− MEFs were treated with HMW poly(I:C) for 4 h and 8 h, or with thapsigargin (thapsi) for 2 h and 4 h. Expression of GADD34 was analyzed by immunoblot and by qPCR (mean ± SD of five independent experiments). Tubulin is shown as a loading control for immunoblot.
WT and GADD34ΔC/ΔC MEFs were stimulated with LMW poly(I:C). GADD34 and IFNB mRNA expression was monitored by qPCR for 6 h after dsRNA delivery.
WT and MAVS−/− MEFs were analyzed by immunoblot (left) and by qPCR (right panels) after stimulation with poly(I:C) (pIC). Protein synthesis was determined using puromycin labeling followed by immunoblot with the anti‐puromycin mAb. GADD34, p‐STAT1, PKR, p‐IRF3, eIF2α, and p‐eIF2α levels were monitored by immunoblot. Actin is shown as a loading control. Fold increase compared to non‐treated cells in normalized mRNA levels. Each point represents result of one independent experiment.
GADD34 expression was determined by immunoblot and by qPCR in WT and IRF3/7−/− MEFs after HMW poly(I:C) or thapsigargin (Th) treatment. qPCR are the mean ± SD of three independent experiments (“nt” stands for “not treated”).
Schematic representation of predicted signaling pathways involved during dsRNA response and the UPR, according to the results shown in (B–D). GADD34 induction belongs to the primary transcriptional response consecutive to dsRNA sensing and is dependent on IRF3/IRF7 transcription factors, together with IFN‐β.
- A, B
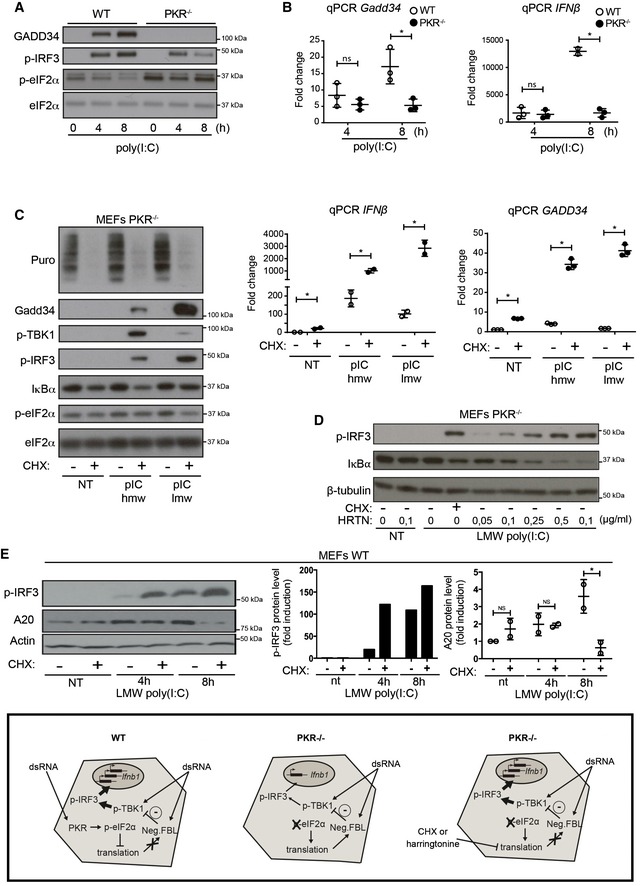
WT and PKR−/− MEFs were stimulated with HMW poly(I:C) for 4 h and 8 h. (A) GADD34, p‐IRF3, and p‐eIF2α/eIF2α were detected by immunoblot. (B) GADD34 and IFNB mRNA expression were determined by qPCR in WT and PKR−/− MEFs. Results are the mean ± SD of three independent experiments.
- C
PKR−/− MEFs were treated or not with 5 μg/ml of cycloheximide (CHX), together with poly(I:C) for 8 h. Protein synthesis was monitored using puromycin labeling followed by immunoblot with an anti‐puromycin mAb. Expression of the indicated proteins was determined by immunoblot (left). GADD34 and IFNB mRNA levels were quantified by qPCR (right). Data are representative of three independent experiments. Results are the mean ± SD of three independent experiments.
- D
PKR−/− MEFs were treated or not with the indicated concentration of harringtonine, before monitoring p‐IRF3 levels and IκBα expression by immunoblot after 8 h of dsRNA exposure. Non‐treated (nt, control without poly(I:C)) and CHX treatment were used as negative and positive references. Tubulin is shown as a loading control.
- E
WT MEFs were treated with LMW poly(I:C) for the indicated time before monitoring p‐IRF3 levels and A20 level by immunoblot (left panel). P‐IRF3 (middle) and A20 protein levels (right) were quantified by ImageJ quantification. Graphs represent data normalized to non‐treated samples, n = 2. A schematic representation of the experimental design and corresponding results is boxed at the bottom of the figure. Results are the mean ± SD of three independent experiments.
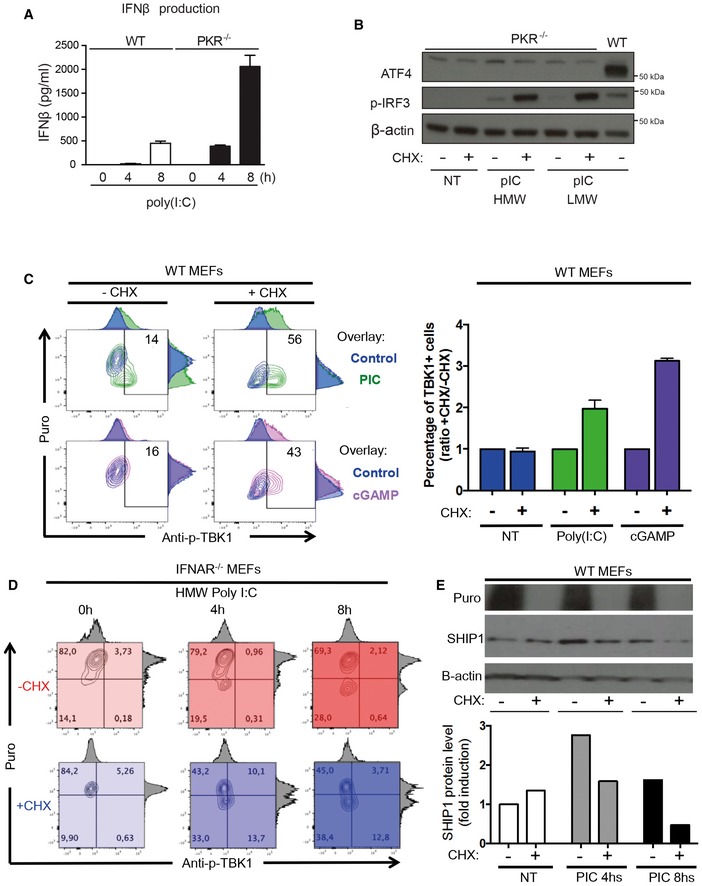
IFN‐β production was measured by ELISA in cell culture supernatants of WT and PKR−/− MEFs that were stimulated with HMW poly(I:C) for 4 and 8 h. Results are the mean ± SD of three independent experiments.
PKR−/− MEFs were left untreated (NT) or were treated with HMW or LMW poly(I:C) for 8 h in the presence or not of 5 μg/ml of cycloheximide (CHX). ATF4 and phospho‐IRF3 levels in nuclear extracts were detected by immunoblot. β‐actin was used as equal loading control. WT MEFs were treated with LMW poly(I:C) for 4 h and the corresponding nuclear extract was used as a positive control for ATF4 detection.
WT MEFs were lipofected with poly(I:C) (green) or cGAMP (pink) for the indicated time in the presence or absence of CHX. Cells were pulsed with puromycin prior to collection, staining with anti‐puromycin and anti‐pTBK1 and flow cytometry analysis. Quantification is presented as histograms on the right (n ≥ 2). Bars are mean ± SD.
IFNAR1−/− MEFs were lipofected with poly(I:C) for the indicated time in the presence (shades of blue) or absence (shades of red) of CHX. Cells were pulsed with puromycin prior to collection, staining with anti‐puromycin and anti‐pTBK1, and flow cytometry analysis.
IFNAR1−/− MEFs were lipofected with poly(I:C) for the indicated time in the presence or absence of CHX. Cells were pulsed with puromycin prior to collection and immunoblot detection of puromycin and SHIP‐1. β‐actin was used as equal loading control. Quantification of the blot is presented below.
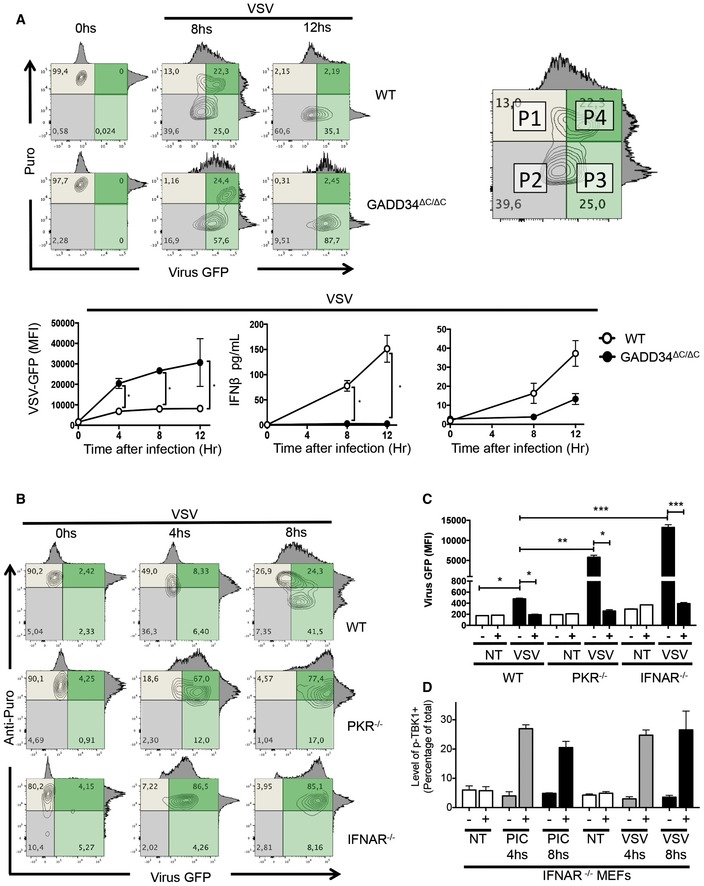
WT and Gadd34ΔC/ΔC MEFs were inoculated with VSV‐GFP for the indicated time points. As depicted in the contour plots, the level of total translation (puromycin incorporation, Puro y‐axis, gray) and viral GFP expression (x‐axis, green)) were measured using anti‐puromycin staining and flow cytometry. An example of how flow quadrants (P1–P4) are labeled is shown (right). The kinetics of VSV‐GFP expression (GFP MFI) in WT and Gadd34ΔC/ΔC MEFs is shown (lower left panel). Induction of GADD34 measured by FACS and concentration of IFN‐β in the supernatant of VSV‐infected WT, and Gadd34ΔC/ΔC MEFs are shown in the lower panel.
WT, PKR−/−, and IFNAR1−/− MEFs were inoculated with VSV‐GFP (green) for 4–8 h prior to being subjected to puromycin incorporation and anti‐puromycin staining (gray) for flow cytometry analysis.
WT, PKR−/−, and IFNAR1−/− MEFs were inoculated with VSV‐GFP in the presence or absence of 5 μg/ml of cycloheximide (CHX) and viral GFP levels were measured by flow cytometry after 8 h of treatment.
IFNAR1−/− MEFs were inoculated with VSV‐GFP or lipofected with poly(I:C) for the indicated time in the presence or absence of CHX. Cells were collected and stained with anti‐pTBK1 and quantified by flow cytometry.
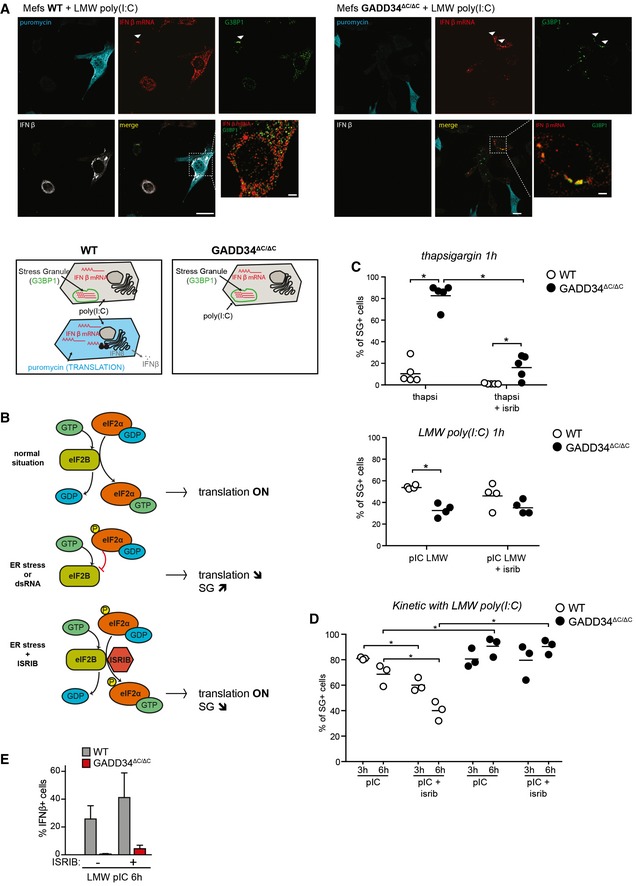
Fluorescence in situ hybridization (FISH) staining for IFNB mRNA, combined with immunofluorescence confocal microscopy to detect protein translation (puromycin), stress granules (G3BP1), and IFN‐β protein in WT and GADD34ΔC/ΔC MEFs stimulated with LMW poly(I:C) for 6 h and labeled with puromycin for 10 min. Scale bars = 10 μm. Examples of colocalization between IFNB mRNA and G3BP1 in stress granules are indicated by arrowheads. Schematic representation of the different situations observed in both cell lines is shown below.
Graphical abstract of the mechanism of action of ISR inhibitor (ISRIB). The small molecule ISRIB is able to prevent the dominant negative effects of p‐eIF2α on the guanine exchange factor (GEF) activity of eIF2B in cells undergoing ER stress. ISRIB facilitates therefore translation initiation even in the presence of large amounts of p‐eIF2α and is able to reverse the effects of a stress response such as translation decrease or stress granule formation.
Percentages of SG‐containing cells within the total cell population were determined using software‐assisted quantification (see Appendix Supplementary Materials and Methods for details) from immunofluorescence mosaic images of WT and GADD34ΔC/ΔC MEFs stimulated with thapsigargin (left panel) or LMW poly(I:C) (right panel) for 1 h. When indicated, ISRIB was added to the cells at the time of stimulation. Each plot corresponds to one replicate out of five (left) or four (right) independent experiments. Means are represented with bars. The total number of counted cells in each replicate was comprised between 500 and 1,500. P‐values were calculated using a Student's t‐test, *P < 0.05.
Same as (C) except that MEFs were stimulated with LMW poly(I:C) for 3 h or 6 h.
Percentile of IFN‐β‐producing cells determined by flow cytometry. The results are the mean ± SD of four independent experiments. ISRIB has little impact on the protein synthesis inhibition triggered by dsRNA stimulation of PKR.
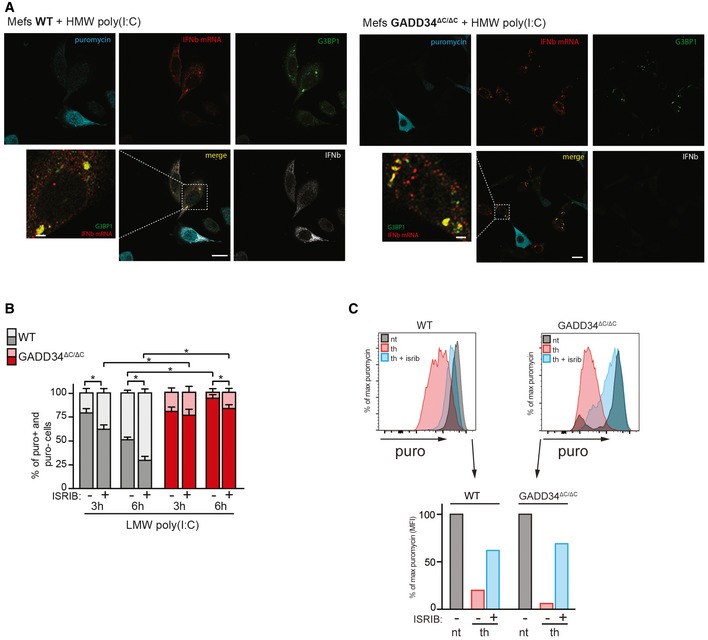
Fluorescence in situ hybridization (FISH) for IFNB mRNA, combined with immunofluorescence staining for protein synthesis (with an anti‐puromycin mAb), for stress granules (with anti‐G3BP1 Ab) and for IFN‐β protein in WT and GADD34ΔC/ΔC MEFs stimulated with HMW poly(I:C) for 6 h and labeled with puromycin for 10 min. Scale bars = 10 μm.
WT and GADD34ΔC/ΔC MEFs were stimulated with LMW poly(I:C) for indicated times in the presence of ISRIB and puromycin for protein synthesis measurement by FACS. Percentiles of translating (puro+, light color) and non‐translating cells (puro−, dark color) were determined by flow cytometry from fluorescence intensity of individual cells and are represented as cumulative bars for WT (gray) and GADD34ΔC/ΔC MEFs (red). P‐values were calculated using a Student's t‐test, *P < 0.05. Mean ± SD.
Similar experiments were conducted with thapsigargin and ISRIB. In UPR conditions, ISRIB rescued protein synthesis efficiently, confirming the efficacy of the drug on this pathway. Although ISRIB abrogates the impact of eIF2α phosphorylation on translation initiation during ER stress, it does not efficiently restore protein synthesis and cytokines production in cells responding to dsRNA.
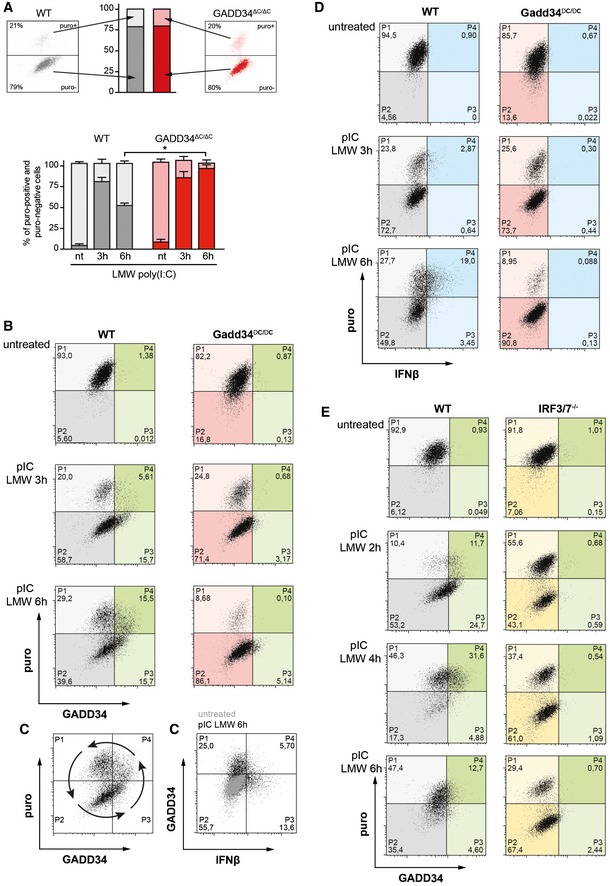
Two‐dimensional plots of fluorescence intensity of individual WT (left panel, grey) and GADD34ΔC/ΔC MEFs (right panel, red) stimulated with poly(I:C) for 3 h prior to staining for puromycin (y‐axis) and GADD34 (x‐axis). The percentiles of translating (puro+, light color) and non‐translating cells (puro−, dark color) were determined from the plots of fluorescence intensity of individual cells and are represented as cumulative bars for WT (grey) and GADD34ΔC/ΔC MEFs (red). Mean ± SD of four independent experiments is shown for not treated 0 h (nt), and 3 and 6 h poly(I:C)‐treated MEFs. P‐values were calculated using a Student's t‐test, *P < 0.05. Translation recovery at 6 h is around 50% of WT cells and hardly occurs in GADD34ΔC/ΔC cells.
Two‐dimensional plots of fluorescence intensity of individual WT (left panels, gray and green) and GADD34ΔC/ΔC MEFs (right panels, red and green) stimulated with poly(I:C) for 0, 3, 6 h prior to staining for puromycin (y‐axis) and GADD34 (x‐axis). Translating cells are detected in the two upper quadrants (P1 and P4), cells in which protein synthesis is inhibited are in the two lower quadrants (P2 and P3), and cells expressing GADD34 are shifted in the two right quadrants (P3 and P4, green). The progression over time of the dsRNA‐stimulated cells through the different quadrants suggests a cycle and potentially, an oscillation of protein synthesis and IFN‐β production.
Same as (B) with GADD34 staining on the y‐axis and IFN‐β on the x‐axis. Cells that produce IFN‐β rarely express the GADD34 protein, despite a common transcriptional regulation. This indicates that full translation recovery is necessary for IFN‐β production, a situation that is likely promoting a rapid GADD34 loss.
Same experiment as in (B) but cells expressing IFN‐β are in the two right quadrants (blue). IFN‐β production only occurs in the cells that are active in protein synthesis.
Two‐dimensional plots of fluorescence intensity of WT (left panels) and IRF3/IRF7−/− MEFs (right panels) stimulated with poly(I:C) for 0, 2, 4, and 6 h prior to staining for puromycin (y‐axis) and GADD34 (x‐axis). IRFs are necessary for GADD34 expression and their inactivation renders cell incapable of restoring protein synthesis after dsRNA‐induced inhibition. Interestingly, in this set of control MEFs, a rapid cycle of translation arrest, restoration, and again arrest can be observed during the 6 h of the experiment, matching the synthesis of GADD34.
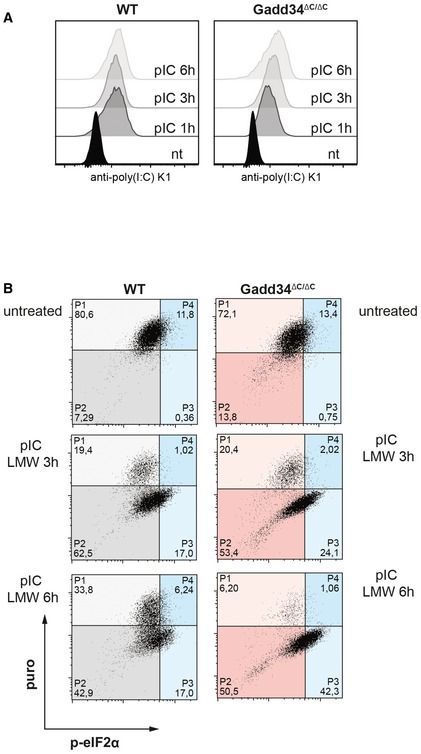
WT and GADD34ΔC/ΔC MEFs were treated with poly(I:C) for 1, 3, and 6 h before fixation and permeabilization. Poly(I:C) was detected with specific K1 mAb using intracellular flow cytometry.
Two‐dimensional plots of fluorescence intensity of individual WT (grey and blue) and GADD34ΔC/ΔC MEFs (red and blue) stained for puromycin (y‐axis) and p‐eIF2α (x‐axis). Percentage of cells in each quadrant is indicated. Cells expressing p‐eIF2α are shifted in the two right quadrants (P3 and P4, blue).
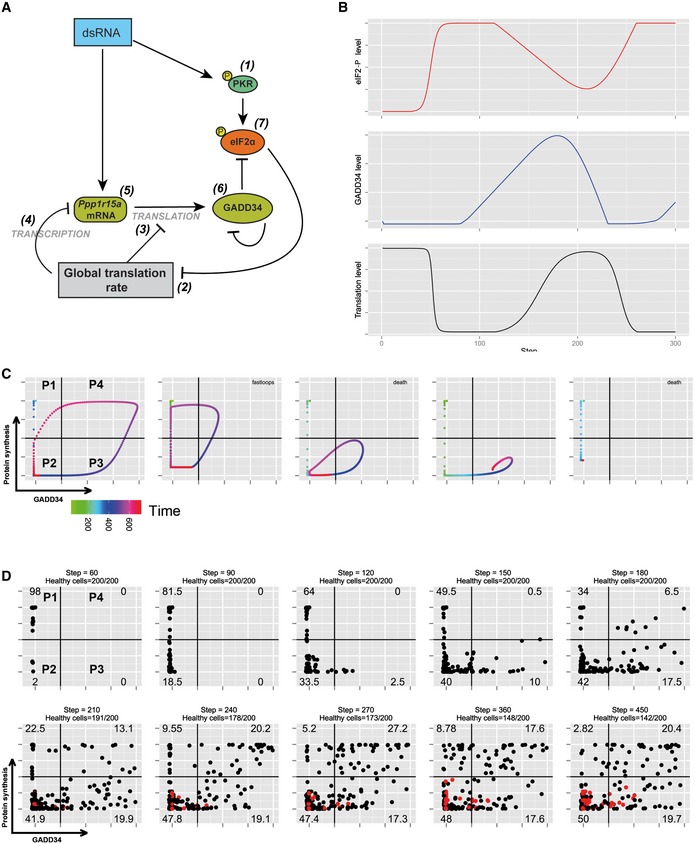
Schematic representation of the biochemical relationships and interdependences used to establish the mathematical model described in the Materials and Methods section.
Graphic representation over time of model‐based levels of p‐eIF2α (red), protein synthesis (black), and GADD34 activity (blue).
Representative single‐cell simulation showing the progression across quadrants (P1–P4) representing protein synthesis intensity and GADD34 levels over time (rainbow color gradient). Cells can undergo several cycles of protein synthesis inhibition and rescue (fastloops), while some cells are unable to rescue protein synthesis and are likely to die (death).
Grouped simulations of 200 cells over 450 time steps. By introducing 30% of variability in most parameters with fixed delays, virtual cell behavior mimics closely the experimental situation observed in Fig 5B. Dead cells are represented in red and subtracted from the indicated cell percentiles in each quadrant.
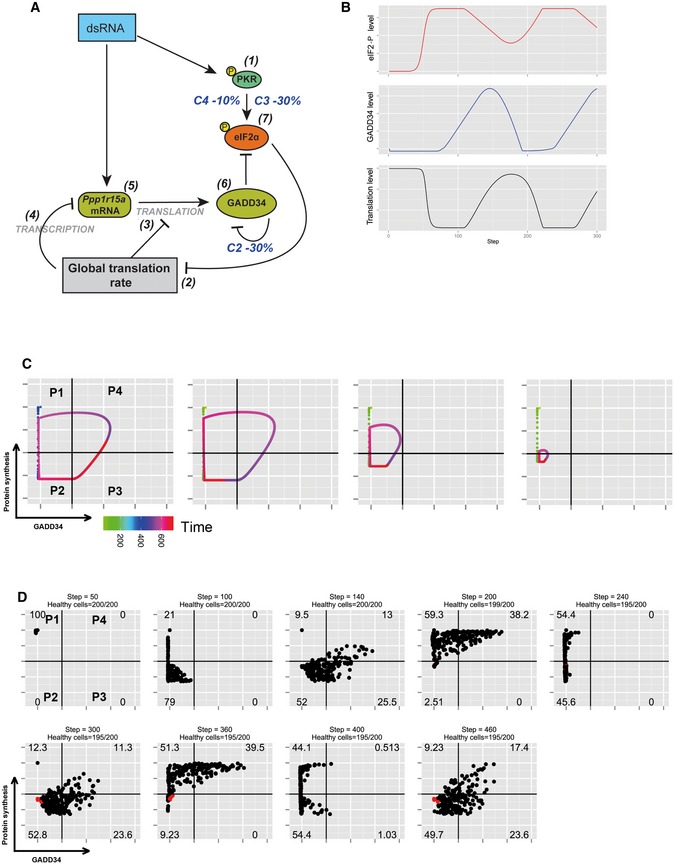
Schematic representation of the biochemical relationships and interdependences used to establish the mathematical model described in the Materials and Methods section. For this simulation, parameter C3 of equation (7) and parameter C2 of equation (6) were decreased by 30% and parameter C4 of equation (7) by 10%, while random variability was kept at 10%.
Graphic representation over time of model‐based levels of p‐eIF2α (red), protein synthesis (black), and GADD34 activity (blue), demonstrating the more rapid oscillatory nature of protein synthesis with these modified parameters.
Representative single‐cell simulation showing the progression across quadrants (P1–P4) representing protein synthesis intensity and GADD34 levels over time (rainbow color gradient). Cells undergo more rapid and compact cycles of protein synthesis inhibition and rescue.
Grouped simulations of 200 cells over 450 time steps. By introducing 10% of variability in most parameters with fixed delays, virtual cell behavior mimics closely the experimental situation observed in Fig 5D. Few dead cells are represented in red and subtracted from the indicated cell percentiles in each quadrant.
References
-
- Argüello RJ, Rodriguez Rodrigues C, Gatti E, Pierre P (2015) Protein synthesis regulation, a pillar of strength for innate immunity? Curr Opin Immunol 32: 28–35 - PubMed
-
- Balachandran S, Roberts PC, Brown LE, Truong H, Pattnaik AK, Archer DR, Barber GN (2000) Essential role for the dsRNA‐dependent protein kinase PKR in innate immunity to viral infection. Immunity 13: 129–141 - PubMed
-
- Balachandran S, Thomas E, Barber GN (2004) A FADD‐dependent innate immune mechanism in mammalian cells. Nature 432: 401–405 - PubMed
-
- Belgnaoui SM, Paz S, Hiscott J (2011) Orchestrating the interferon antiviral response through the mitochondrial antiviral signaling (MAVS) adapter. Curr Opin Immunol 23: 564–572 - PubMed
Publication types
MeSH terms
Substances
LinkOut - more resources
Full Text Sources
Other Literature Sources
Molecular Biology Databases
Miscellaneous
