. 2017 Jan 18;37(3):523-536.
doi: 10.1523/JNEUROSCI.1075-16.2016.

Methyl-CpG-Binding Protein MBD1 Regulates Neuronal Lineage Commitment through Maintaining Adult Neural Stem Cell Identity

Affiliations

Methyl-CpG-Binding Protein MBD1 Regulates Neuronal Lineage Commitment through Maintaining Adult Neural Stem Cell Identity

Emily M Jobe et al. J Neurosci. .

Abstract

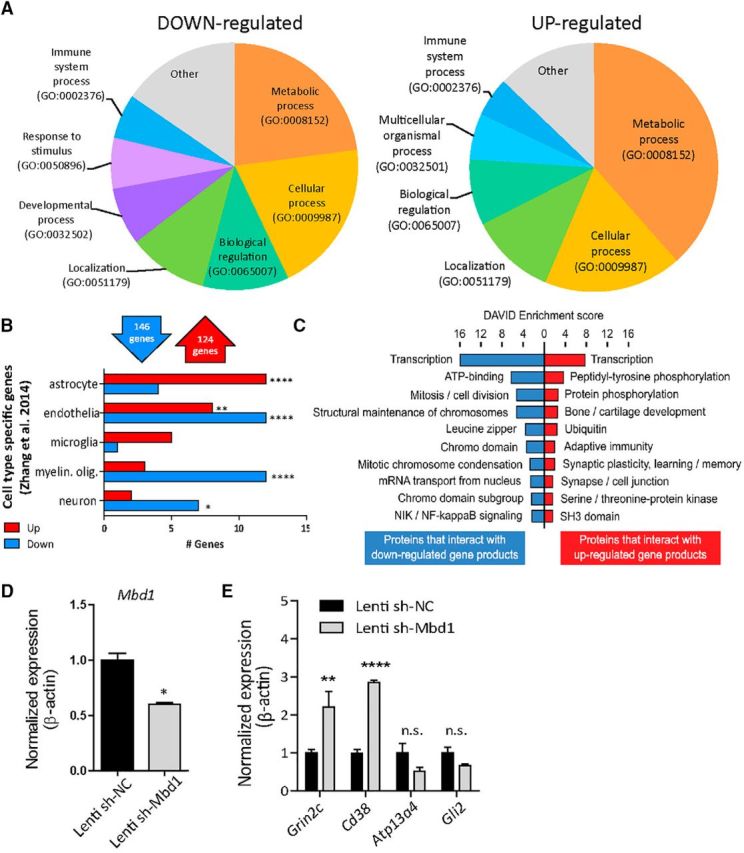
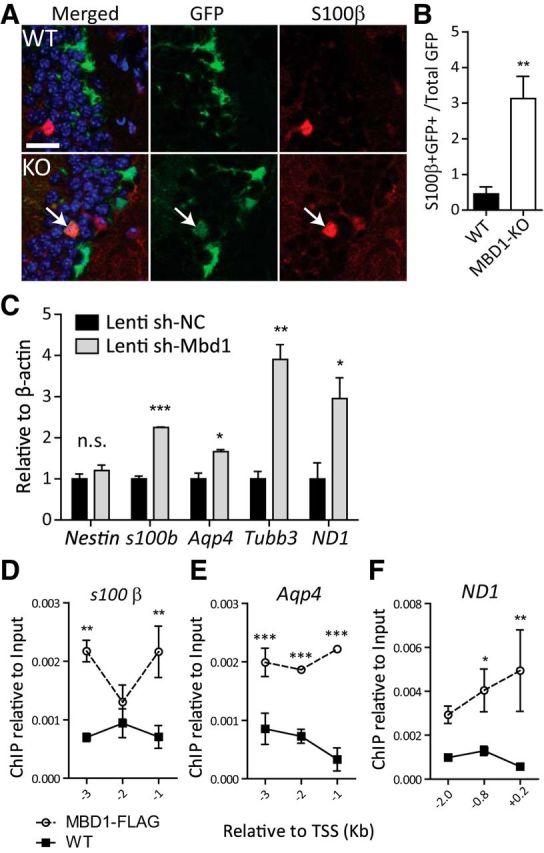
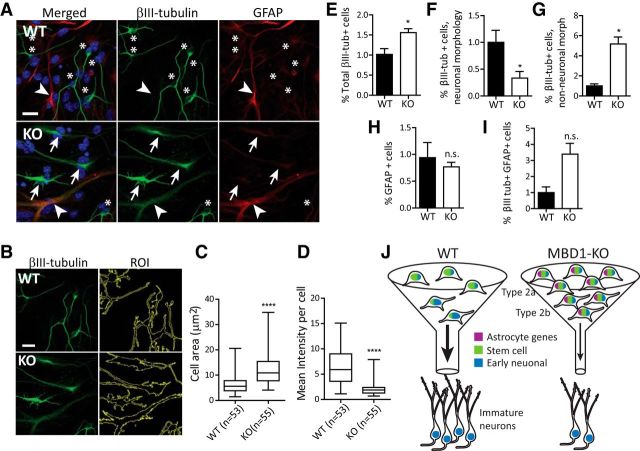
Methyl-CpG-binding domain 1 (MBD1) belongs to a family of methyl-CpG-binding proteins that are epigenetic "readers" linking DNA methylation to transcriptional regulation. MBD1 is expressed in neural stem cells residing in the dentate gyrus of the adult hippocampus (aNSCs) and MBD1 deficiency leads to reduced neuronal differentiation, impaired neurogenesis, learning deficits, and autism-like behaviors in mice; however, the precise function of MBD1 in aNSCs remains unexplored. Here, we show that MBD1 is important for maintaining the integrity and stemness of NSCs, which is critical for their ability to generate neurons. MBD1 deficiency leads to the accumulation of undifferentiated NSCs and impaired transition into the neuronal lineage. Transcriptome analysis of neural stem and progenitor cells isolated directly from the dentate gyrus of MBD1 mutant (KO) and WT mice showed that gene sets related to cell differentiation, particularly astrocyte lineage genes, were upregulated in KO cells. We further demonstrated that, in NSCs, MBD1 binds and represses directly specific genes associated with differentiation. Our results suggest that MBD1 maintains the multipotency of NSCs by restraining the onset of differentiation genes and that untimely expression of these genes in MBD1-deficient stem cells may interfere with normal cell lineage commitment and cause the accumulation of undifferentiated cells. Our data reveal a novel role for MBD1 in stem cell maintenance and provide insight into how epigenetic regulation contributes to adult neurogenesis and the potential impact of its dysregulation.

Significance statement: Adult neural stem cells (aNSCs) in the hippocampus self-renew and generate neurons throughout life. We show that methyl-CpG-binding domain 1 (MBD1), a DNA methylation "reader," is important for maintaining the integrity of NSCs, which is critical for their neurogenic potency. Our data reveal a novel role for MBD1 in stem cell maintenance and provide insight into how epigenetic regulation preserves the multipotency of stem cells for subsequent differentiation.

Keywords: FACS-seq; MBD1; epigenetics; lineage restriction; neural stem cells; neurogenesis.


Figures

Figure 1.
Figure 1.
MBD1 is expressed in NSCs, immediate progenitors, and neurons, but is undetectable in immature neurons in the adult DG. A, Mouse lines used in the experiments. For the MBD1-KO allele, the lacZ gene was knocked in to replace the first nine coding exons; therefore, the expression of β-gal represents the expression patterns of endogenous MBD1. Enhanced GFP is driven by the endogenous Nestin promoter in transgenic Nes-GFP mice. B, β-gal (red) and Nes-GFP (green) expression in MBD1-KO and WT animals. Scale bar, 20 μm. C, NESTIN staining (red) and Nes-GFP expression (green). Scale bar, 20 μm. D, Expression of β-gal (red) in MBD1-het;Nes-GFP mice. MBD1 colocalizes with Nes-GFP+ stem cells (green, arrows), but not with GFAP+ astrocytes in the hilus (white, arrowhead). Scale bar, 25 μm. For all images, the SGZ boundary is marked by the dashed line, DAPI (blue). E, Proportion of Nes-GFP+ cells that are β-gal+. F, β-gal (red) colocalizes with SOX2+ (white) stem cells (arrows) and with some SOX2+ S100β astrocyte progenitors (arrowhead), but not with S100β (green) astrocytes in the (arrowhead outline). G, Proportion of SOX2+ cells that are β-gal+ S100β−, β-gal+ S100β− or β-gal+ S100β+. H, β-gal (red) does not colocalize with TBR2+ neural progenitors (green, arrows) or with DCX+ immature neurons (white, arrowheads). I, Proportion of DCX+ cells that are β-gal+. J, Proportion of TBR2+ cells that are β-gal+. K, β-gal (red) colocalizes with some TBR1+ maturing neurons (green, arrows), but does not colocalize with the majority (18%) of DCX+ immature neurons (white, arrowheads). L, Proportion of TBR1+ cells that are β-gal+. M, β-gal (red) colocalizes with many NeuN+ maturing neurons (green, arrowheads). N, Proportion of NeuN++ cells that are β-gal+. O, Depiction of MBD1 expression (black bar) during the stages of adult neurogenesis. MBD1 is expressed in NESTIN+SOX2+Type 1/Type 2a stem and progenitor cells and maturing TBR1+NEUN+ neurons, but undetectable in GFAP+S100β+SOX2+astrocytes or TBR2+DCX+ Type 2b/Type 3 neuronal progenitors and immature neurons.
Figure 2.
Figure 2.
MBD1-KO mice have more immature cells in the adult DG. A, Sample confocal images of the DG in WT and MBD1-KO animals, Scale bar, 10 μm. Type 1 cells (arrows) are positive for both Nes-GFP (green) and GFAP (white, in the radial process). Type 2(a/b) cells (arrowheads) are Nes-GFP positive and also frequently MCM2 (red) positive (asterisks). B, Proportion of MCM2+ Type 1 and Type 2(a/b) cells is not significantly different between genotypes. C, Number of Type 2(a/b) cells per cubic millimeter is significantly greater in MBD1-KO compared with WT mice, but the number of Type 1 cells is not significantly different. Data are presented as mean ± SEM (n = 7/genotype) 2-way ANOVA, post hoc Bonferroni t test, ****p < 0.001.
Figure 3.
Figure 3.
MBD1-KO NSCs are impaired in transition to neuronal fate. A, Sample confocal images of Nes-GFP (green), DCX (red), and DAPI (blue) staining of brain sections from WT;Nes-GFP and MBD1-KO Nes-GFP mice. Scale bar, 20 μm B, Summary of quantification of Nes-GFP+ (Type 1 and Type 2a), Nes-GFP+DCX+ (Type 2b), and DCX+ (Type 3/immature neurons) in WT and KO mice. CE, Quantification of individual cell types in the adult DG of WT and KO mice: C, GFP+DCX− cells, D, GFP+DCX+ and E, GFP−DCX+ (n = 7 per genotype), 2-way ANOVA, post hoc Bonferroni t test *p < 0.05, **p < 0.01. F, Schematic illustrations of retroviral expressing shMbd1 as well as GFP (Retro-shMbd1) injected into the adult DG. A timeline of the in vivo labeling of newborn neurons in the DG experiment and illustrations of vertical and parallel neurons is shown. G, Confocal images showing examples of retroviral-labeled (GFP+) and DCX+ (white) vertical and parallel neurons. Scale bar, 20 μm. H, I, Quantitative analysis showing that Retro-shMbd1-infection resulted in reduced differentiation into vertical neurons (H), but not parallel neurons (I). J, Sample confocal images of BrdU+ (red) cells in the SGZ identified with cell-type-specific markers: Nes-GFP+ (green) Type 2a cells (arrowhead, top), DCX and Nes-GFP double-positive Type 2b cells (asterisks, middle), DCX+ (white) Type 3 cells (arrows, bottom). Scale bar, 10 μm. K, Quantitative data showing the percentage of each cell type among total BrdU+ cells. After 24 h, MBD1-KO mice had significantly more BrdU+ cells that were Nes-GFP+ and significantly fewer were DCX+ compared with WT mice. L, Hypothetical model based on these results showing reduced transition of BrdU-labeled cells to Type 3 (DCX+) in MBD1-KO mice at 24 h after BrdU labeling. Data are presented as mean ± SEM, WT (n = 7), KO (n = 6), 2-way ANOVA, post hoc Bonferroni's t test, *p < 0.05, **p < 0.01.
Figure 4.
Figure 4.
The DG of adult MBD1-KO mice yielded more Nes-GFP+ cells compared with WT mice. A, Experimental workflow of FACS-seq showing dissection of adult DG, direct cell isolation using FACS, RNA-seq, and bioinformatics analysis. B, Example of sorting gates used to separate for GFP+ and GFP− single cells dissociated from DG tissue. For each sorting, gates were drawn based on the profile of a WT mouse that did not express GFP (right). C, Relative enrichment of each gene was determined by qPCR, with equal numbers of sorted cells used to generate cDNA. Cells from the GFP+ gate (green) relative to the total cell gate (black) shows a pronounced enrichment of stem cell markers (eGFP, Nestin, and Gfap), mild enrichment of early neuronal markers (Dcx and NeuroD1), and depletion of mature neuronal marker (NeuN) in the GFP+ cell population (n = 1 with triplicates of qPCR). D, Proportion of GFP+ cells among total (input) cells is significantly greater in MBD1-KO compared with WT samples as assessed by cell counts. Cells were isolated from littermate pairs (n = 10 pairs); data are presented as mean ± SEM, paired t test, p = 0.003. E, Principal component analysis comparing Nes-GFP sorted cells (dark blue) with single Nes-GFP cell (green; Shin et al., 2015) or single Dcx-DsRed cell (light blue; Gao et al., 2016).
Figure 5.
Figure 5.
Nes-GFP+ cells isolated from MBD1-KO mice have elevated astrocyte lineage genes. A, Overrepresentation analysis of upregulated and downregulated genes in MBD1-KO cells compared with cell-type-specific genes (Zhang et al., 2014). B, Differential expression analysis of RNA-seq data using pairwise comparison identified 124 upregulated genes and 151 downregulated genes in MBD1-KO-sorted cells. PANTHER was used to categorize up and down differentially expressed genes in MBD1-KO GFP+ NSCs using a gene ontology (GO) biological process. C, DAVID enrichment analysis of proteins known to interact physically with protein products of upregulated and downregulated genes. D, Mbd1 mRNA expression was reduced in lenti-shMbd1-infected WT dgNPCs compared with lenti-shNC-infected WT dgNPCs, when analyzed at 48 h after initial viral infection. E, Expression levels of selected transcripts identified by RNA-seq were assessed in dgNPCs with acute KD of Mbd1 (lentivirus expressing shMbd1) using qPCR. The levels of Grin2C and Cd38 are significantly upregulated in MBD1 acute KD compared with control (lentivirus expressing control sh-NC), n = 3 per condition, t test, Bonferroni correction for multiple comparisons, *p < 0.05, **p < 0.01.
Figure 6.
Figure 6.
MBD1 represses the expression of lineage differentiation genes in neural stem and progenitor cells derived from adult DG (dgNPCs). A, Sample confocal images of Nes-GFP (green) and S100β (red) staining in WT and MBD1-KO animals. Arrow indicates colocalization. Scale bar, 20 μm. B, Quantification of S100β+ cells among Nes-GFP+ cells, n = 5 per genotype, 2-tailed unpaired t test, p = 0.0034. C, Quantitative analysis of stem cell- and lineage-specific genes using qPCR in proliferating NSCs with acute KD of MBD1 (sh-Mbd1) compared with control (sh-NC), n = 3, 2-tailed unpaired t test, *p < 0.05, **p < 0.01. DF, ChIP with anti-FLAG antibody in proliferating WT and FLAG-tagged MBD1 dgNPCs followed by qPCR for the genomic sequence of the s100β promoter (D), the Aqp4 promoter (E), and the NeuroD1 promoter (F). Data are presented as mean ± SEM, calculated relative to input sample. The x-axis depicts location of primers relative to the transcriptional start site (TTS) in kilobases (Kb), n = 4, two-way ANOVA, Bonferroni post hoc t test, **p < 0.01.
Figure 7.
Figure 7.
MBD1 deficiency leads to aberrant differentiation of dgNPCs. A, Sample images of in vitro differentiated WT and MBD1-KO dgNPCs. Scale bar, 50 μm. In WT, βIII-tubulin/Tuj1 (green) marked neurons with small nuclei and narrow and well defined processes (asterisks) and GFAP (red) marks astrocytes with broad processes and a large nucleus (arrowhead). In MBD1-KO, βIII-tubulin staining was abnormal, characterized by cells with wide βIII-tubulin+ processes (arrows) and coexpression of GFAP (red; arrowhead). B, Analysis of βIII-tubulin+ cell shape using FIJI. Cell contours were selected with the ROI tool using standardized thresholds (right). Note: same image shown as in A. C, Box plot of average cell area in WT (n = 53) and MBD1-KO (n = 55) βIII-tubulin+ cells. D, Box plot of mean intensity per cell, t test, ****p < 0.0001. EI, Cell quantification. Cell number was determined relative to DAPI+ cells/coverslip. For each cell type, results were normalized to the average of the WT samples, n = 3 pairs, paired t test. E, Total βIII-tubulin+ cells, p = 0.035. F, βIII-tubulin+ cells with neuronal morphology, p = 0.032. G, βIII-tubulin+ cells with non-neuronal morphology, p = 0.013. H, GFAP+ cells, p = 0.58 (n.s.). I, βIII-tubulin+ GFAP+ cells, p = 0.091 (n.s.). J, Proposed model depicting a function of MBD1 in adult neural stem cells and neurogenesis. Loss of MBD1-mediated repression increases expression of astrocyte genes (purple), which impedes the progression of neurogenesis, restricting the “passage (funnel) of differentiation” and causing cells to accumulate at earlier stages despite the upregulation of some early neuronal genes (blue).

Similar articles

Cited by

References

    1. Allan AM, Liang X, Luo Y, Pak C, Li X, Szulwach KE, Chen D, Jin P, Zhao X. The loss of methyl-CpG binding protein 1 leads to autism-like behavioral deficits. Hum Mol Genet. 2008;17:2047–2057. doi: 10.1093/hmg/ddn102. - DOI - PMC - PubMed
    1. Amador-Arjona A, Cimadamore F, Huang CT, Wright R, Lewis S, Gage FH, Terskikh AV. SOX2 primes the epigenetic landscape in neural precursors enabling proper gene activation during hippocampal neurogenesis. Proc Natl Acad Sci U S A. 2015;112:E1936–E1945. doi: 10.1073/pnas.1421480112. - DOI - PMC - PubMed
    1. Avgustinova A, Benitah SA. Epigenetic control of adult stem cell function. Nat Rev Mol Biol. 2016;17:643–658. doi: 10.1038/nrm.2016.76. - DOI - PubMed
    1. Barkho BZ, Munoz AE, Li X, Li L, Cunningham LA, Zhao X. Endogenous matrix metalloproteinase (MMP)-3 and MMP-9 promote the differentiation and migration of adult neural progenitor cells in response to chemokines. Stem Cells. 2008;26:3139–3149. doi: 10.1634/stemcells.2008-0519. - DOI - PMC - PubMed
    1. Beckervordersandforth R, Tripathi P, Ninkovic J, Bayam E, Lepier A, Stempfhuber B, Kirchhoff F, Hirrlinger J, Haslinger A, Lie DC, Beckers J, Yoder B, Irmler M, Götz M. In vivo fate mapping and expression analysis reveals molecular hallmarks of prospectively isolated adult neural stem cells. Cell Stem Cell. 2010;7:744–758. doi: 10.1016/j.stem.2010.11.017. - DOI - PubMed

Publication types

LinkOut - more resources