. 2017 Jan 18;37(3):610-625.
doi: 10.1523/JNEUROSCI.2804-16.2016.

Three Small-Receptive-Field Ganglion Cells in the Mouse Retina Are Distinctly Tuned to Size, Speed, and Object Motion

Affiliations

Three Small-Receptive-Field Ganglion Cells in the Mouse Retina Are Distinctly Tuned to Size, Speed, and Object Motion

Jason Jacoby et al. J Neurosci. .

Abstract

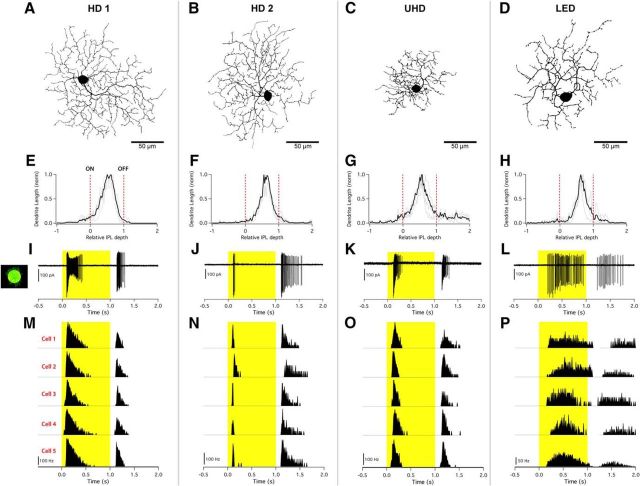
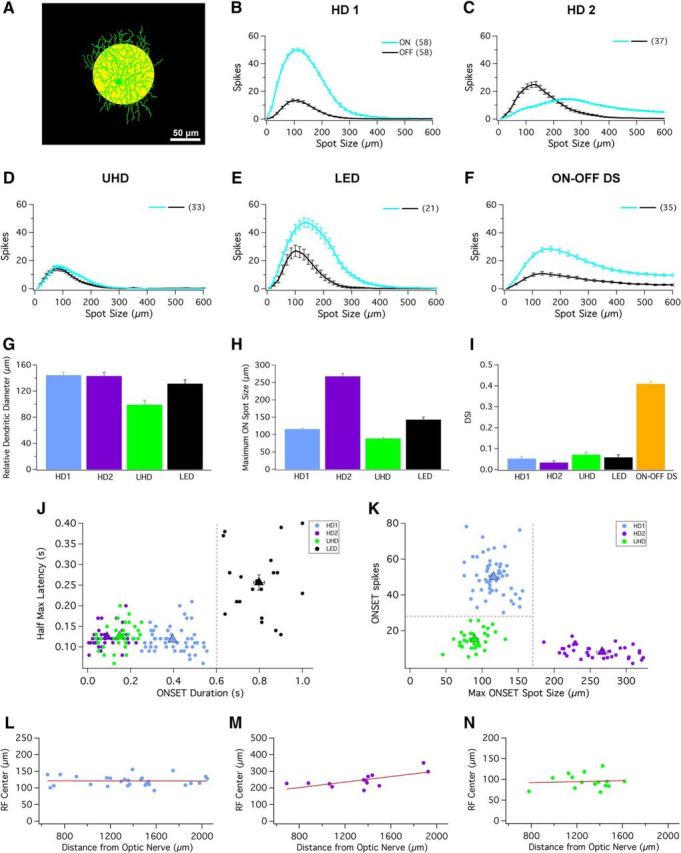
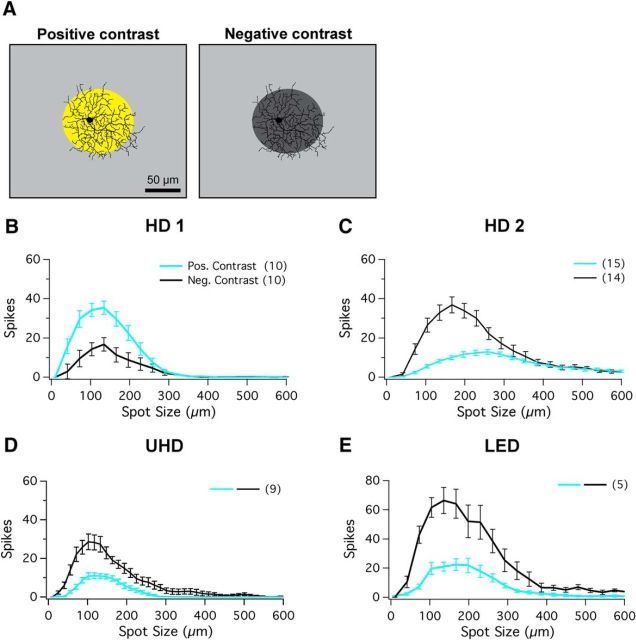
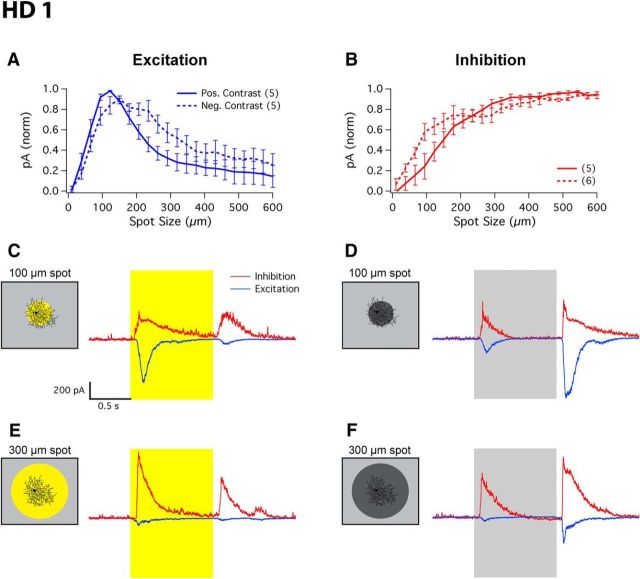
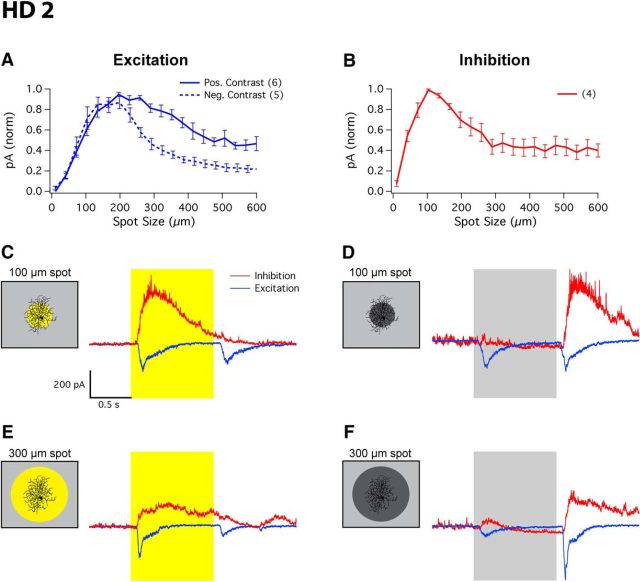
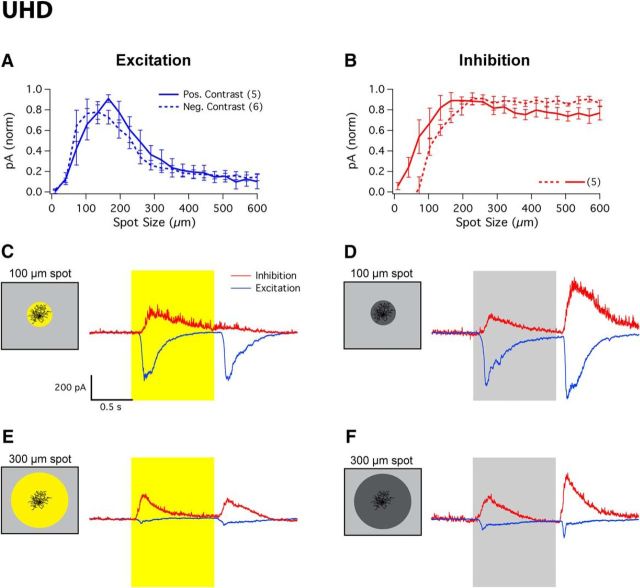
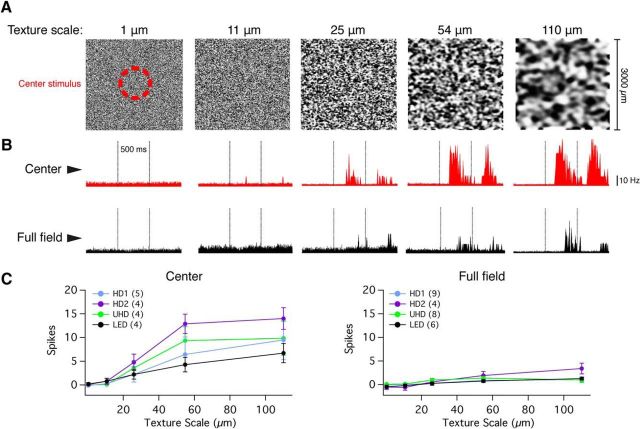
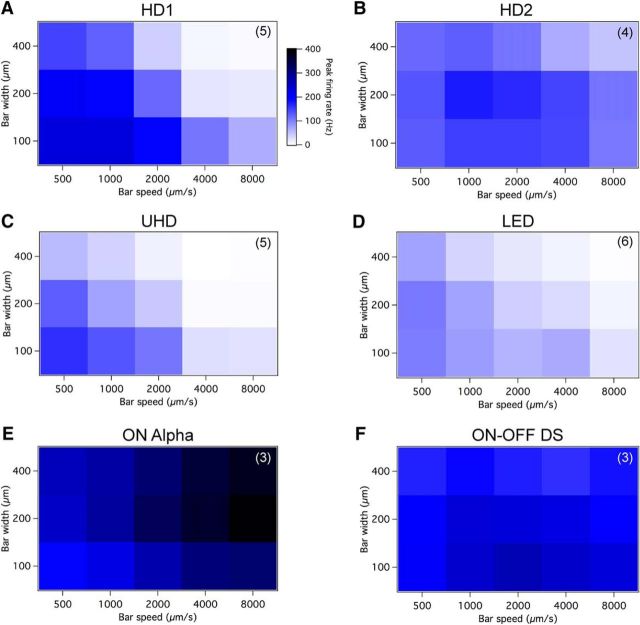
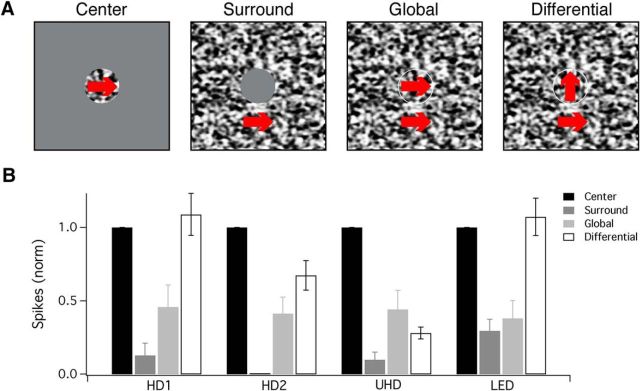
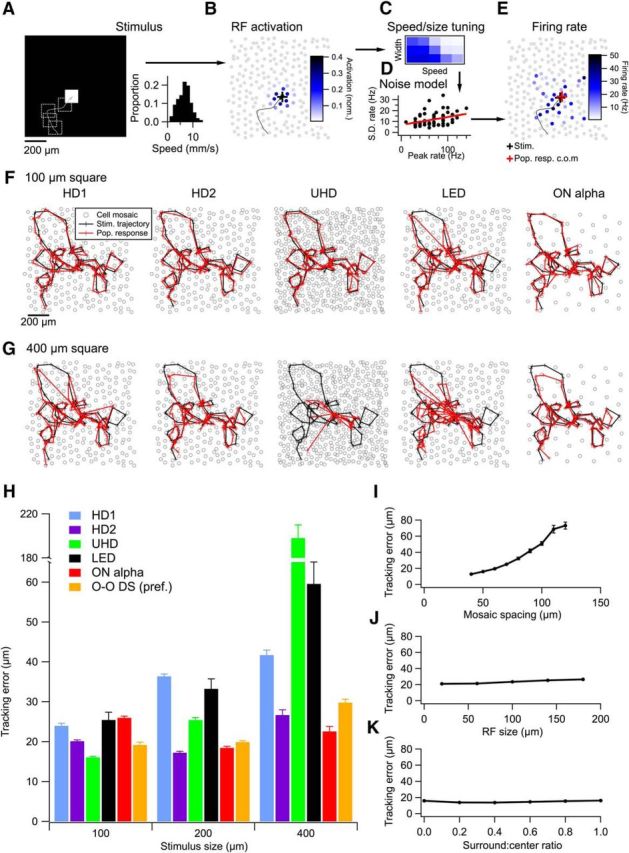
Retinal ganglion cells (RGCs) are frequently divided into functional types by their ability to extract and relay specific features from a visual scene, such as the capacity to discern local or global motion, direction of motion, stimulus orientation, contrast or uniformity, or the presence of large or small objects. Here we introduce three previously uncharacterized, nondirection-selective ON-OFF RGC types that represent a distinct set of feature detectors in the mouse retina. The three high-definition (HD) RGCs possess small receptive-field centers and strong surround suppression. They respond selectively to objects of specific sizes, speeds, and types of motion. We present comprehensive morphological characterization of the HD RGCs and physiological recordings of their light responses, receptive-field size and structure, and synaptic mechanisms of surround suppression. We also explore the similarities and differences between the HD RGCs and a well characterized RGC with a comparably small receptive field, the local edge detector, in response to moving objects and textures. We model populations of each RGC type to study how they differ in their performance tracking a moving object. These results, besides introducing three new RGC types that together constitute a substantial fraction of mouse RGCs, provide insights into the role of different circuits in shaping RGC receptive fields and establish a foundation for continued study of the mechanisms of surround suppression and the neural basis of motion detection.

Significance statement: The output cells of the retina, retinal ganglion cells (RGCs), are a diverse group of ∼40 distinct neuron types that are often assigned "feature detection" profiles based on the specific aspects of the visual scene to which they respond. Here we describe, for the first time, morphological and physiological characterization of three new RGC types in the mouse retina, substantially augmenting our understanding of feature selectivity. Experiments and modeling show that while these three "high-definition" RGCs share certain receptive-field properties, they also have distinct tuning to the size, speed, and type of motion on the retina, enabling them to occupy different niches in stimulus space.

Keywords: feature selectivity; object motion; retina; retinal ganglion cell.


Figures

Figure 1.
Figure 1.
Three novel RGCs and the LED RGC recorded from the mouse retina. Columns represent individual cell types: HD1, HD2, UHD, and LED RGCs. A–D, Fluorescent images (inverted) acquired using a confocal microscope to show the morphology and respective size of representative cells of each type. Scale bars, 50 μm. E–H, Dendritic stratification profiles depicting dendritic length (y-axis) versus IPL depth (x-axis) with dotted red lines marking the locations of ON (0) and OFF (1) ChAT bands. Gray lines show raw stratification profiles for a single cell; black line shows multicell average. I–L, Single-cell capacitive spike train from cell-attached recording evoked from 100 μm spot of light at 200 R*/rod/s (highlight) from darkness presented to RF center. M–P, Peristimulus time histogram of a light step from darkness derived from five different cells of the same type showing the consistency in light responses between cells.
Figure 2.
Figure 2.
HD cells possess small RF centers and strong surround suppression. A, Schematic depicting a 100 μm spot of light at 200 R*/rod/s (yellow spot) presented from darkness. Scale bar, 50 μm. B–F, Bright spots of multiple sizes (ranging from 10 to 600 μm) presented to RF center of (B) HD1, (C) HD2, (D) UHD, (E) LED, and (F) ON–OFF DS RGCs. ON (cyan) and OFF (black) responses elicited from bright spots from dark background. G, Bar graph depicting the relative dendritic diameter for HD1 (blue), HD2 (purple), UHD (green), and LED RGCs (black). H, Bar graph depicting the relative spot size that generates maximal response for HD1 (blue), HD2 (purple), UHD (green), and LED RGCs (black) during presentation of spots of multiple sizes from darkness. I, Bar graph of the average direction selectivity index (DSI) for HD1 (blue), HD2 (purple), UHD (green), LED (black), and ON–OFF DS RGCs (orange). Error bars are SEM across recorded cells. J, Scatter plot of response duration versus latency (100 μm spots; see Materials and Methods) for the ON responses of the three HD RGCs and the LED. A boundary of 0.6 s response duration (dashed gray line) separates LEDs from HD RGCs. K, Scatter plot of maximum onset response spot size versus number of spikes at that spot size for the three HD RGCs. Decision boundaries of 175 μm and 28 spikes (dashed gray lines) place each HD RGC type in its own quadrant. For both scatter plots, each dot represents the coordinates of a single recorded cell; triangles represent mean of each individual cell type with SEM. Scatter plots for (L) HD1, (M) HD2, and (N) UHD RGCs display the maximal ON spot size corresponding to the size of the RF center versus retinal eccentricity (distance from optic nerve head).
Figure 3.
Figure 3.
RF structure of HD RGCs in photopic conditions. A, Left, Schematic of positive-contrast stimuli for spots of multiple sizes of bright spots from background mean illumination (R* values provided in text). A, Right, Schematic of negative-contrast stimuli for spots of multiple sizes of dark spots (0 R*/rod/s; dark gray spot) from background mean illumination. Scale bar, 100 μm. B–E, Positive-contrast and negative-contrast spots of multiple sizes (ranging from 10 to 600 μm) presented to RF center for (B) HD1, (C) HD2, (D) UHD, and (E) LED RGCs. Positive-contrast responses (ON) are shown in cyan and negative-contrast responses (OFF) are shown in black.
Figure 4.
Figure 4.
Excitatory and inhibitory currents of HD1 RGCs. A, B, Whole-cell patch-clamp recordings from HD1 RGCs measured in voltage clamp to isolate excitatory (A) and inhibitory (B) currents. ON response (cyan) and OFF response (black) elicited from bright or dark spots of multiple sizes from background mean light level. C–F, Representative current traces for spots of positive or negative contrast of 100 and 300 μm. Schematics show the spot size and contrast level at which visual stimuli were presented for the corresponding representative traces.
Figure 5.
Figure 5.
Excitatory and inhibitory currents of HD2 RGCs. A, B, Whole-cell patch-clamp recordings from HD2 RGCs measured in voltage clamp to isolate excitatory (A) and inhibitory (B) currents. No inhibition was measured to negative-contrast stimuli. ON response (cyan) and OFF response (black) elicited from bright or dark spots of multiple sizes from background mean light level. C–F, Representative current traces for spots of positive or negative contrast of 100 and 300 μm. Schematics show the spot size and contrast level at which visual stimuli were presented for the corresponding representative traces.
Figure 6.
Figure 6.
Excitatory and inhibitory currents of UHD RGCs. A, B, Whole-cell patch-clamp recordings from UHD RGCs measured in voltage clamp to isolate excitatory (A) and inhibitory (B) currents. ON response (cyan) and OFF response (black) elicited from bright spots of multiple sizes from background mean light level. C–F, Representative current traces for spots of positive or negative contrast of 100 and 300 μm. Schematics show the spot size and contrast level at which visual stimuli were presented for the corresponding representative traces.
Figure 7.
Figure 7.
HD RGCs respond to flashed texture stimuli presented to the RF center, but are attenuated to full-field stimuli. A, Graphic representation of the full-field (3000 × 3000 μm) texture stimuli presented to the four cell types tested; each image depicts a different spatial scale (1, 11, 25, 54, and 110 μm). The hash-mark red circle represented the region of stimulus projection when the texture was only presented to the RF center. B, Peristimulus time histograms depicting the response to RF center (red traces, top) and full-field (black traces, bottom) textures in a representative HD1 RGC. Flashed textures were presented for a total of 500 ms; stimulus onset and offset are designated by vertical dotted lines. C, Baseline-subtracted spike responses of HD and LED RGCs to textures presented to the RF center (left) or full-field stimuli (right) at different texture scales.
Figure 8.
Figure 8.
HD RGCs respond to small moving objects with distinct speed and size tuning curves. A–F, Moving bars from darkness were modulated in width (y-axis) and speed (x-axis) to determine the characteristic tuning curves for (A) HD1, (B) HD2, (C) UHD, (D) LED, (E) ON α, and (F) ON–OFF DS RGCs. The color scale displayed adjacent to A is used for each cell type. N values (number of cells) displayed in upper right-hand corner of plots.
Figure 9.
Figure 9.
HD RGC responses to object motion. A, Schematic depicting the stimuli used to probe responsivity to drifting textures in the (from left to right) RF center, surround only, global, or differential motion between the center and surround portions. Red arrows, placed over the area in which the texture pattern was projected, depict the direction of the texture's drifting motion (200 μm/s). Flat gray areas depict that background light level where the texture stimulus was masked. B, Bar graph displaying the normalized number of spikes generating by HD1, HD2, UHD, and LED RGCs to drifting textures in the RF center (black), surround only (dark gray), global (light gray), or differential motion in the center and surround portions (white).
Figure 10.
Figure 10.
Model of population responses of HD and LED RGCs tracking moving objects. A, Left, Schematic of the stimulus showing a white square on a single frame along with its previous trajectory (dotted lines). Right, Velocity distribution for the random walk of the square. B, A simulated mosaic of RGCs colored by their degree of RF overlap with the stimulus frame in A. C, Speed and size tuning (as in Fig. 8) was applied to the activation pattern in B based on the recent speed of the object. D, Noise model for each RGC type. Peak firing rate is plotted against its SD and fit with a line. This model is used to apply noise to each model RGC. E, Firing rates for the mosaic in B after incorporating measured speed and size tuning and the noise model. F, A model stimulus trajectory (black) and the center of mass of the population response (red) for simulated mosaics of HD1, HD2, UHD, LED, and ON α RGCs for a 100 μm square. Crosses represent 10 ms time steps. G, Sample trajectories as in F for a 400 μm square. H, Mean tracking error for each RGC type for three different square sizes. ON–OFF DS RGCs (O–O DS) were measured only in their preferred direction (see text). I, Tracking error as a function of mosaic spacing for a simulation in which all other parameters matched the profile of a UHD RGC. J, Same as I, but varying RF size instead of mosaic spacing. K, Tracking error for a UHD population as a function of surround-to-center ratio. Error bars in H–K are SEM across 10 trajectories for each data point. In some cases, the error bars are smaller than the symbols.

Similar articles

Cited by

References

    1. Asari H, Meister M. Divergence of visual channels in the inner retina. Nat Neurosci. 2012;15:1581–1589. doi: 10.1038/nn.3241. - DOI - PMC - PubMed
    1. Awatramani GB, Slaughter MM. Origin of transient and sustained responses in ganglion cells of the retina. J Neurosci. 2000;20:7087–7095. - PMC - PubMed
    1. Baccus SA, Olveczky BP, Manu M, Meister M. A retinal circuit that computes object motion. J Neurosci. 2008;28:6807–6817. doi: 10.1523/jneurosci.4206-07.2008. - DOI - PMC - PubMed
    1. Baden T, Berens P, Franke K, Román Rosón M, Bethge M, Euler T. The functional diversity of retinal ganglion cells in the mouse. Nature. 2016;529:345–350. doi: 10.1038/nature16468. - DOI - PMC - PubMed
    1. Berry MJ, 2nd, Brivanlou IH, Jordan TA, Meister M. Anticipation of moving stimuli by the retina. Nature. 1999;398:334–338. doi: 10.1038/18678. - DOI - PubMed

Publication types

LinkOut - more resources