. 2017 Jan 18;37(3):660-672.
doi: 10.1523/JNEUROSCI.2913-16.2016.

Selective Deletion of Sodium Salt Taste during Development Leads to Expanded Terminal Fields of Gustatory Nerves in the Adult Mouse Nucleus of the Solitary Tract

Affiliations

Selective Deletion of Sodium Salt Taste during Development Leads to Expanded Terminal Fields of Gustatory Nerves in the Adult Mouse Nucleus of the Solitary Tract

Chengsan Sun et al. J Neurosci. .

Abstract

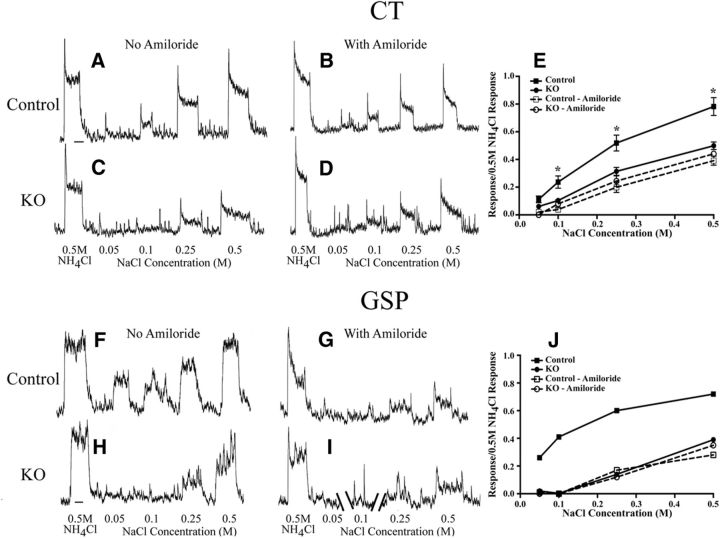
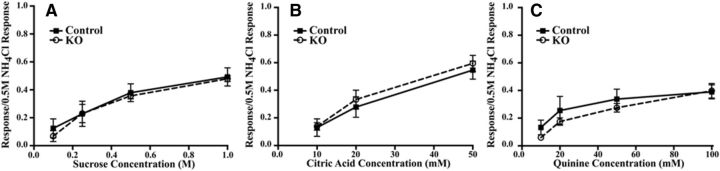
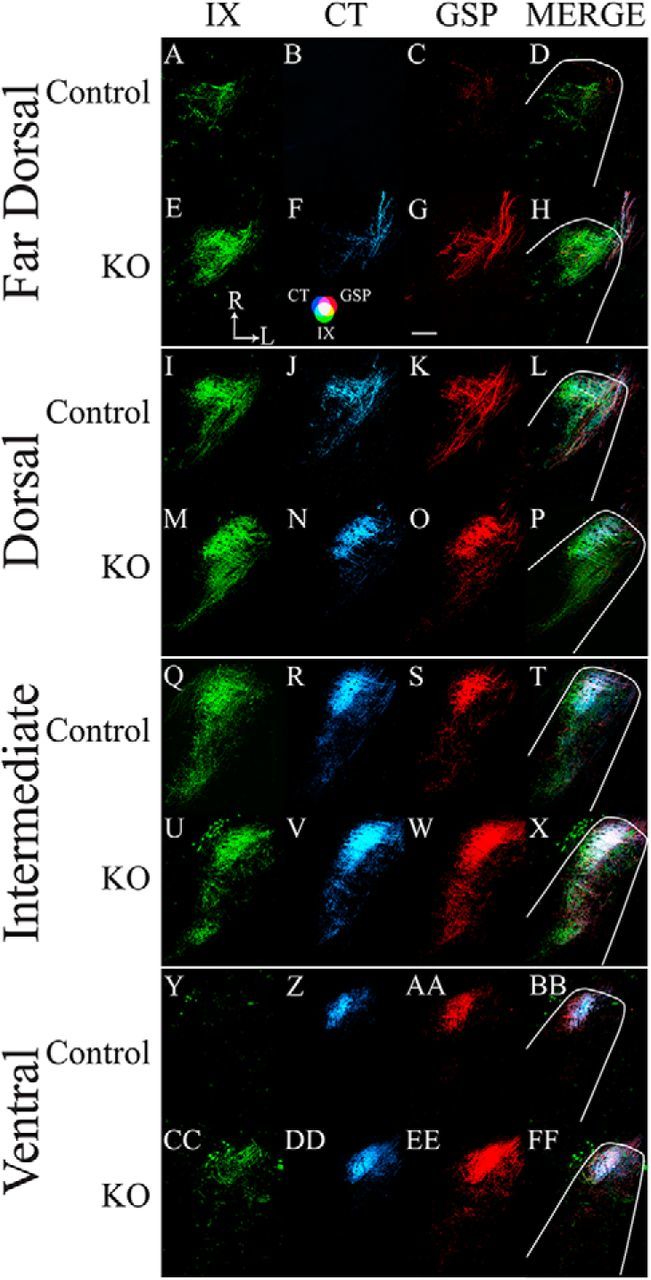
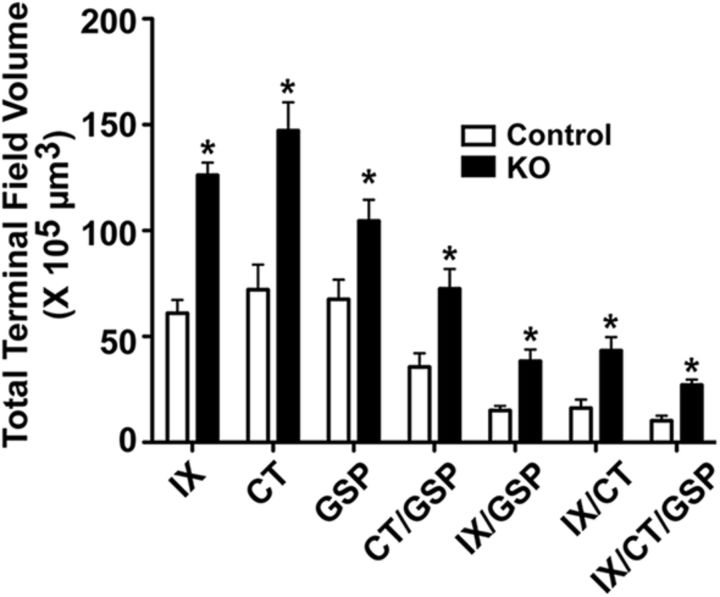
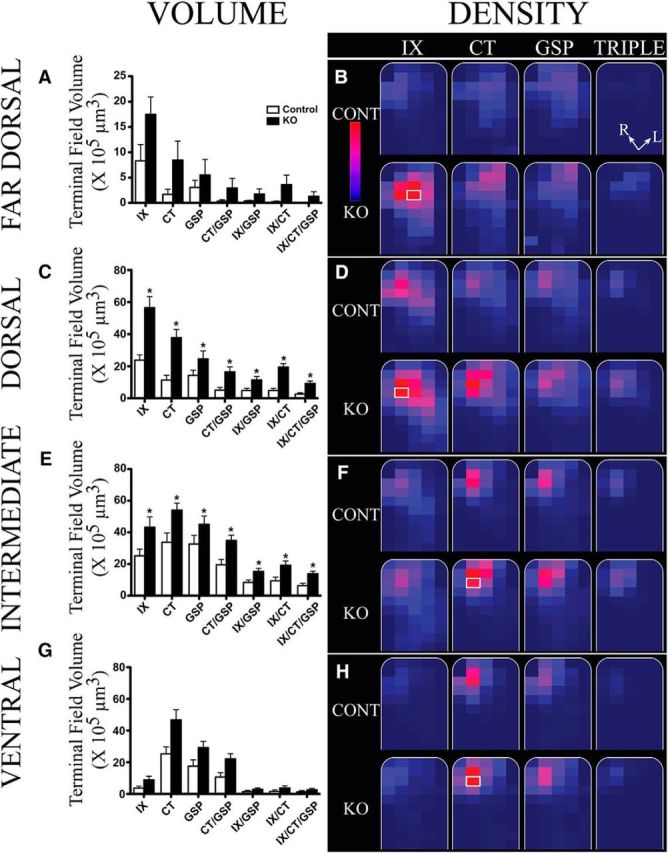
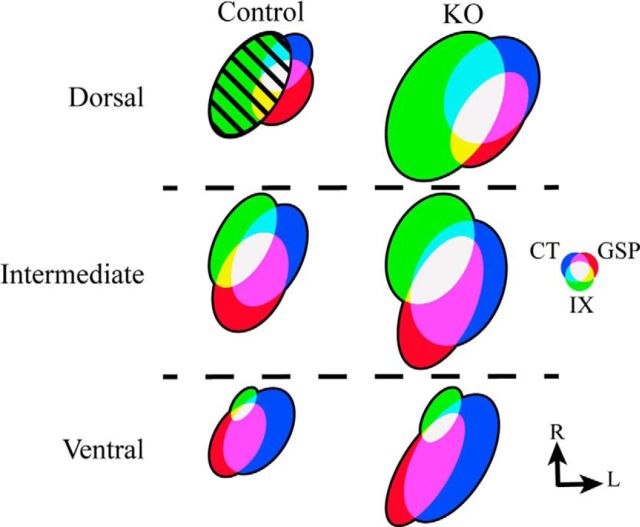
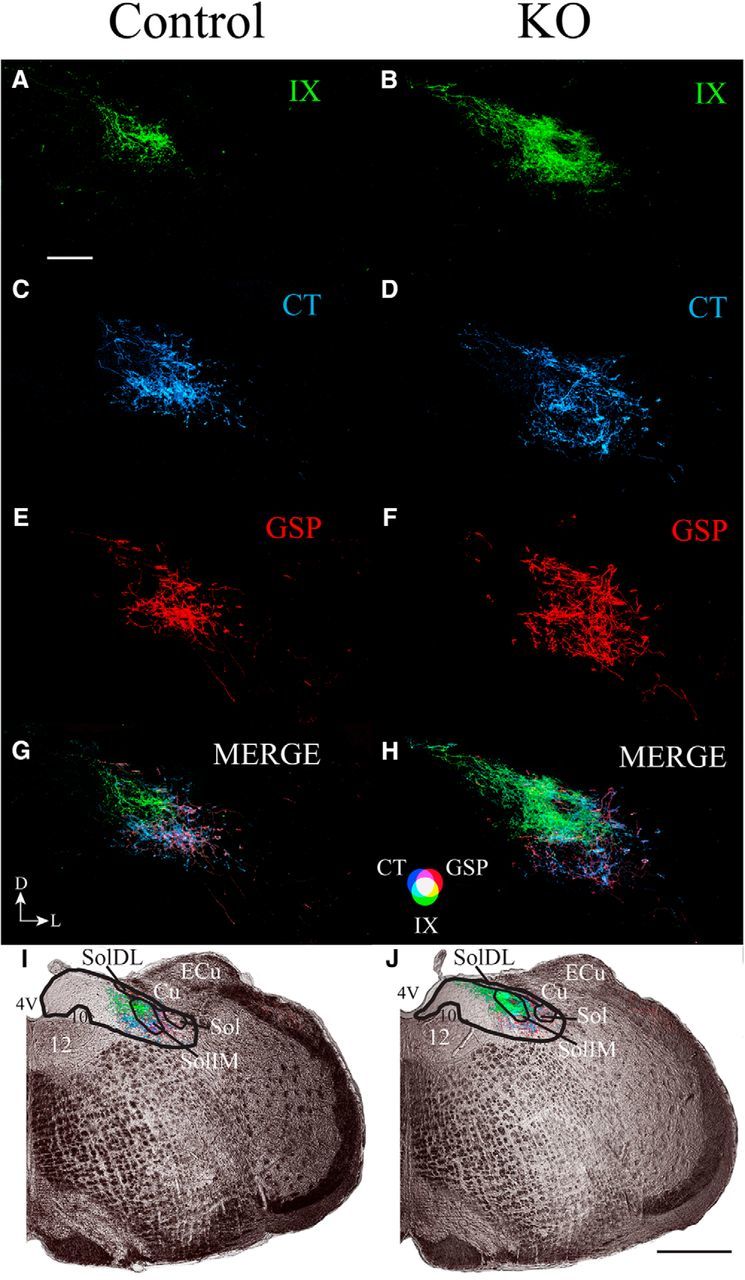
Neuronal activity plays a key role in the development of sensory circuits in the mammalian brain. In the gustatory system, experimental manipulations now exist, through genetic manipulations of specific taste transduction processes, to examine how specific taste qualities (i.e., basic tastes) impact the functional and structural development of gustatory circuits. Here, we used a mouse knock-out model in which the transduction component used to discriminate sodium salts from other taste stimuli was deleted in taste bud cells throughout development. We used this model to test the hypothesis that the lack of activity elicited by sodium salt taste impacts the terminal field organization of nerves that carry taste information from taste buds to the nucleus of the solitary tract (NST) in the medulla. The glossopharyngeal, chorda tympani, and greater superficial petrosal nerves were labeled to examine their terminal fields in adult control mice and in adult mice in which the α-subunit of the epithelial sodium channel was conditionally deleted in taste buds (αENaC knockout). The terminal fields of all three nerves in the NST were up to 2.7 times greater in αENaC knock-out mice compared with the respective field volumes in control mice. The shapes of the fields were similar between the two groups; however, the density and spread of labels were greater in αENaC knock-out mice. Overall, our results show that disruption of the afferent taste signal to sodium salts disrupts the normal age-dependent "pruning" of all terminal fields, which could lead to alterations in sensory coding and taste-related behaviors.

Significance statement: Neural activity plays a major role in the development of sensory circuits in the mammalian brain. To date, there has been no direct test of whether taste-elicited neural activity has a role in shaping central gustatory circuits. However, recently developed genetic tools now allow an assessment of how specific taste stimuli, in this case sodium salt taste, play a role in the maturation of the terminal fields in the mouse brainstem. We found that the specific deletion of sodium salt taste during development produced terminal fields in adults that were dramatically larger than in control mice, demonstrating for the first time that sodium salt taste-elicited activity is necessary for the normal maturation of gustatory inputs into the brain.

Keywords: ENaC; activity; axons; epithelial sodium channel; knock out; medulla.


Figures

Figure 1.
Figure 1.
A, B, Integrated taste responses from the CT nerve in a control (Control) mouse to a concentration series of NaCl and to 0.5 m NH4Cl before lingual application of the epithelial channel blocker amiloride (A) and with amiloride (B). C, D, Integrated taste responses from the CT in an αENaC knock-out (KO) mouse to a concentration series of NaCl and to 0.5 m NH4Cl before lingual application of amiloride (C) and with amiloride (D). E, Mean (±SEM) relative taste responses to a concentration series of NaCl from the CT in control and αENaC KO mice before (solid lines) and with lingual application of amiloride (dotted lines). F, G, Integrated taste responses from the GSP in a Control mouse to a concentration series of NaCl and to 0.5 m NH4Cl before lingual application of amiloride (F) and with amiloride (G). H, I, Integrated taste responses from the GSP nerve in an αENaC KO mouse to a concentration series of NaCl and to 0.5 m NH4Cl before lingual application of amiloride (H) and with amiloride (I). The record in I is broken to enable registration of responses with G. Only spontaneous activity was not shown in I. J, Relative taste responses to a concentration of NaCl from the GSP in the same control mouse in which F and G were recorded and in the same αENaC KO mouse in which H and I were recorded before (solid lines) and with lingual application of amiloride (dotted lines). *p < 0.05 in the group-related comparisons in E.
Figure 2.
Figure 2.
A–C, Mean (±SEM) relative taste responses to a concentration of sucrose (A), citric acid (B), and quinine (C) from the CT nerve in control (Control; solid lines) and αENaC knock-out (KO; dotted lines) mice.
Figure 3.
Figure 3.
A–FF, Horizontal sections of labeled terminal fields of the IX nerve (green; A, E, I, M, Q, U, Y, CC), CT nerve (blue; B, F, J, N, R, V, Z, DD), and GSP nerve (red; C, G, K, O, S, W, AA, EE), and for the merged images of all three nerves (MERGE; D, H, L, P, T, X, BB, FF) for control (Control; A–D, I–L, Q–T, Y–BB) and αENaC knock-out (KO; E–H, M–P, U–X, CC–FF) mice in the far dorsal (A–H), dorsal (I–P), and intermediate (Q–X) zones, and ventral (Y–FF) zones within the mouse NST. The approximate location of the NST is outlined in white, as shown in the merged images. The CT–GSP overlap is shown as magenta, the IX–GSP overlap is shown as yellow, the IX–CT overlap in shown as blue-green, and the CT–GSP–IX terminal field overlap is shown as white. Refer to the color guide in F. Scale bar, G, 200 μm. R, Rostral; L, lateral (shown in E).
Figure 4.
Figure 4.
Mean (±SEM) total terminal field volumes of the terminal field for the IX, CT, and GSP nerves and their double and triple overlap of terminal fields in control (Control, open bars) and αENaC knock-out (KO; solid bars) mice. *p < 0.05.
Figure 5.
Figure 5.
Mean (±SEM) terminal field volumes and densities in x-, y-, and z-planes in control (Control; open bars) and αENaC knock-out (KO; solid bars) mice. A, C, E, G, Mean (±SEM) terminal field volumes of the IX, CT, and GSP nerves and their overlapping fields for Controls (open bars) and αENaC KO (solid bars) mice in the far dorsal (A), dorsal (C), intermediate (E), and ventral (G) zones. Note the different y-axis in A. Asterisks shown for terminal field volumes denote KO means significantly greater than in Control mice (p < 0.05). B, D, F, H, Heat maps showing the terminal field densities (volume of terminal field label in a division/total volume of the division) for IX, CT, and GSP nerves, and for the triple overlap of all three nerve terminal fields (TRIPLE). The NST (borders shown in white) has been rotated so that the solitary tract is oriented vertically (see Materials and Methods; R, rostral; L, lateral orientations in B, TRIPLE overlap). The NST for each zone is divided into a maximum of 100 × 100 pixel divisions for each optical image (see Materials and Methods). The colors for the heat map of densities are on the relative scale shown in B, with 0% of maximum density noted as dark blue and 100% noted as red. This relative scale was applied to each of the four zones; therefore, the maximum density was obtained from all of the divisions from Control and αENaC knock-out mice for the far dorsal zone, and similarly for the dorsal, intermediate, and ventral zones. The division representing 100% (brightest red) in B, D, F, and H are shown by a white border around the respective 100 × 100 pixel division (e.g., contained in the IX nerve terminal field of αENaC knock-out mice in the far dorsal zone).
Figure 6.
Figure 6.
Schematic of the terminal field organization in the NST in control (Control; left column) mice and αENaC knock-out (KO; right column) mice for the dorsal, intermediate, and ventral zones. For comparisons, the total volume of terminal field of the far dorsal and dorsal zones were summed and are represented here as the “dorsal zone.” The size of the terminal fields was calculated relative to the terminal field volume for the IX nerve in the control mouse (hatched green oval in dorsal zone; area = 1.0). The color of individual nerves and of their overlaps are shown in the color wheel, and the orientation of the ovals are shown as they appear in horizontal sections. R, Rostral; L, lateral.
Figure 7.
Figure 7.
A–J, Coronal sections through the dorsal/caudal NST showing the IX nerve terminal field (green; A, B), CT nerve terminal field (blue; C, D), GSP nerve terminal field (red; E, F), and merged (G, H) terminal fields, and the terminal fields in the right hemifield of medulla captured with transmitted light (I, J) in control (Control; A, C, E, G, I) and αENaC knock-out (KO; B, D, F, H, J) mice. The orientation of the sections is shown in G. D, Dorsal; L, lateral. The color bar for the merged images in shown in H. Scale bars: A, 200 μm; J, 500 μm. The black lines shown in I and J demarcate the NST (thicker lines) and structures within the NST (thinner lines). 4V, Fourth ventricle; 12, hypoglossal nuclei; 10, dorsal motor nucleus of the vagus; Cu, cuneate nucleus; ECu, external cuneate nucleus; Sol, solitary tract; SolIM, solitary tract nucleus, intermediate; SolDL, solitary tract, dorsolateral. Black, straight lines in I and J point to the relevant structure in the NST.

Similar articles

Cited by

References

    1. Bartel DL, Finger TE. Reactive microglia after taste nerve injury: comparison to nerve injury models of chronic pain. F1000Res. 2013;2:65. doi: 10.12688/f1000research.2-65.v1. - DOI - PMC - PubMed
    1. Brembeck FH, Moffett J, Wang TC, Rustgi AK. The keratin 19 promoter is potent for cell-specific targeting of genes in transgenic mice. Gastroenterology. 2001;120:1720–1728. doi: 10.1053/gast.2001.24846. - DOI - PubMed
    1. Chandrashekar J, Kuhn C, Oka Y, Yarmolinsky DA, Hummler E, Ryba NJ, Zuker CS. The cells and peripheral representation of sodium taste in mice. Nature. 2010;464:297–301. doi: 10.1038/nature08783. - DOI - PMC - PubMed
    1. Chen C, Regehr WG. Developmental remodeling of the retinogeniculate synapse. Neuron. 2000;28:955–966. doi: 10.1016/S0896-6273(00)00166-5. - DOI - PubMed
    1. Corson SL, Hill DL. Chorda tympani nerve terminal field maturation and maintenance is severely altered following changes to gustatory nerve input to the nucleus of the solitary tract. J Neurosci. 2011;31:7591–7603. doi: 10.1523/JNEUROSCI.0151-11.2011. - DOI - PMC - PubMed

Publication types

MeSH terms

Substances

LinkOut - more resources