. 2017 Jan 18;37(3):726-737.
doi: 10.1523/JNEUROSCI.3270-16.2016.

Differential Vulnerability of CA1 versus CA3 Pyramidal Neurons After Ischemia: Possible Relationship to Sources of Zn2+ Accumulation and Its Entry into and Prolonged Effects on Mitochondria

Affiliations

Differential Vulnerability of CA1 versus CA3 Pyramidal Neurons After Ischemia: Possible Relationship to Sources of Zn2+ Accumulation and Its Entry into and Prolonged Effects on Mitochondria

Yuliya V Medvedeva et al. J Neurosci. .

Abstract

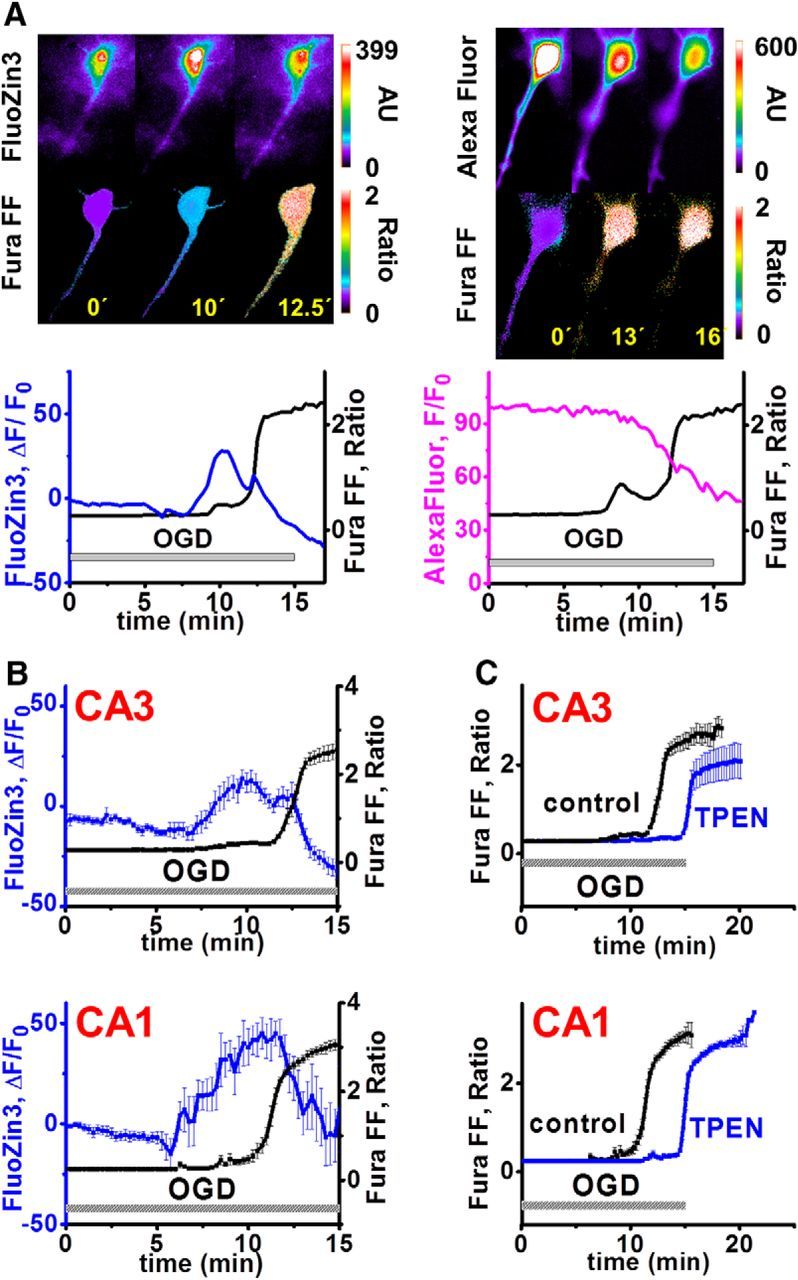
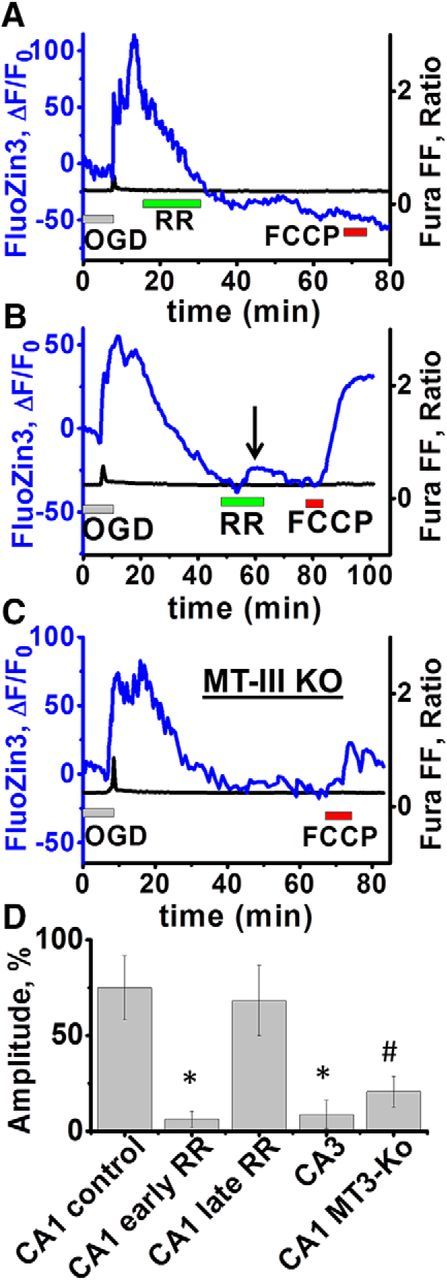
Excitotoxic mechanisms contribute to the degeneration of hippocampal pyramidal neurons after recurrent seizures and brain ischemia. However, susceptibility differs, with CA1 neurons degenerating preferentially after global ischemia and CA3 neurons after limbic seizures. Whereas most studies address contributions of excitotoxic Ca2+ entry, it is apparent that Zn2+ also contributes, reflecting accumulation in neurons either after synaptic release and entry through postsynaptic channels or upon mobilization from intracellular Zn2+-binding proteins such as metallothionein-III (MT-III). Using mouse hippocampal slices to study acute oxygen glucose deprivation (OGD)-triggered neurodegeneration, we found evidence for early contributions of excitotoxic Ca2+ and Zn2+ accumulation in both CA1 and CA3, as indicated by the ability of Zn2+ chelators or Ca2+ entry blockers to delay pyramidal neuronal death in both regions. However, using knock-out animals (of MT-III and vesicular Zn2+ transporter, ZnT3) and channel blockers revealed substantial differences in relevant Zn2+ sources, with critical contributions of presynaptic release and its permeation through Ca2+- (and Zn2+)-permeable AMPA channels in CA3 and Zn2+ mobilization from MT-III predominating in CA1. To assess the consequences of the intracellular Zn2+ accumulation, we used OGD exposures slightly shorter than those causing acute neuronal death; under these conditions, cytosolic Zn2+ rises persisted for 10-30 min after OGD, followed by recovery over ∼40-60 min. Furthermore, the recovery appeared to be accompanied by mitochondrial Zn2+ accumulation (via the mitochondrial Ca2+ uniporter MCU) in CA1 but not in CA3 neurons and was markedly diminished in MT-III knock-outs, suggesting that it depended upon Zn2+ mobilization from this protein.

Significance statement: The basis for the differential vulnerabilities of CA1 versus CA3 pyramidal neurons is unclear. The present study of events during and after acute oxygen glucose deprivation highlights a possible important difference, with rapid synaptic entry of Ca2+ and Zn2+ contributing more in CA3, but with delayed and long-lasting accumulation of Zn2+ within mitochondria occurring in CA1 but not CA3 pyramidal neurons. These data may be consistent with observations of prominent mitochondrial dysfunction as a critical early event in the delayed degeneration of CA1 neurons after ischemia and support a hypothesis that mitochondrial Zn2+ accumulation in the early reperfusion period may be a critical and targetable upstream event in the injury cascade.

Keywords: CA1 pyramidal neurons; delayed degeneration; hippocampal slice; in vitro ischemia model; mitochondria; oxygen glucose deprivation.


Figures

Figure 1.
Figure 1.
OGD-evoked Zn2+ rises precede and contribute to Ca2+ deregulation in both CA3 and CA1 pyramidal neurons. A, Relationship between intracellular Zn2+ and Ca2+ rises and loss of membrane integrity in individual CA3 neurons subjected to OGD. Pseudocolor fluorescent images (top) show cells loaded with a low-affinity ratiometric Ca2+ indicator (Fura-FF; 340/380 ratio images), along with either a Zn2+-sensitive indicator (FluoZin-3, background subtracted emission intensity, arbitrary units, AU; left) or an ion-insensitive fluorescent compound (Alexa Fluor-488, background-subtracted emission intensity, AU; right) and subjected to 15 min of OGD. Numbers indicate time (in minutes) after the onset of OGD. Traces (bottom) show fluorescence changes in the same neurons. Note that the Zn2+ rise precedes a sharp Ca2+ deregulation event (left) and that the Ca2+ deregulation is accompanied by a loss of the Alexa Fluor-488 signal (one cell representative of four; right), indicative of loss of membrane integrity. B, Zn2+ rises precede the terminal Ca2+ deregulation in CA3 as well as CA1 pyramidal neurons. Individual FluoZin-3- and Fura-FF-loaded CA1 and CA3 neurons were subjected to OGD; traces (±SEM; aligned for the onset of Ca2+ deregulation) show mean changes in somatic FluoZin-3 fluorescence (ΔF/Fo; blue) and Fura-FF ratio changes (black; CA3, top: Zn2+ rise 7.7 ± 0.6 min, Ca2+ rise 11.6 ± 0.6 min, n = 8, p = 5.1 × 10⁻⁴; CA1, bottom: Zn2+ rise 7.5 ± 0.5 min, Ca2+ rise 10.6 ± 0.5 min; n = 9, p = 3.4 × 10⁻⁴; the interval from the Zn2+ rise to the Ca2+ deregulation was not different between CA1 and CA3; p = 0.452, ANOVA linear contrast). C, Similar Zn2+ contributions to the occurrence of terminal Ca2+ deregulation in CA3 and CA1 pyramidal neurons. Hippocampal slices were subjected to OGD alone (black) or in the presence of the Zn2+ chelator TPEN (40 μm; blue). Traces (±SEM; aligned for the onset of Ca2+ deregulation) show mean Fura-FF ratio changes (CA3, top: control: 11.2 ± 0.7 min, n = 9; TPEN: 14.4 ± 0.6 min, n = 6, p = 5.3 × 10⁻³; CA1, bottom: control: 10.6 ± 0.5 min, n = 9; TPEN: 14.7 ± 0.7 min, n = 9, p = 1.1 × 10⁻⁴; TPEN-induced delay in Ca2+ deregulation was not different between CA3 and CA1, p = 0.62, ANOVA linear contrast).
Figure 2.
Figure 2.
There was a greater contribution of acute NMDA- and VGCC-mediated excitotoxicity to OGD-evoked Ca2+ deregulation in CA3 than in CA1 pyramidal neurons. CA1 and CA3 neurons were loaded with FluoZin-3 and Fura-FF and subjected to OGD alone (black), with the NMDA receptor antagonist MK-801 (MK, red; 10 μm), or with both MK-801 and the VGCC blocker nimodipine (MK/Nim, blue; both at 10 μm); traces (±SEM; aligned for the onset of Ca2+ deregulation) show mean Fura-FF ratio changes. Each of these anti-excitotoxic interventions delayed Ca2+ deregulation in both CA3 (A) and CA1 (B) (CA3: control: 11.1 ± 0.6, n = 13; MK-801: 17.5 ± 0.5, n = 5, p = 5.7 × 10⁻⁶; MK/Nim: 20.2 ± 0.9 min, n = 10, p = 7.8 × 10⁻⁹ vs control for both treatments; CA1: control: 10.6 ± 0.5 min, n = 9; MK-801: 13.5 ± 1.1 min, n = 7, p = 0.017; MK/Nim:16.7 ± 0.8 min, n = 10, p = 1.4 × 10⁻⁵ vs control). Notably, each of these interventions provided a greater degree of protection in CA3 than in CA1 (p = 0.044 for MK801 alone and p = 0.019 for MK/Nim by ANOVA linear contrast).
Figure 3.
Figure 3.
Contribution of synaptic Zn2+ release and its entry through Ca-AMPA channels to OGD-evoked Ca2+ deregulation in CA3 pyramidal neurons. CA1 and CA3 neurons in slices from wild-type mice (A) and ZnT3 KO mice (B) were loaded with Fura-FF and FluoZin-3 and subjected to OGD alone (black) or in the presence of TPEN (40 μm) or NASPM (100 μm) as indicated (blue). Traces (±SEM; aligned for the onset of Ca2+ deregulation) show mean Fura-FF ratio changes. A, Ca-AMPA channel blockade substantially delays Ca2+ deregulation in CA3 (left), with no effect on CA1 neurons (right) (CA3: control: 11.5 ± 0.7 min, n = 7; NASPM: 18.1 ± 1.2 min, n = 5; p = 6 × 10⁻⁴; CA1: control: 10.6 ± 0.5 min, n = 9; NASPM: 10.7 ± 0.4 min, n = 5; p = 0.86). B, In the absence of vesicular Zn2+ (in ZnT3 KOs), the protective effects of TPEN and of NASPM on CA3 neurons are eliminated (but TPEN still protects in CA1; CA3: control: 12.1 ± 0.9 min, n = 9; NASPM: 12.8 ± 0.9 min, n = 9, p = 0.58; TPEN: 12.2 ± 0.6 min, n = 6, p = 0.96; CA1: control: 8.4 ± 0.8 min, n = 6; TPEN: 11.5 ± 1.0 min, n = 7, p = 0.037).
Figure 4.
Figure 4.
MT-III deletion substantially eliminates the Zn2+ contribution to acute OGD-induced injury in CA1 (but not CA3) pyramidal neurons. CA1 and CA3 neurons in slices from MT-III KO mice were loaded with Fura-FF and FluoZin-3 and subjected to OGD alone (black) or with either TPEN (40 μm) or MK-801+ nimodipine (MK/Nim, each at 10 μm) as indicated (blue). Traces (±SEM; aligned for the onset of Ca2+ deregulation) show mean Fura-FF ratio changes. A, In the absence of MT-III, the protective effects of TPEN persist in CA3 (left) but are eliminated in CA1 (right) (CA3: control: 10.2 ± 0.7 min, n = 8, TPEN: 13.6 ± 0.7 min, n = 8, p = 3.7 × 10⁻³; CA1: control: 11.6 ± 0.7 min, n = 9, TPEN: 12.0 ± 0.8 min, n = 7, p = 0.76). B, In the absence of MT-III, NMDA- and VGCC-mediated excitotoxicity contributes substantially to OGD-evoked Ca2+ deregulation in both CA3 and CA1 pyramidal neurons (CA3: control: 10.2 ± 0.7 min, n = 8, MK/Nim: 17.2 ± 1.2 min, n = 7, p = 5.2 × 10⁻⁴; CA1: control: 13.0 ± 0.7 min, n = 9, MK/Nim: 20.4 ± 0.7 min, n = 10, p = 3.1 × 10⁻⁷; the MK/Nim-induced delay in Ca2+ deregulation was not different between CA3 and CA1, p = 0.78, ANOVA linear contrast).
Figure 5.
Figure 5.
Sublethal OGD evokes delayed mitochondrial Zn2+ accumulation in CA1, but not in CA3 pyramidal neurons. AC, Individual CA1 and CA3 neurons in slices from wild-type mice were loaded with Fura-FF and FluoZin-3, subjected to sublethal episodes of OGD (∼7–10 min, OGD terminated ∼1 min after the initial cytosolic Zn2+rise) and cytosolic Zn2+ (monitored as FluoZin-3 ΔF/F0), and followed for an additional hour without (A) or with (B, C) the delayed addition of FCCP (2 μm × 5 min, as indicated). Pseudocolor images show FluoZin-3 fluorescence in single representative neurons at the indicated times after the start of OGD (in minutes), and traces (FluoZin-3 ΔF/F0, blue; Fura-FF ratio, black) show time course of changes in the same neurons (mean start times of the initial OGD-evoked Zn2+ rise were as follows: A: 8.0 ± 0.8 min, n = 5; B: 7.7 ± 0.75 min, n = 7; and C: 7.2 ± 0.38 min, n = 8 neurons). A, Cytosolic Zn2+ rise and slow recovery in CA1 neurons after sublethal OGD. Note the further rise after the termination of OGD followed by a slow recovery of cytosolic Zn2+ over the ∼30 min after the OGD (trace representative of n = 5). B, C, Administration of FCCP 55–60 min after OGD termination evoked large cytosolic Zn2+ rises in CA1 but not in CA3 neurons (mean FCCP elicited Zn2+ rises at 55–60 min: CA1: 75 ± 21.9%, n = 7; CA3: 8.75 ± 7.4%, n = 8, p = 3.5 × 10⁻³). D, E, Substantial recovery of mitochondrial potential (ΔΨm) in both CA1 and CA3 pyramidal neurons after sublethal OGD. Slices were bath loaded with Rhod123 and subjected to sublethal (9 min) OGD followed after ∼50 min by FCCP application as indicated. Traces (from representative single neurons) demonstrate changes in Rhod123 fluorescence relative to the pre-OGD baseline (ΔFOGD). However, because slow dye loss from the slices after OGD attenuated absolute ΔF rises, for quantitative comparisons of magnitudes of ΔF changes (reflecting the degree of ΔΨm loss triggered by OGD vs that triggered by FCCP), responses were renormalized to the 3 min just before the addition of FCCP (ΔFFCCP; red; CA1: ΔFOGD 63 ± 5.7%, ΔFFCCP 58.7 ± 5.2%, ΔFFCCPFOGD 0.98 ± 0.14, n = 6; CA3: ΔFOGD 56 ± 3.5%, ΔFFCCP 56 ± 10%, ΔFFCCPFOGD1.02 ± 0.19, n = 7; p = 0.88).
Figure 6.
Figure 6.
Delayed mitochondrial Zn2+ uptake in CA1 pyramidal neurons is substantially attenuated by MCU inhibition shortly after OGD or by deletion of MT-III. CA1 neurons were coloaded with FluoZin-3 and Fura-FF and subjected to sublethal OGD, followed, after 55–60 min (A, C) or ∼70 min (B), by the addition of FCCP (2 μm × 5 min). Traces show the time course of changes in FluoZin-3 ΔF/F0 (blue) and Fura-FF ratio (black) in representative neurons (mean start times of the initial OGD-evoked Zn2+ rise were as follows: A: 7.6 ± 0.6 min, n = 7; B: 7.0 ± 0.4 min, n = 6; C: 7.1 ± 0.3 min, n = 10). A, B, MCU inhibition only blocks mitochondrial Zn2+ uptake when applied shortly after OGD, while cytosolic Zn2+ is elevated. RR (10 μm for 15 min) was applied ∼7–10 min (A) or ∼35–40 min (B) after OGD (traces show representative single neurons), followed by application of FCCP as indicated. Note the absence of FCCP-elicited Zn2+ rise with early application of RR, while cytosolic Zn2+ was still elevated (A), in contrast to the strong FCCP-elicited Zn2+ rise with later application of RR (B). Also note the small intracellular Zn2+ rise triggered by late RR application, most likely resulting from blockage of ongoing Zn2+ uptake into mitochondria at this late time point (arrow; seen in 6 of 6 cells examined; mean FCCP-elicited Zn2+ rises, as FluoZin-3 ΔF/F0: A: 6.3 ± 4.2%, n = 7, p = 1.7 × 10⁻³; B: 68 ± 18.3%, n = 6, p = 0.8; both comparisons with the rise in control, 75 ± 21.9%, from Fig. 5B). C, Diminished delayed mitochondrial Zn2+ accumulation in CA1 pyramidal neurons of MT-III KO mice. Hippocampal neurons from MT3 mice were loaded with indicators and subjected to sublethal OGD, followed by application of FCCP as in Figure 5B. Note the paucity of Zn2+ rise triggered by FCCP exposure compared with that seen in WT mice (FluoZin-3 ΔF/F0: 20.7 ± 8%, n = 10). D, Summary data: Delayed mitochondrial Zn2+ uptake as a function of treatment. Bars indicate mean FCCP-evoked Zn2+ rises (normalized to the pre-FCCP baseline, ΔFFCCP) after sublethal OGD under the conditions indicated. *p < 0.01 versus CA1 control; (p-values vs CA1 control are as indicated above: CA1 early RR: p = 1.7 × 10⁻³; CA1 late RR: p = 0.8; CA3: p = 3.5 × 10⁻³; #for CA1 MT-III KO, we elect not to display a p-value because of the strain difference).
Figure 7.
Figure 7.
Mitochondrial swelling after OGD in CA1 pyramidal neurons is attenuated by MCU blockade. Brain slices were subjected to sham wash in oxygenated medium (control) or were subjected to 8.5 min OGD either alone or with RR (10 μm, applied 10 min after termination of the OGD for 15 min). One hour after the end of the OGD, slices were fixed (with 4% PFA) and processed for immunostaining with TOM20 antibody. Top, Appearance of mitochondrial swelling. Representative merged images show the bright-field appearance of pyramidal neurons in the CA1 region overlaid with confocal fluorescence images of TOM-20-labeled mitochondria. Scale bar, 10 μm. Bottom, Quantitative measurements. Left, Mitochondrial measurements (length and width; obtained using ImageJ software, see Materials and Methods) after the indicated treatment. Graphs display mean values from 3–5 independently treated hippocampal slices comprising ≥18 neurons each condition and with 107 mitochondria measured in control (144 in OGD; 190 in OGD + RR; see Materials and Methods; length of control 1.4 ± 0.047 μm, OGD 0.8 ± 0.032 μm, p = 2.0 × 10⁻⁴ vs control; OGD + RR 1.0 ± 0.062 μm, p = 8 × 10⁻³ vs control, p = 0.04 vs OGD; width: control 0.49 ± 0.007 μm, OGD 0.64 ± 0.045 μm, p = 0.03 vs control; OGD + RR 0.55 ± 0.024 μm, p = 0.09 vs control, p = 0.1 vs OGD). Right, Mean L/W ratios observed after each treatment (based on the same data; control 2.9 ± 0.1, OGD 1.4 ± 0.11, p = 1.9 × 10⁻⁴ vs control; OGD + RR 2.0 ± 0.17, p = 7.9 × 10⁻³ vs control, p = 0.03 vs OGD). Note that OGD caused a “rounding up” of mitochondria, with a decrease in length and increase in width, and that this change was attenuated by delayed treatment with RR. *p < 0.05; **p < 0.01; ***p < 0.001.
Figure 8.
Figure 8.
Schematic model showing possible acute and early “reperfusion” events after sublethal ischemia in CA1 pyramidal neurons. Traces show representative FluoZin-3 changes from a single neuron and Rhod123 changes from the CA1 pyramidal cell layer of a different slice. (1) Early OGD: Zn2+ (circles) and glutamate (triangles) are released from presynaptic terminals. Zn2+ and Ca2+ enter postsynaptic neurons via glutamate activated (Ca-AMPA and NMDA) channels and VGCC. Zn2+ is also mobilized from MT-III as a result of ischemia-associated oxidative stress and acidosis. Intracellular Zn2+ and Ca2+ are taken up by mitochondria (via the MCU). Mitochondrial dysfunction including ROS generation will promote further Zn2+ mobilization, resulting in a feedforward cascade of mitochondrial dysfunction and Zn2+ accumulation. This uptake causes early mitochondrial depolarization (loss of ΔΨm), which precedes the sharp cytosolic Zn2+ rise. (2) Later during OGD, after some threshold of mitochondrial Zn2+ and Ca2+ accumulation, mitochondria strongly depolarize (loss of ΔΨm) and the Zn2+ and Ca2+ sequestered within them are released back into the cytosol. At this point, the oxidative and acidotic environment combined with mitochondrial dysfunction will impair both the buffering of Zn2+ by MT-III and cellular extrusion of Ca2+ and Zn2+, impeding recovery of ionic homeostasis. In the absence of prompt reperfusion, severe cytosolic Ca2+ deregulation and rapid cell death ensues. (3) “Reperfusion” after sublethal OGD: if reperfusion with restoration of O2 and glucose occurs before the onset of Ca2+ deregulation, then mitochondria can begin to recover function and ΔΨm. With recovery of ΔΨm (along with oxidative environment possibly worsened by reperfusion), cytosolic Zn2+ is taken back up into mitochondria, where it can remain sequestered for extended periods of time (likely hours; Sensi et al., 2002; Bonanni et al., 2006) and can impair their function (likely synergistically with Ca2+; Sensi et al., 2000; Jiang et al., 2001). Depending upon the extent of Zn2+ uptake, mitochondria might gradually recover their normal function or may undergo delayed dysfunction comprising ROS production and opening of the mPTP, with the release of cytochrome C (CyC) and other apoptotic mediators, contributing to delayed cell death. Such a mechanism is compatible with findings of preferential delayed mitochondrial dysfunction with CyC release in CA1 pyramidal neurons after transient ischemia (Nakatsuka et al., 1999; Sugawara et al., 1999).

References

    1. Aizenman E, Stout AK, Hartnett KA, Dineley KE, McLaughlin B, Reynolds IJ. Induction of neuronal apoptosis by thiol oxidation: putative role of intracellular zinc release. J Neurochem. 2000;75:1878–1888. - PubMed
    1. Antonawich FJ. Translocation of cytochrome c following transient global ischemia in the gerbil. Neurosci Lett. 1999;274:123–126. doi: 10.1016/S0304-3940(99)00687-4. - DOI - PubMed
    1. Assaf SY, Chung SH. Release of endogenous Zn2+ from brain tissue during activity. Nature. 1984;308:734–736. doi: 10.1038/308734a0. - DOI - PubMed
    1. Ben-Ari Y, Tremblay E, Ottersen OP. Injections of kainic acid into the amygdaloid complex of the rat: an electrographic, clinical and histological study in relation to the pathology of epilepsy. Neuroscience. 1980a;5:515–528. doi: 10.1016/0306-4522(80)90049-4. - DOI - PubMed
    1. Ben-Ari Y, Tremblay E, Ottersen OP, Meldrum BS. The role of epileptic activity in hippocampal and “remote” cerebral lesions induced by kainic acid. Brain Res. 1980b;191:79–97. doi: 10.1016/0006-8993(80)90316-9. - DOI - PubMed

Publication types

MeSH terms