

The Ubiquitin-like with PHD and Ring Finger Domains 1 (UHRF1)/DNA Methyltransferase 1 (DNMT1) Axis Is a Primary Regulator of Cell Senescence
- PMID: 28100769
- PMCID: PMC5339756
- DOI: 10.1074/jbc.M116.750539
The Ubiquitin-like with PHD and Ring Finger Domains 1 (UHRF1)/DNA Methyltransferase 1 (DNMT1) Axis Is a Primary Regulator of Cell Senescence
Abstract
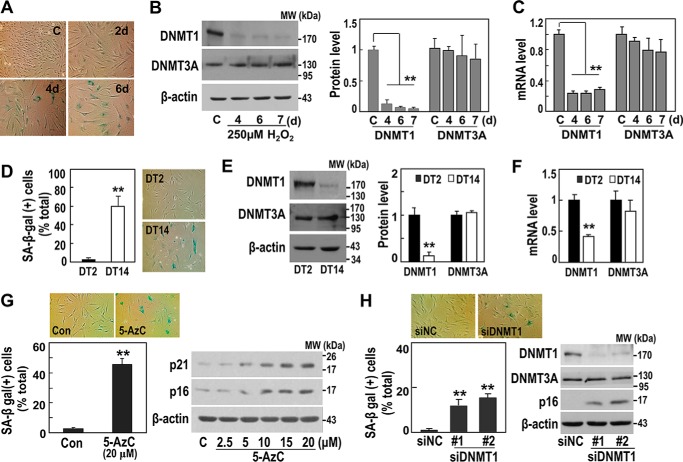
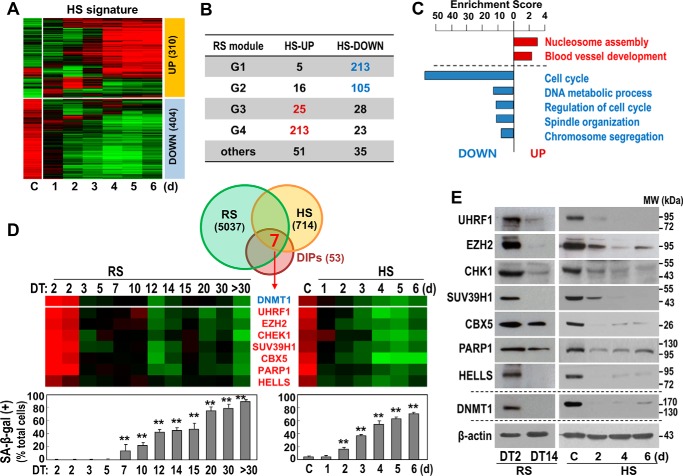
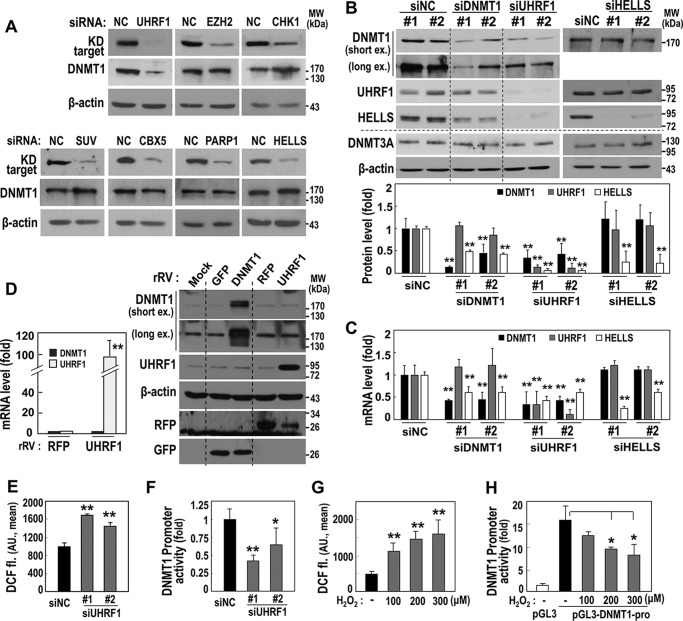
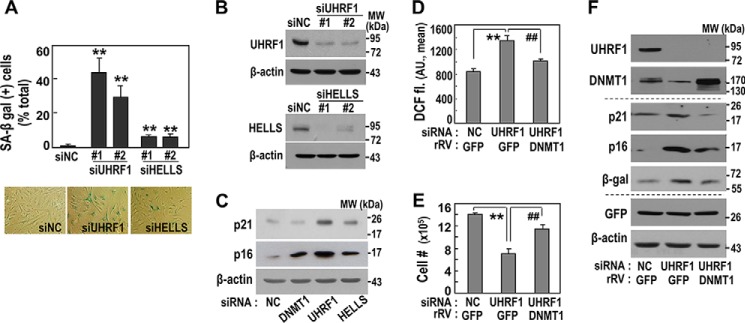
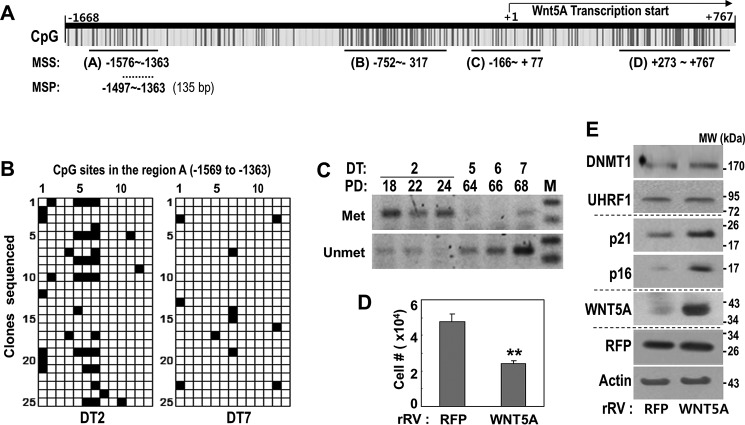
As senescence develops, cells sequentially acquire diverse senescent phenotypes along with simultaneous multistage gene reprogramming. It remains unclear what acts as the key regulator of the collective changes in gene expression at initiation of senescent reprogramming. Here we analyzed time series gene expression profiles obtained in two different senescence models in human diploid fibroblasts: replicative senescence and H2O2-induced senescence. Our results demonstrate that suppression of DNA methyltransferase 1 (DNMT1)-mediated DNA methylation activity was an initial event prior to the display of senescent phenotypes. We identified seven DNMT1-interacting proteins, ubiquitin-like with PHD and ring finger domains 1 (UHRF1), EZH2, CHEK1, SUV39H1, CBX5, PARP1, and HELLS (also known as LSH (lymphoid-specific helicase) 1), as being commonly down-regulated at the same time point as DNMT1 in both senescence models. Knockdown experiments revealed that, among the DNMT1-interacting proteins, only UHRF1 knockdown suppressed DNMT1 transcription. However, UHRF1 overexpression alone did not induce DNMT1 expression, indicating that UHRF1 was essential but not sufficient for DNMT1 transcription. Although UHRF1 knockdown effectively induced senescence, this was significantly attenuated by DNMT1 overexpression, clearly implicating the UHRF1/DNMT1 axis in senescence. Bioinformatics analysis further identified WNT5A as a downstream effector of UHRF1/DNMT1-mediated senescence. Senescence-associated hypomethylation was found at base pairs -1569 to -1363 from the transcription start site of the WNT5A gene in senescent human diploid fibroblasts. As expected, WNT5A overexpression induced senescent phenotypes. Overall, our results indicate that decreased UHRF1 expression is a key initial event in the suppression of DNMT1-mediated DNA methylation and in the consequent induction of senescence via increasing WNT5A expression.
Keywords: DNA methylation; cellular senescence; gene expression; gene regulation; microarray.
© 2017 by The American Society for Biochemistry and Molecular Biology, Inc.
Conflict of interest statement
The authors declare that they have no conflicts of interest with the contents of this article
Figures

Similar articles
-
A role for LSH in facilitating DNA methylation by DNMT1 through enhancing UHRF1 chromatin association.Nucleic Acids Res. 2020 Dec 2;48(21):12116-12134. doi: 10.1093/nar/gkaa1003. Nucleic Acids Res. 2020. PMID: 33170271 Free PMC article.
-
UHRF1 is associated with epigenetic silencing of BRCA1 in sporadic breast cancer.Breast Cancer Res Treat. 2010 Sep;123(2):359-73. doi: 10.1007/s10549-009-0652-2. Epub 2009 Nov 27. Breast Cancer Res Treat. 2010. PMID: 19943104
-
DNA hypomethylation promotes UHRF1-and SUV39H1/H2-dependent crosstalk between H3K18ub and H3K9me3 to reinforce heterochromatin states.Mol Cell. 2025 Jan 16;85(2):394-412.e12. doi: 10.1016/j.molcel.2024.11.009. Epub 2024 Dec 3. Mol Cell. 2025. PMID: 39631394
-
Coordinated Dialogue between UHRF1 and DNMT1 to Ensure Faithful Inheritance of Methylated DNA Patterns.Genes (Basel). 2019 Jan 18;10(1):65. doi: 10.3390/genes10010065. Genes (Basel). 2019. PMID: 30669400 Free PMC article. Review.
-
Regulatory mechanism and biological function of UHRF1-DNMT1-mediated DNA methylation.Funct Integr Genomics. 2022 Dec;22(6):1113-1126. doi: 10.1007/s10142-022-00918-9. Epub 2022 Nov 14. Funct Integr Genomics. 2022. PMID: 36372834 Review.
Cited by
-
MicroRNAs, Long Non-Coding RNAs, and Circular RNAs in the Redox Control of Cell Senescence.Antioxidants (Basel). 2022 Feb 28;11(3):480. doi: 10.3390/antiox11030480. Antioxidants (Basel). 2022. PMID: 35326131 Free PMC article. Review.
-
Delineating the glioblastoma stemness by genes involved in cytoskeletal rearrangements and metabolic alterations.World J Stem Cells. 2023 May 26;15(5):302-322. doi: 10.4252/wjsc.v15.i5.302. World J Stem Cells. 2023. PMID: 37342224 Free PMC article. Review.
-
Mitoribosomal Deregulation Drives Senescence via TPP1-Mediated Telomere Deprotection.Cells. 2022 Jun 30;11(13):2079. doi: 10.3390/cells11132079. Cells. 2022. PMID: 35805162 Free PMC article.
-
Comparative Proteomics of Dying and Surviving Cancer Cells Improves the Identification of Drug Targets and Sheds Light on Cell Life/Death Decisions.Mol Cell Proteomics. 2018 Jun;17(6):1144-1155. doi: 10.1074/mcp.RA118.000610. Epub 2018 Mar 23. Mol Cell Proteomics. 2018. PMID: 29572246 Free PMC article.
-
UHRF genes regulate programmed interdigital tissue regression and chondrogenesis in the embryonic limb.Cell Death Dis. 2019 Apr 25;10(5):347. doi: 10.1038/s41419-019-1575-4. Cell Death Dis. 2019. PMID: 31024001 Free PMC article.
References
-
- Collado M., Blasco M. A., and Serrano M. (2007) Cellular senescence in cancer and aging. Cell 130, 223–233 - PubMed
-
- Kim Y. M., Byun H. O., Jee B. A., Cho H., Seo Y. H., Kim Y. S., Park M. H., Chung H. Y., Woo H. G., and Yoon G. (2013) Implications of time-series gene expression profiles of replicative senescence. Aging Cell 12, 622–634 - PubMed
MeSH terms
Substances
LinkOut - more resources
Full Text Sources
Other Literature Sources
Molecular Biology Databases
Research Materials
Miscellaneous
