. 2017 Apr 1;34(4):997-1007.
doi: 10.1093/molbev/msw275.

Genomic Infectious Disease Epidemiology in Partially Sampled and Ongoing Outbreaks

Affiliations

Genomic Infectious Disease Epidemiology in Partially Sampled and Ongoing Outbreaks

Xavier Didelot et al. Mol Biol Evol. .

Abstract

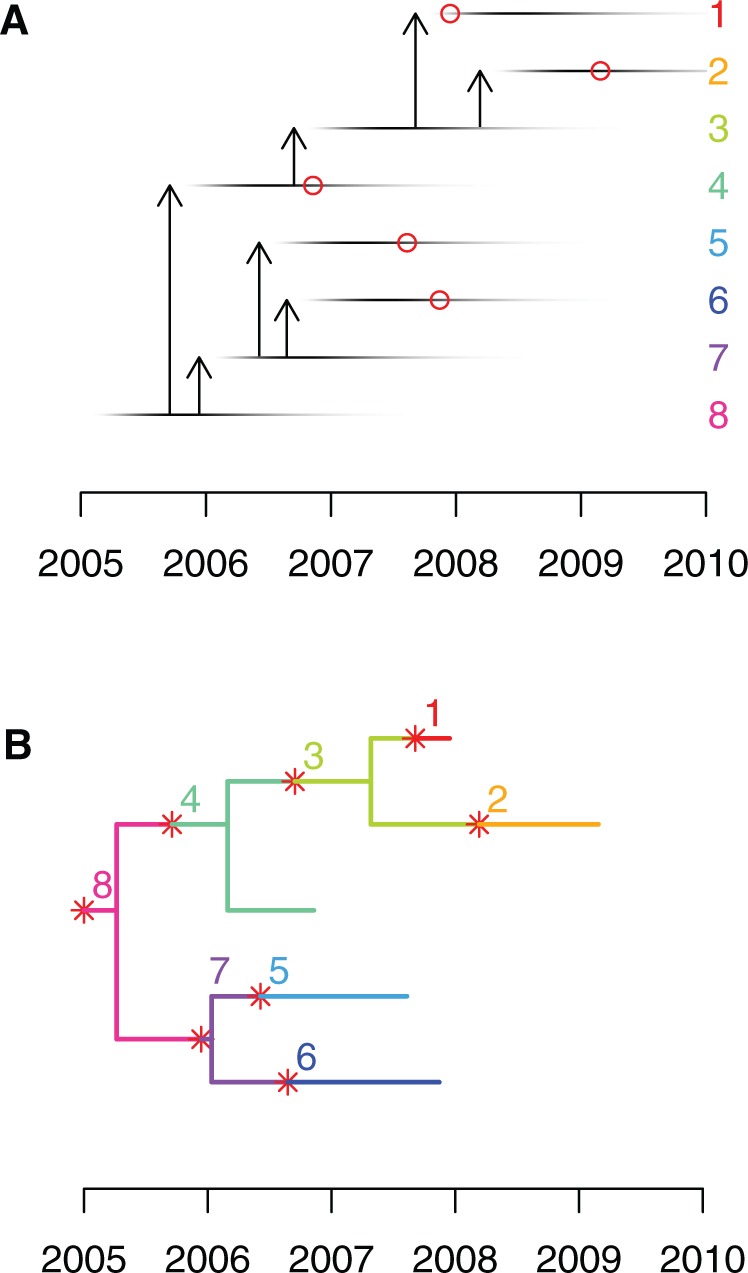
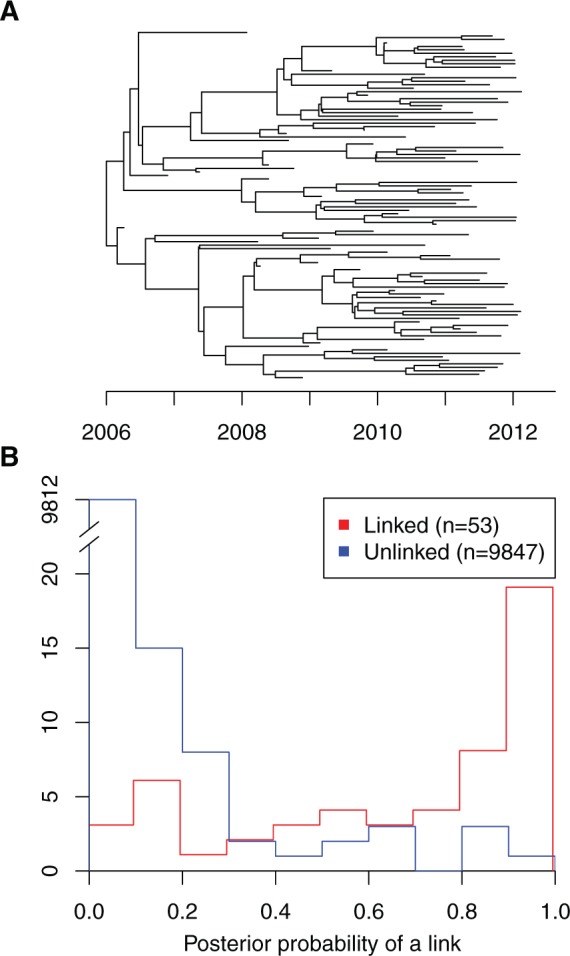
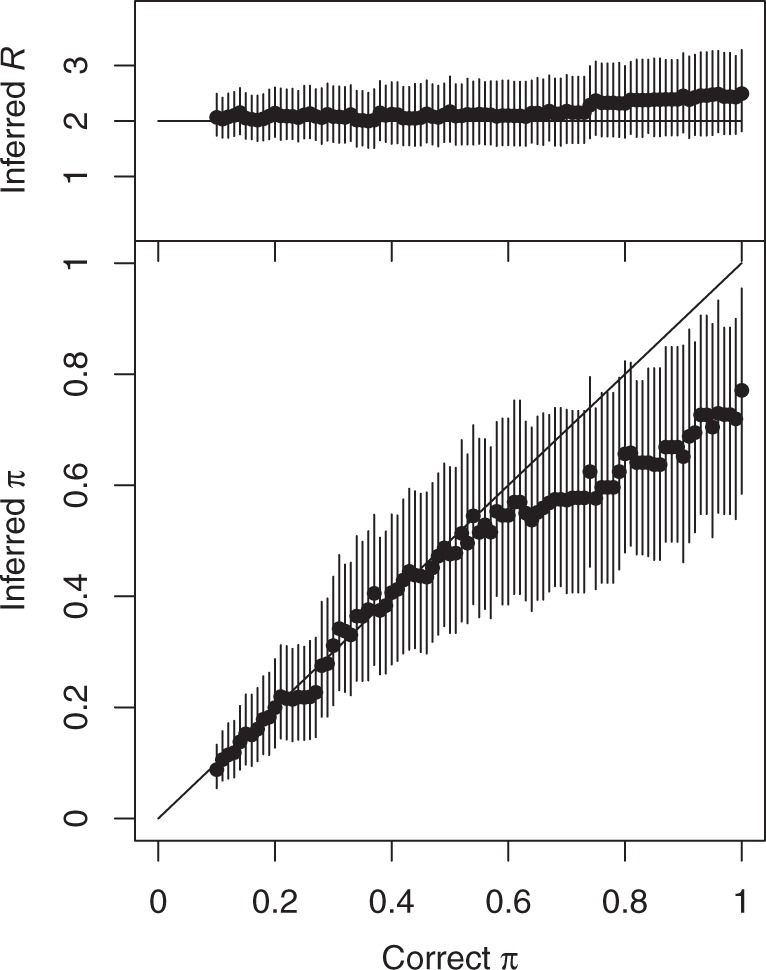
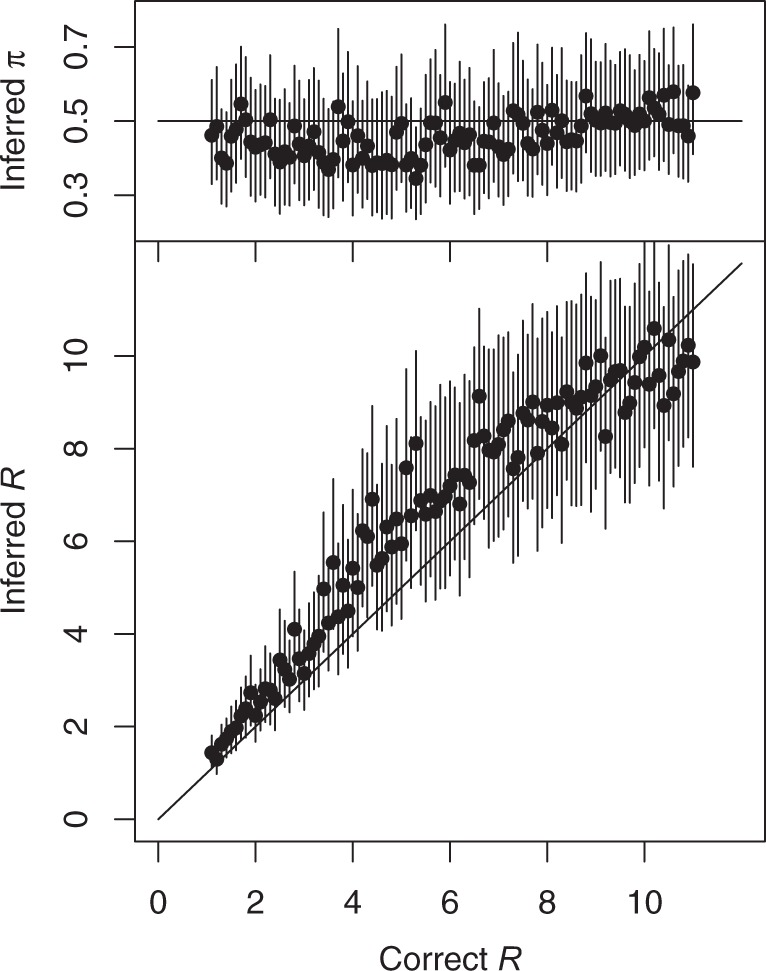
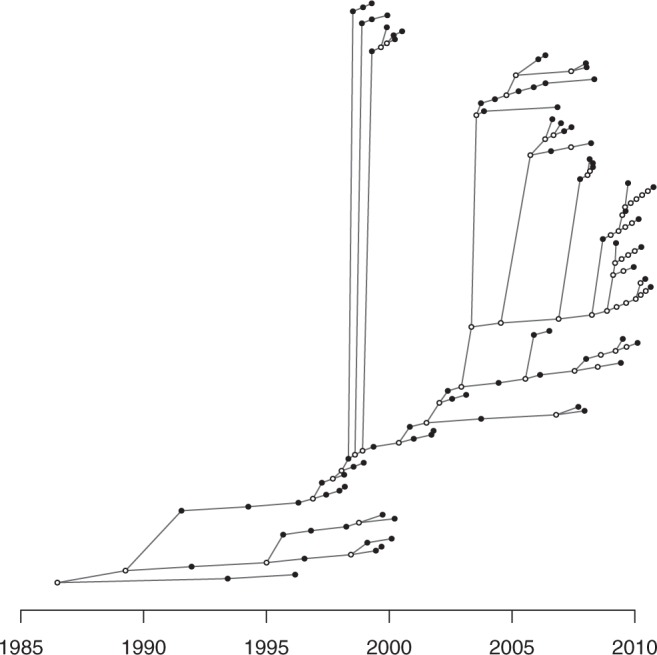
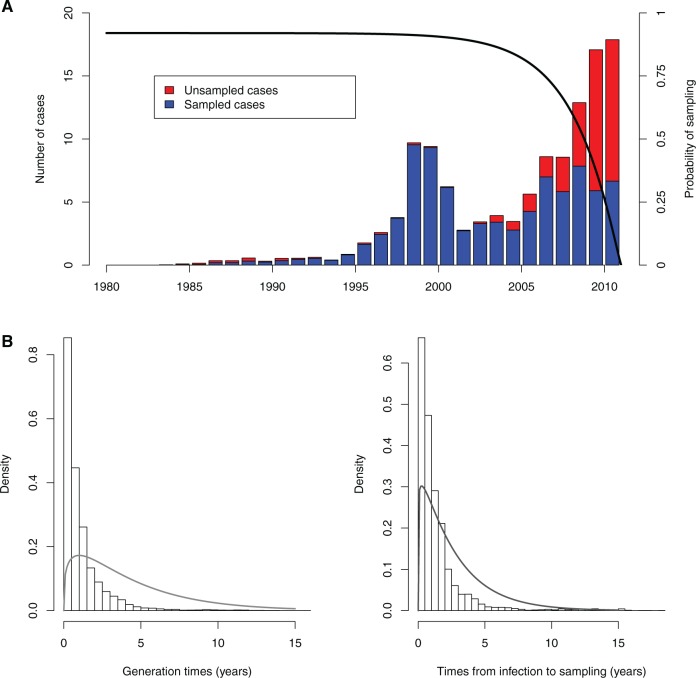
Genomic data are increasingly being used to understand infectious disease epidemiology. Isolates from a given outbreak are sequenced, and the patterns of shared variation are used to infer which isolates within the outbreak are most closely related to each other. Unfortunately, the phylogenetic trees typically used to represent this variation are not directly informative about who infected whom-a phylogenetic tree is not a transmission tree. However, a transmission tree can be inferred from a phylogeny while accounting for within-host genetic diversity by coloring the branches of a phylogeny according to which host those branches were in. Here we extend this approach and show that it can be applied to partially sampled and ongoing outbreaks. This requires computing the correct probability of an observed transmission tree and we herein demonstrate how to do this for a large class of epidemiological models. We also demonstrate how the branch coloring approach can incorporate a variable number of unique colors to represent unsampled intermediates in transmission chains. The resulting algorithm is a reversible jump Monte-Carlo Markov Chain, which we apply to both simulated data and real data from an outbreak of tuberculosis. By accounting for unsampled cases and an outbreak which may not have reached its end, our method is uniquely suited to use in a public health environment during real-time outbreak investigations. We implemented this transmission tree inference methodology in an R package called TransPhylo, which is freely available from https://github.com/xavierdidelot/TransPhylo.

Keywords: genomic epidemiology; infectious disease outbreak; transmission analysis.


Figures

Fig. 1
Fig. 1
(A) An illustrative example of transmission tree, with each horizontal line representing a case, and the darkness of each point representing their changing infectivity over time. Vertical arrows represent transmission from case to case. The red circles indicate which individuals were sampled (1, 2, 4, 5, and 6) and when. (B) An example of colored phylogeny which corresponds to the transmission scenario shown in part A. Evolution within each host is shown in a unique color for each individual, as indicated by the labels and on the right-hand side in (A). Red stars represent transmission events and correspond to the arrows shown in (A). Tips of the phylogeny represent sampled cases as shown by the red circles in (A).
Fig. 2
Fig. 2
(A) Timed phylogeny showing the relationship between 100 genomes sampled with density π=0.5 in a simulated outbreak. (B) Distribution of the posterior probability of direct transmission inferred by our algorithm for pairs of individuals in which a link existed in the simulation (red) and pairs of individuals that were not linked (blue).
Fig. 3
Fig. 3
Inferred values of the reproduction number R (top) and the sampling proportion π (bottom) in simulated datasets for which the correct value of R is 2, and the correct value of π is increased from 0.1 to 1 (as shown on the x-axis). Dots represent the mean of the posterior sample and bars the 95% credibility intervals.
Fig. 4
Fig. 4
Inferred values of the sampling proportion π (top) and the reproduction number R (bottom) in simulated datasets for which the correct value of π is 0.5, and the correct value of R is increased from 1 to 11 (as shown on the x-axis). Dots represent the mean of the posterior sample and bars the 95% credibility intervals.
Fig. 5
Fig. 5
Consensus transmission tree for the tuberculosis outbreak. To avoid confusion between this transmission tree and a phylogenetic tree, the layout is different from the way phylogenetic trees are usually represented. Dots represent individuals with on the x-axis the posterior mean time of infection. The y-axis is arbitrary. Filled dots represent sampled individuals and unfilled dots represent unsampled inferred individuals.
Fig. 6
Fig. 6
(A) Outbreak plot showing the numbers of sampled and unsampled cases through time in the posterior sample of transmission trees. Although the posterior estimate of π is 0.93, predicting that cases would eventually be detected with high probability, in the time period just before sampling ended, the inferred transmission trees contain a number of unsampled cases. The solid line represents the probability of sampling cases as a function of their infection time, given that observation stops at T = 2011. (B) Posterior generation times and times between infection and sampling. Bars show histograms of the posterior quantities and solid lines show the related prior densities.

Similar articles

Cited by

References

    1. Anderson RM, May RM.. 1992. Infectious diseases of humans: dynamics and control. Oxford: Oxford University Press.
    1. Azarian T, Daum RS, Petty LA, Steinbeck JL, Yin Z, Nolan D, Boyle-Vavra S, Hanage WP, Salemi M, David MZ, et al. 2016. Intrahost evolution of Methicillin-resistant Staphylococcus aureus USA300 among individuals with reoccurring skin and soft-tissue infections. J Infect Dis. 214:895–905. - PMC - PubMed
    1. Barry CE, Boshoff HI, Dartois V, Dick T, Ehrt S, Flynn J, Schnappinger D, Wilkinson RJ, Young D.. 2009. The spectrum of latent tuberculosis: rethinking the biology and intervention strategies. Nat Rev Microbiol. 7:845–855. - PMC - PubMed
    1. Becker N. 1977. Estimation for discrete time branching processes with application to epidemics. Biometrics 33:515–522. - PubMed
    1. Biek R, Pybus OG, Lloyd-Smith JO, Didelot X.. 2015. Measurably evolving pathogens in the genomic era. Trends Ecol Evol. 30:306–313. - PMC - PubMed

Publication types