. 2017 Jan 18;9(373):eaag2285.
doi: 10.1126/scitranslmed.aag2285.

Follicular CD8 T cells accumulate in HIV infection and can kill infected cells in vitro via bispecific antibodies

Affiliations

Follicular CD8 T cells accumulate in HIV infection and can kill infected cells in vitro via bispecific antibodies

Constantinos Petrovas et al. Sci Transl Med. .

Abstract

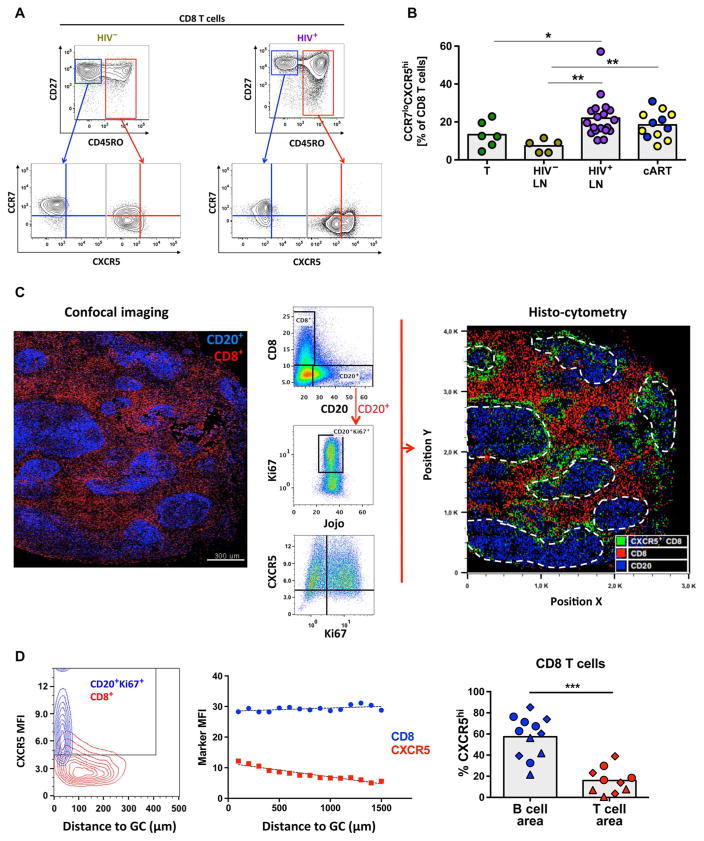
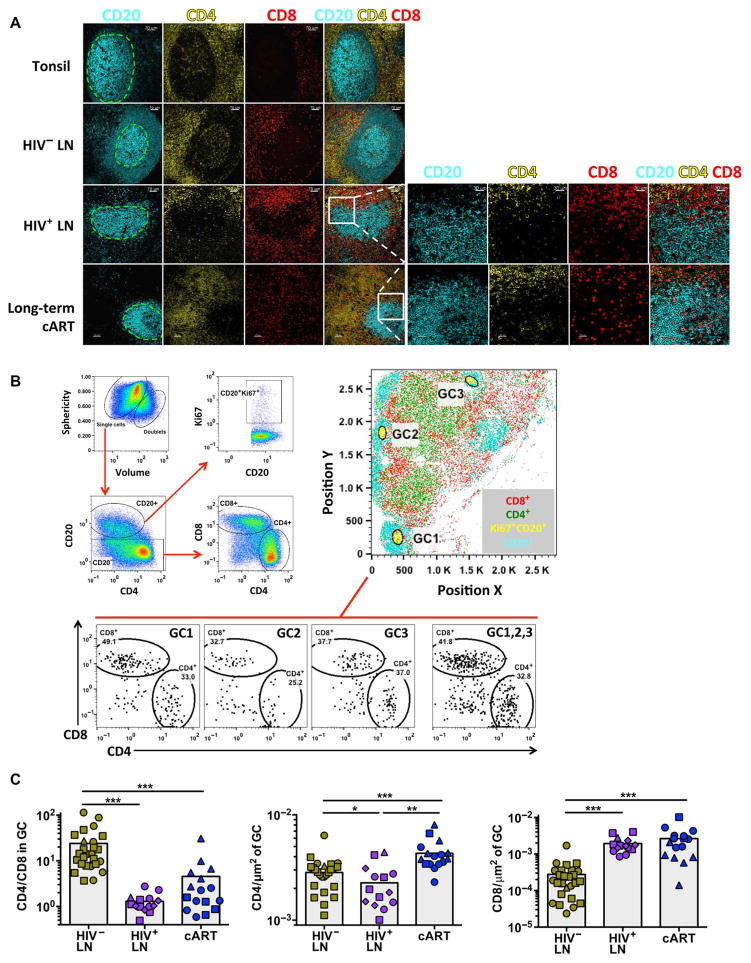
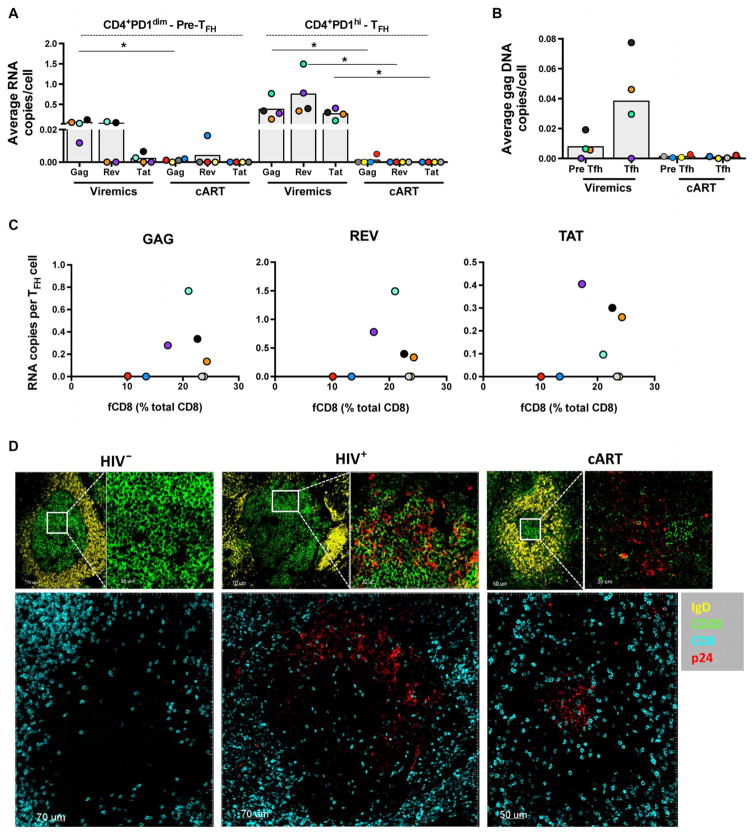
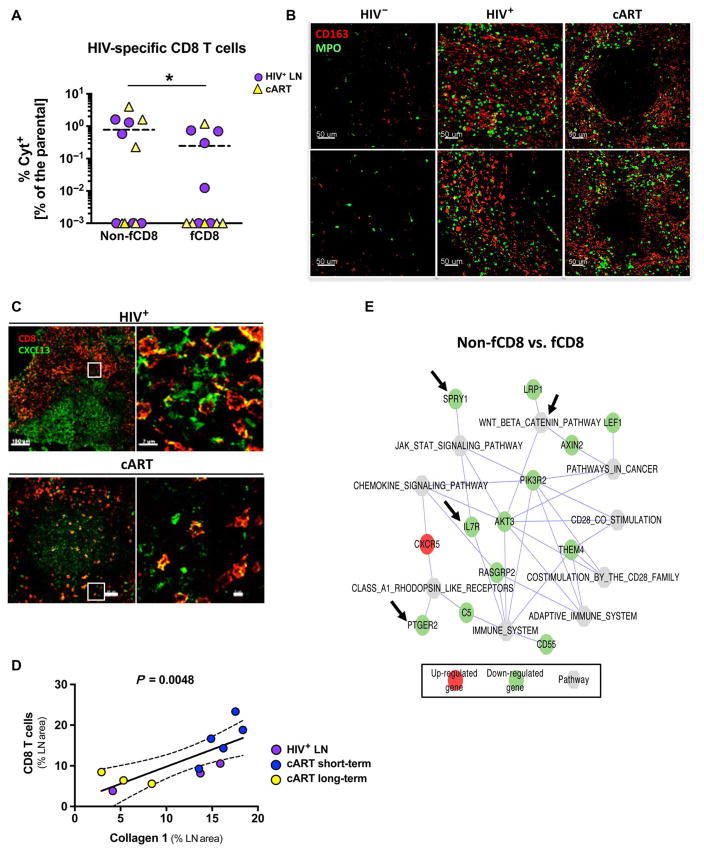
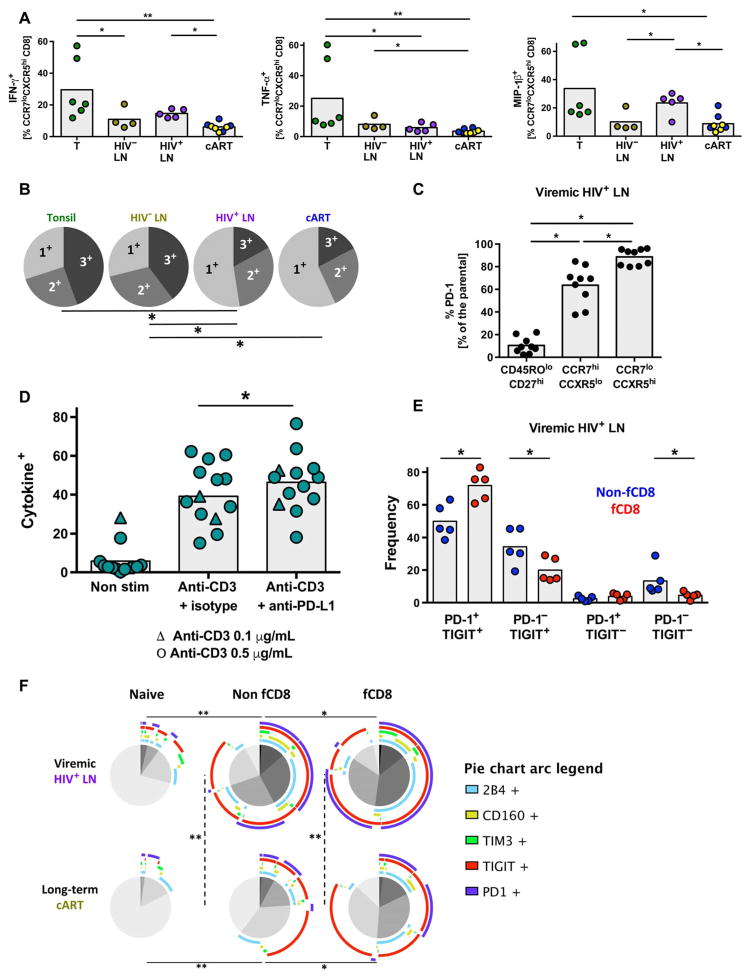
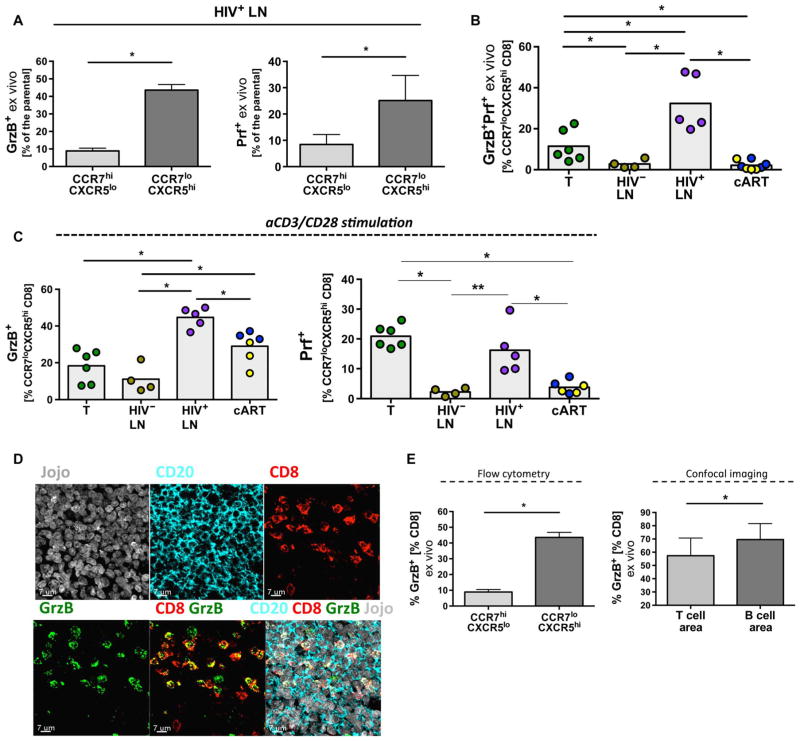
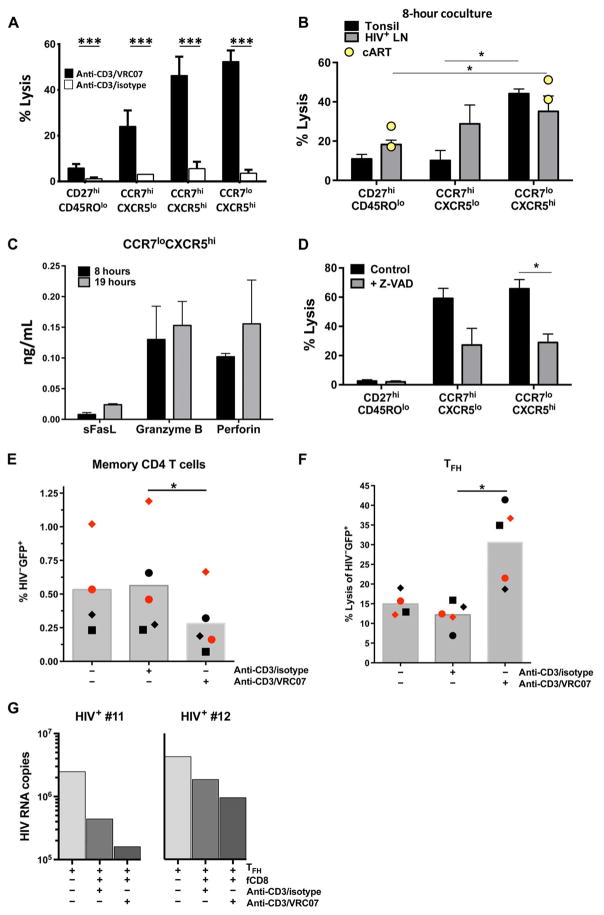
Cytolytic CD8 T cells play a crucial role in the control and elimination of virus-infected cells and are a major focus of HIV cure efforts. However, it has been shown that HIV-specific CD8 T cells are infrequently found within germinal centers (GCs), a predominant site of active and latent HIV infection. We demonstrate that HIV infection induces marked changes in the phenotype, frequency, and localization of CD8 T cells within the lymph node (LN). Significantly increased frequencies of CD8 T cells in the B cell follicles and GCs were found in LNs from treated and untreated HIV-infected individuals. This profile was associated with persistent local immune activation but did not appear to be directly related to local viral replication. Follicular CD8 (fCD8) T cells, despite compromised cytokine polyfunctionality, showed good cytolytic potential characterized by high ex vivo expression of granzyme B and perforin. We used an anti-HIV/anti-CD3 bispecific antibody in a redirected killing assay and found that fCD8 T cells had better killing activity than did non-fCD8 T cells. Our results indicate that CD8 T cells with potent cytolytic activity are recruited to GCs during HIV infection and, if appropriately redirected to kill HIV-infected cells, could be an effective component of an HIV cure strategy.


Conflict of interest statement

Competing interests: The authors declare that they have no competing interests.

Figures

Fig. 1
Fig. 1. Human LN fCD8 T cells express a CCR7loCXCR5hi phenotype
(A) Gating strategy used to define CCR7loCXCR5hi CD8 T cells in flow cytometry data sets. Representative flow cytometry plots from one HIV and one HIV+ LN are shown. (B) Pooled data showing the relative frequency (expressed as percentage of total CD8 T cells) of CD8 T cells expressing a CCR7loCXCR5hi phenotype. Cells from HIV tonsils (n = 6), HIV LNs (n = 5), viremic HIV+ LNs (n = 18), and short-term (n = 5, blue dots) or long-term (n = 7, yellow dots) cART-treated HIV+ LNs were analyzed. Experimental variables were analyzed by Mann-Whitney U test (shown; *P < 0.05, **P < 0.001) or Kruskal-Wallis analysis of variance (ANOVA) (P = 0.0025). (C) Histocytometry analysis of an HIV+ LN (HIV+ #22). The imaged area and distribution of CD8 and CD20 populations using a multicolor confocal assay are shown on the left. The imaging data were converted to flow cytometry type of data, and the gating scheme for the detection of particular populations is shown in the middle. CD20hiKi67hi B cells were used for the identification of GCs. The generated histo-cytometry image is shown on the right. The distribution of CD20 (blue), CD8 (red), and CXCR5hiCD8 (green) cells is shown (white dashed lines indicate GCs). (D) The mean fluorescence intensity (MFI) of CXCR5 on GC B cells and total CD8 T cells (HIV+ #22) with respect to their distance from the follicle is shown in the left panel. A similar analysis showing the MFI of CD8 and CD8-associated CXCR5 expression with respect to the distance from GC for another HIV+ LN (HIV+ #19) is shown in the middle panel. Pooled data showing the frequency of CXCR5hiCD8 T cells within individual B cell and T cell areas from viremic HIV+ LNs (n = 3) (right panel). Different symbols (circle, triangle, or diamond) represent different donors, whereas each dot represents a different B or T cell area. The Mann-Whitney U test was used for analysis; ***P < 0.0001.
Fig. 2
Fig. 2. fCD8 T cells accumulate in HIV-infected LNs
(A) Confocal images showing the distribution of CD20, CD4, and CD8 T cells in representative tonsil and HIV and HIV+ LNs (more than four samples were analyzed per group) and cART HIV+ LNs (three donors were analyzed). The green dashed lines indicate the GCs. Zoomed images of the highlighted area (white square) from a representative HIV+ LN, with or without treatment, show the presence of CD8 T cells within the GC (right panel). (B) Representative example of histo-cytometric analysis of an HIV+ LN (HIV+ #19). The gating scheme for the detection of particular populations is shown (left panel). The whole imaged area (position X, Y plot) and the position of three particular GCs (defined as CD20hiKi67hi) are shown (right panel). The relative frequency of CD4 and CD8 T cells within the individual and combined (GC1, 2, 3) GCs is shown (lower panel). (C) Pooled data of the CD4 and CD8 T cell frequencies within the GCs from HIV (n = 3), viremic HIV+ (n = 4), and cART-treated HIV+ (n = 3) LNs. Different symbols (circle, square, triangle, or diamond) represent different donors, whereas each dot represents a different GC. Results show the CD4/CD8 T cell ratio within GCs (left panel) and the CD4 (middle panel) and CD8 (right panel) T cell frequencies normalized by the GC area. The Mann-Whitney U test was used for analysis; *P < 0.05, **P < 0.001, ***P < 0.0001.
Fig. 3
Fig. 3. No direct association between viral antigens and fCD8
(A) Average copy number per cell of gag, rev, and tat RNA in sorted CD4+PD-1dim pre-TFH and CD4+PD-1high TFH cells from viremic (n = 4) and long-term cART-treated donors (n = 4). Each color represents a different donor. Mann-Whitney U test, *P < 0.05. (B) HIV gag DNA copies in sorted TFH CD4 T cells from viremic (n = 4) and long-term cART (n = 4) LNs and the frequency of the corresponding fCD8 are shown. (C) Relationship between the frequency of fCD8 and the average copy number per TFH cell of gag, rev, and tat RNA. (D) Representative confocal images (20×) showing the p24 antigen distribution in follicles from HIV, HIV+, and long-term cART LNs. Follicular areas were defined by IgD and CD20 expression. Zoomed areas showing the distribution of p24+ cells within the GCs (IgDloCD20hi) are also shown. The distribution of CD8 T cells and p24+ cells in the follicles is shown in the lower panels.
Fig. 4
Fig. 4. Local immune activation is a driving force for fCD8 T cell dynamics
(A) Frequency of gag-specific non-fCD8 and fCD8 T cells producing cytokines [interferon-γ (IFN-γ) and/or tumor necrosis factor–α (TNF-α) and/or macrophage inflammatory protein 1β (MIP-1β)] from HIV+ (n = 6) and long-term cART (n = 6) LNs. (B) Representative confocal images (20×) showing CD163+ monocyte infiltration and tissue activation [myeloperoxidase (MPO)] in HIV, HIV+, and long-term cART LNs. Two representative B cell follicle areas from each tissue are shown. (C) Representative confocal images (40×) showing CD8 and CXCL13 distribution in HIV-infected LN with or without treatment. A follicular area and a zoomed area within each B cell follicle (white squares) are shown. (D) Correlation between the frequency (expressed as the LN area covered by CD8) of CD8 T cells within the LN and the amount of fibrosis (expressed as the LN area covered by collagen 1) in LNs from HIV-infected donors (three viremic, five short-term cART, and three long-term cART). (E) Network pathways and related genes analysis between non-fCD8 and fCD8 T cells generated by cytoscape software. Gene transcripts highlighted in red occurred at higher levels in fCD8 cells, and those in green occurred at higher levels in non-fCD8 cells. Specific genes or pathways mentioned in Results are highlighted with arrows.
Fig. 5
Fig. 5. Expression of inhibitor receptors in fCD8 T cells
(A) Relative frequency of IFN-γ–, TNF-α–, and MIP-1β–producing fCD8 T cells from tonsils (n = 6), HIV LNs (n = 4), HIV+ viremic LNs (n = 5), and short-term (n = 4, blue dots) and long-term (n = 4, yellow dots) cART-treated LNs. Results are expressed as frequency of the parental fCD8 (CCR7loCXCR5hi) population. Mann-Whitney U test [shown; *P < 0.05, **P < 0.001 or ANOVA (P = 0.0006, P = 0.0005, and P = 0.0023 for IFN-γ, TNF-α, and MIP-1β, respectively)] tests were used for the analysis. (B) Simplified Presentation of Incredibly Complex Evaluations (SPICE) plots illustrating the functionality of fCD8 T cells. Each slice of the pie represents the fraction of the total response of CD8 T cells positive for a given number of cytokines (IFN-γ, TNF-α, and MIP-1β) produced, *P < 0.05. (C) Relative frequency of PD-1 expression among naïve CD8 (CD27hiCD45ROlo), non-fCD8 (CCR7hiCXCR5lo), fCD8 (CCR7loCXCR5hi), and CD4 TFH (PD-1hiCXCR5hi) T cells, Wilcoxon signed-rank test; *P < 0.05. ANOVA nonparametric test P < 0.0001. (D) Pooled data showing the frequency of total memory CD8 T cells producing cytokines (IFN-γ and/or TNF-α and/or IL-2) after a 5-day stimulation in the absence or presence of anti–PD-L1. Triangles, anti-CD3 (0.1 μg/ml); circles, anti-CD3 (0.5 μg/ml). Wilcoxon signed-rank test; *P < 0.05. ANOVA (Friedman test); P < 0.001. (E) Frequency of the PD-1 and TIGIT expression in non-fCD8 and fCD8 T cells from viremic LNs, Wilcoxon signed-rank test; *P < 0.05. (F) SPICE plots showing the coexpression of five different co-inhibitory receptors (PD-1, TIM3, TIGIT, CD160, and 2B4) in naïve, non-fCD8, and fCD8 from viremic (n = 5) and long-term cART-treated (n = 4) LNs. Arcs show the contribution of each different co-inhibitory receptor to the expression patterns. *P < 0.05, **P < 0.001.
Fig. 6
Fig. 6. fCD8 T cells exhibit potent cytolytic ability
(A) Frequency of CCR7hiCXCR5lo and CCR7loCXCR5hi CD8 T cells from HIV+ LNs (n = 5) expressing ex vivo GrzB or Prf. Mann-Whitney U test; *P < 0.05. (B) Frequency of fCD8 T cells co-expressing GrzB and Prf ex vivo. Results are shown as frequency of the parental fCD8 (CCR7loCXCR5hi) population, Mann-Whitney U test (shown; *P < 0.05), ANOVA (P = 0.0017) (blue dots, short-term cART; yellow dots, long-term cART). (C) Frequency of fCD8 T cells expressing GrzB or de novo synthesized Prf among the different tissues after short stimulation with aCD3/CD28. Results are shown as frequency of fCD8 T cells. Mann-Whitney U test (shown; *P < 0.05), ANOVA (P = 0.0018 and P = 0.0012 for GrzB and Prf, respectively). (D) Representative confocal images (63×) showing fCD8 T cells from a viremic HIV+ LN (GC area) expressing GrzB. Individual staining as well as merged (CD8/GrzB and CD20/CD8/GrzB/Jojo) images are shown. (E) The ratio of GrzB+CD8/CD8 in GCs and nonfollicular areas calculated by flow cytometry or imaging analysis from viremic LNs (n = 3) is shown, Mann-Whitney U test; *P < 0.05.
Fig. 7
Fig. 7. fCD8 T cells mediate potent killing of HIV-infected cells via bispecific antibodies
(A) Bispecific antibody–mediated killing activity of HIV-infected cells using an isotype antibody fragment (open bars) or the broadly neutralizing VRC07 anti-env antibody fragment (black bars) with an anti-CD3 fragment, Mann-Whitney U test; ***P < 0.001. (B) Accumulated data showing the bispecific antibody–mediated killing activity of sorted naïve CD8 (CD27hiCD45ROlo), non-fCD8 (CCR7hiCXCR5lo), and fCD8 (CCR7loCXCR5hi) from tonsils (n = 5), viremic HIV+ (n = 5) LNs, and long-term cART-treated HIV+ LNs (n = 2, yellow dots). HIV+ targets and sorted CD8 T cells were cocultured for 8 hours in the presence of the bispecific antibody, Mann-Whitney U test; *P < 0.05. (C) The concentration of sFasL, GrzB, and Prf in supernatants from the bispecific antibody–mediated killing assays after 8 hours (black bars) or 19 hours (gray bars) of incubation is shown. (D) Inhibition of the bispecific antibody–mediated killing activity by the pan-caspase inhibitor Z-VAD in a 19-hour in vitro killing assay. Sorted cells from six tonsils were used, Mann-Whitney U test; *P < 0.05. (E) Sorted primary memory CD4 T cells from HIV PBMCs (n = 2) or (F) TFH cells from HIV tonsils (n = 3) were infected in vitro, and the killing [judged by the frequency of GFP+ cells (left panel) or the expression of death markers-aqua, annexin V (right panel)] of cells bearing virus (GFP+) by autologous memory CD8 T cells after coculture (8 hours) in the absence or presence of bispecific antibodies is shown. Different symbols (circle, square, or diamond) represent different donors. Mann-Whitney U test (*P < 0.05). (G) Sorted TFH cells from viremic LNs (n = 2) were stimulated in vitro (anti-CD3), and the virus production (judged by the HIV gag-RNA copies) in the presence of autologous fCD8 T cells (with or without bispecific antibodies) is shown after 48 hours of coculture.

References

    1. Connick E, Mattila T, Folkvord JM, Schlichtemeier R, Meditz AL, Ray MG, McCarter MD, MaWhinney S, Hage A, White C, Skinner PJ. CTL fail to accumulate at sites of HIV-1 replication in lymphoid tissue. J Immunol. 2007;178:6975–6983. - PubMed
    1. Embretson J, Zupancic M, Ribas JL, Burke A, Racz P, Tenner-Racz K, Haase AT. Massive covert infection of helper T lymphocytes and macrophages by HIV during the incubation period of AIDS. Nature. 1993;362:359–362. - PubMed
    1. Folkvord JM, Armon C, Connick E. Lymphoid follicles are sites of heightened human immunodeficiency virus type 1 (HIV-1) replication and reduced antiretroviral effector mechanisms. AIDS Res Hum Retroviruses. 2005;21:363–370. - PubMed
    1. Gratton S, Cheynier R, Dumaurier MJ, Oksenhendler E, Wain-Hobson S. Highly restricted spread of HIV-1 and multiply infected cells within splenic germinal centers. Proc Natl Acad Sci USA. 2000;97:14566–14571. - PMC - PubMed
    1. Hufert FT, van Lunzen J, Janossy G, Bertram S, Schmitz J, Haller O, Racz P, von Laer D. Germinal centre CD4+ T cells are an important site of HIV replication in vivo. AIDS. 1997;11:849–857. - PubMed

Publication types