Effectiveness of computed tomography attenuation values in characterization of pericardial effusion
- PMID: 28100899
- PMCID: PMC5469113
- DOI: 10.14744/AnatolJCardiol.2016.7353
Effectiveness of computed tomography attenuation values in characterization of pericardial effusion
Abstract
Objective: The aim of this study was to evaluate the effectiveness of computed tomography (CT) attenuation values in the characterization of pericardial effusion.
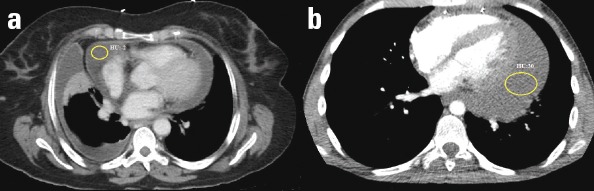
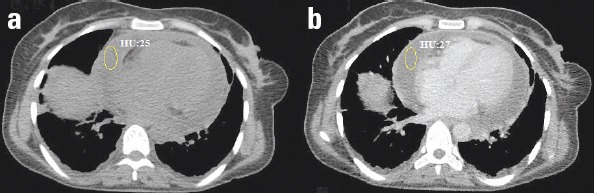
Methods: This study consisted of 96 patients with pericardial effusion who underwent pericardiocentesis. For further diagnostic evaluation of pericardial effusion, all the patients were assessed by thorax CT. CT attenuation values were measured from at least 5 different areas of pericardial fluid by specifying the largest region of interest. The average of these measurements was computed and considered as the CT attenuation value of the patient. The patients were classified into two groups: patients with transudative pericardial effusion and those with exudative pericardial effusion.
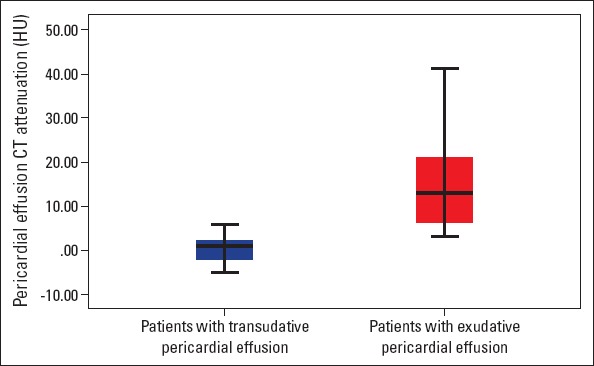
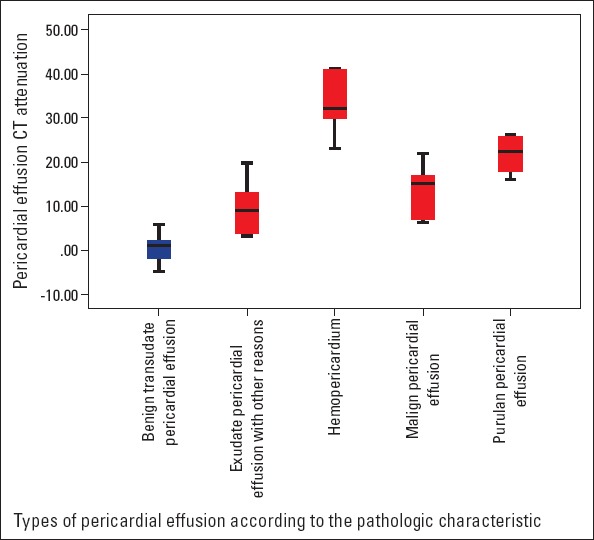
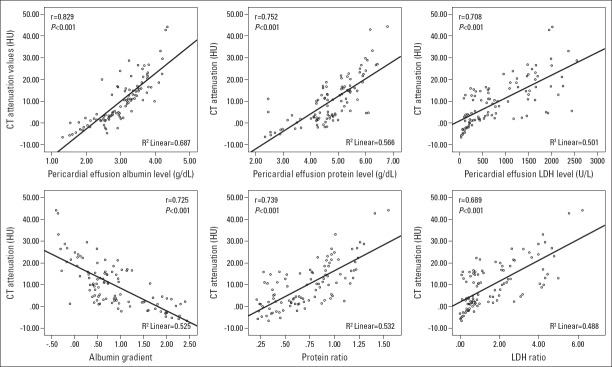
Results: CT attenuation values were significantly higher in patients with exudative pericardial effusion than in those with transudative pericardial effusion [14.85±10.7 Hounsfield unit (HU) vs. 1.13±4.3 HU, p<0.001]. CT attenuation values had a close correlation with the pericardial fluid albumin (r=0.829), protein (r=0.752), and LDH (r=0.708) levels; WBC count (r=0.564); protein ratio (r=0.739); and LDH ratio (r=0.689) as well as the albumin gradient (r=-0.725). A cut-off value of 4.7 HU had 80% sensitivity and 87.7% specificity for the identification of exudative pericardial effusion. In addition, a cut-off value of 6.5 HU had 71.4% sensitivity and 72.3% specificity for the prediction of cardiac tamponade.
Conclusion: In patients with pericardial effusion, CT attenuation values seem to be correlated with the characterization parameters of the fluid and may distinguish exudative pericardial effusion from transudative pericardial effusion. This parameter was also found to be a predictor of cardiac tamponade. CT attenuation values can be a useful tool in the clinical evaluation of patients with pericardial effusion.
Conflict of interest statement
Figures
Similar articles
-
Impact of pericardial fluid glucose level and computed tomography attenuation values on diagnosis of malignancy-related pericardial effusion.BMC Cardiovasc Disord. 2021 Jun 3;21(1):272. doi: 10.1186/s12872-021-02091-6. BMC Cardiovasc Disord. 2021. PMID: 34082695 Free PMC article.
-
Computed tomography values of pericardial effusion may predict chylopericardium: a case report.BMC Cardiovasc Disord. 2023 Feb 10;23(1):79. doi: 10.1186/s12872-023-03112-2. BMC Cardiovasc Disord. 2023. PMID: 36765291 Free PMC article.
-
The role of early contrast-enhanced chest computed tomography in the aetiological diagnosis of patients presenting with cardiac tamponade or large pericardial effusion.Eur Heart J Cardiovasc Imaging. 2016 Apr;17(4):421-8. doi: 10.1093/ehjci/jev225. Epub 2015 Sep 15. Eur Heart J Cardiovasc Imaging. 2016. PMID: 26377905
-
Pericardial Effusion.Cardiol Clin. 2017 Nov;35(4):515-524. doi: 10.1016/j.ccl.2017.07.005. Cardiol Clin. 2017. PMID: 29025543 Review.
-
Malignant pericardial effusion with cardiac tamponade in a patient with metastatic vaginal adenocarcinoma.Int J Gynecol Cancer. 2006 May-Jun;16(3):1458-61. doi: 10.1111/j.1525-1438.2006.00584.x. Int J Gynecol Cancer. 2006. PMID: 16803549 Review.
Cited by
-
Post-myocardial Infarction Left Ventricular Aneurysm With Contained Rupture and Hemopericardium.Cureus. 2024 Mar 19;16(3):e56506. doi: 10.7759/cureus.56506. eCollection 2024 Mar. Cureus. 2024. PMID: 38646285 Free PMC article.
-
Suspected contained rupture of a coronary artery aneurysm followed by a re-rupture: a case report.Eur Heart J Case Rep. 2024 Oct 24;8(11):ytae575. doi: 10.1093/ehjcr/ytae575. eCollection 2024 Nov. Eur Heart J Case Rep. 2024. PMID: 39545162 Free PMC article.
-
CT-Based Pericardial Composition Change as an Imaging Biomarker for Radiation-Induced Cardiotoxicity.Cancers (Basel). 2025 Aug 13;17(16):2635. doi: 10.3390/cancers17162635. Cancers (Basel). 2025. PMID: 40867264 Free PMC article.
-
Higher enhanced computed tomography attenuation value of the aorta is a predictor of massive transfusion in blunt trauma patients.Clin Exp Emerg Med. 2019 Dec;6(4):330-339. doi: 10.15441/ceem.18.090. Epub 2019 Dec 31. Clin Exp Emerg Med. 2019. PMID: 31910504 Free PMC article.
-
Cardiac computed tomography in cardio-oncology: an update on recent clinical applications.Eur Heart J Cardiovasc Imaging. 2021 Mar 22;22(4):397-405. doi: 10.1093/ehjci/jeaa351. Eur Heart J Cardiovasc Imaging. 2021. PMID: 33555007 Free PMC article. Review.
References
-
- Sagristà-Sauleda J, Mercé J, Permanyer-Miralda G, Soler-Soler J. Clinical clues to the causes of large pericardial effusions. Am J Med. 2000;109:95–101. - PubMed
-
- Corey GR, Campbell PT, Van Trigt P, Kenney RT, O'Connor CM, Sheikh KH, et al. Etiology of large pericardial effusions. Am J Med. 1993;95:209–13. - PubMed
-
- Levy PY, Corey R, Berger P, Habib G, Bonnet JL, Levy S, et al. Etiologic diagnosis of 204 pericardial effusions. Medicine (Baltimore) 2003;82:385–91. - PubMed
-
- Permanyer-Miralda G, Sagristá-Sauleda J, Soler-Soler J. Primary acute pericardial disease: a prospective series of 231 consecutive patients. Am J Cardiol. 1985;56:623–30. - PubMed
-
- Tsang TS, Enriquez-Sarano M, Freeman WK, Barnes ME, Sinak LJ, Gersh BJ, et al. Consecutive 1127 therapeutic echocardiographically guided pericardiocenteses: clinical profile, practice patterns, and outcomes spanning 21 years. Mayo Clin Proc. 2002;77:429–36. - PubMed
Publication types
MeSH terms
LinkOut - more resources
Full Text Sources
Other Literature Sources
Medical