. 2017 Jan 4:7:1998.
doi: 10.3389/fpls.2016.01998. eCollection 2016.

New Candidate Genes Affecting Rice Grain Appearance and Milling Quality Detected by Genome-Wide and Gene-Based Association Analyses

Affiliations

New Candidate Genes Affecting Rice Grain Appearance and Milling Quality Detected by Genome-Wide and Gene-Based Association Analyses

Xiaoqian Wang et al. Front Plant Sci. .

Abstract

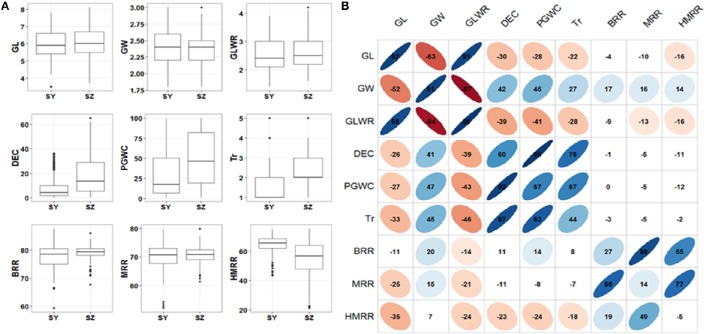
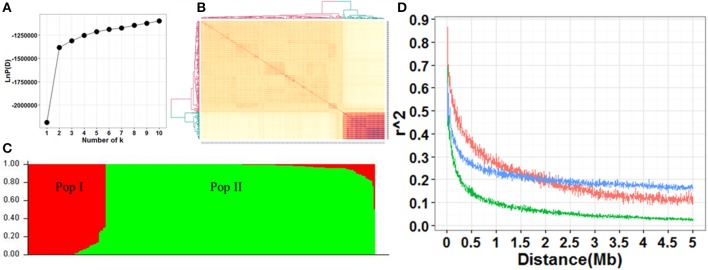
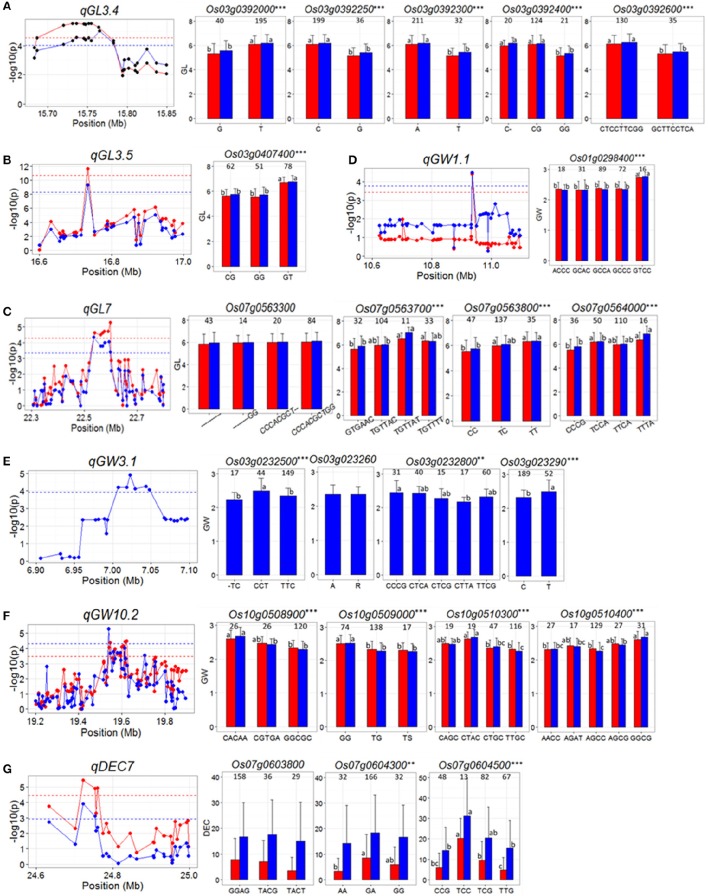
Appearance and milling quality are two crucial properties of rice grains affecting its market acceptability. Understanding the genetic base of rice grain quality could considerably improve the high quality breeding. Here, we carried out an association analysis to identify QTL affecting nine rice grain appearance and milling quality traits using a diverse panel of 258 accessions selected from 3K Rice Genome Project and evaluated in two environments Sanya and Shenzhen. Genome-wide association analyses using 22,488 high quality SNPs identified 72 QTL affecting the nine traits. Combined gene-based association and haplotype analyses plus functional annotation allowed us to shortlist 19 candidate genes for seven important QTL regions affecting the grain quality traits, including two cloned genes (GS3 and TUD), two fine mapped QTL (qGRL7.1 and qPGWC7) and three newly identified QTL (qGL3.4, qGW1.1, and qGW10.2). The most likely candidate gene(s) for each important QTL were also discussed. This research demonstrated the superior power to shortlist candidate genes affecting complex phenotypes by the strategy of combined GWAS, gene-based association and haplotype analyses. The identified candidate genes provided valuable sources for future functional characterization and genetic improvement of rice appearance and milling quality.

Keywords: GWAS; chalkiness; gene-based association analysis; grain shape; milling; rice.


Figures

Figure 1
Figure 1
(A) Box plots of nine rice grain appearance and milling quality traits in two environments. SY, Sanya; SZ, Shenzhen; GL, Grain length; GW, Grain width; GLWR, Grain length to width ratio; DEC, Degree of endosperm chalkiness; PGWC, Percentage of grains with chalkiness; Tr, Transparency; BRR, Brown rice rate; MRR, Milled rice rate; HMRR, Head milled rice rate. (B) Correlations between nine evaluated traits in SY (upper triangular) and SZ (lower triangular). The values on principal diagonal indicated correlations between SY and SZ. The values were correlation coefficients (r) multiplied by 100. The areas and colors of ellipses showed the absolute value of corresponding r. Right and left oblique ellipses indicated positive and negative correlations, respectively. The values without glyphs indicated insignificant at 0.05.
Figure 2
Figure 2
(A) Screen plot from STRUCTURE showing the selection of Q for association study. (B) Heat map of kinship from TASSEL with the tree shown on the top and left. (C) Bayesian clustering of 258 accessions using STRUCTURE program. (D) Comparison of LD decay in the whole and two sub-populations. Y axis was the average r2 value of each 5 kb region and X axis was physical distance between markers in unit of Mb. The blue, red and green indicated LD decay in the populations whole, Ppo I and Pop II, respectively.
Figure 3
Figure 3
(A–G) Gene-based association analysis of seven important QTL loci and haplotypes analysis of targeted genes of related QTL including qGL3.4 (A), qGL3.5 (B) qGL7 (C), qGW1.1 (D), qGW3.1 (E), qGW10.2 (F), and qDEC7 (G). Each point was a gene indicated by one of its SNPs having largest LD (r2) value with the peak SNP of the QTL. Dash line showed the threshold to determine significant SNP. The ** and *** suggested significance of ANOVA at p < 0.01 and p < 0.001, respectively. The letter on histogram (a, b, and c) indicated multiple comparisons result at the significant level 0.01. The value on the histogram was the number of individuals of each haplotype. Red and blue color indicated SY and SZ environments, respectively.

Similar articles

Cited by

References

    1. 3K RGP (2014). The 3,000 rice genomes project. Gigascience 3:7. 10.1186/2047-217X-3-7 - DOI - PMC - PubMed
    1. Alexandrov N., Tai S., Wang W., Mansueto L., Palis K., Fuentes R. R., et al. . (2015). SNP-Seek database of SNPs derived from 3000 rice genomes. Nucleic Acids Res. 43, D1023–D1027. 10.1093/nar/gku1039 - DOI - PMC - PubMed
    1. Bai X., Luo L., Yan W., Kovi M. R., Zhan W., Xing Y. (2010). Genetic dissection of rice grain shape using a recombinant inbred line population derived from two contrasting parents and fine mapping a pleiotropic quantitative trait locus qGL7. BMC Genet. 11:16. 10.1186/1471-2156-11-16 - DOI - PMC - PubMed
    1. Bradbury P. J., Zhang Z., Kroon D. E., Casstevens T. M., Ramdoss Y., Buckler E. S. (2007). TASSEL: software for association mapping of complex traits in diverse samples. Bioinformatics 23, 2633–2635. 10.1093/bioinformatics/btm308 - DOI - PubMed
    1. Chen H. M., Zhao Z. G., Jiang L., Wan X. Y., Liu L. L., Wu X. J., et al. (2011). Molecular genetic analysis on percentage of grains with chalkiness in rice (Oryza sativa L.). Afr. J. Biotechnol. 10, 6891–6903. 10.5897/AJB11.208 - DOI