. 2016 Dec 13;8(1):243-259.
doi: 10.1364/BOE.8.000243. eCollection 2017 Jan 1.

Endoscopic sensing of alveolar pH

Affiliations

Endoscopic sensing of alveolar pH

D Choudhury et al. Biomed Opt Express. .

Abstract

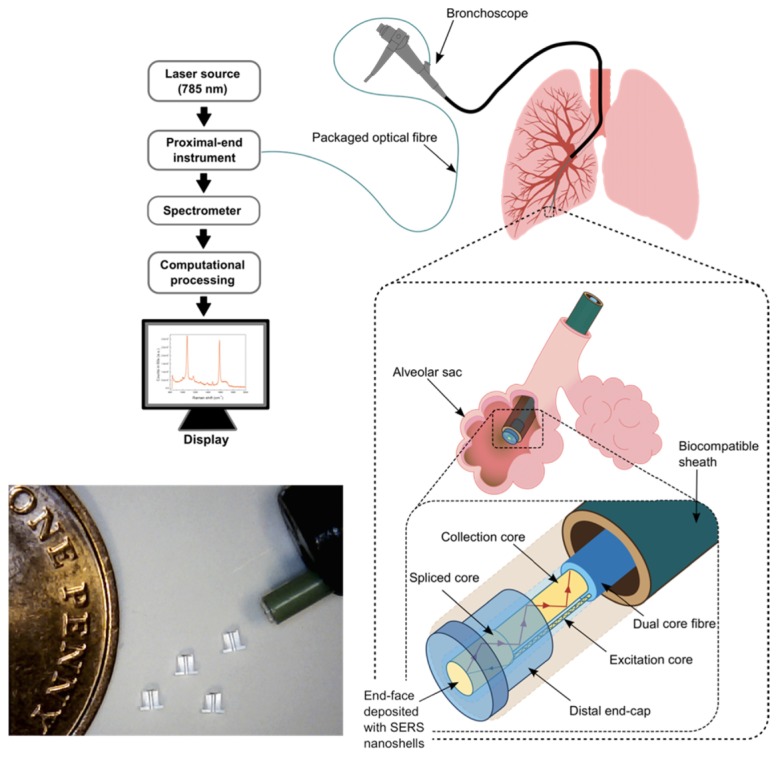
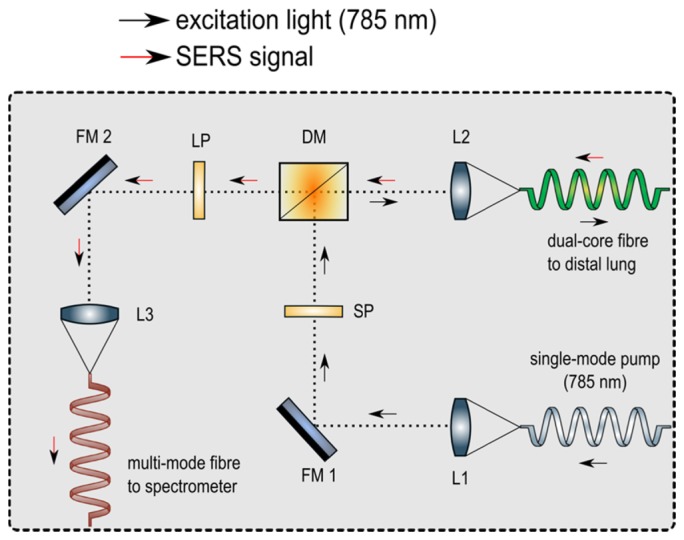
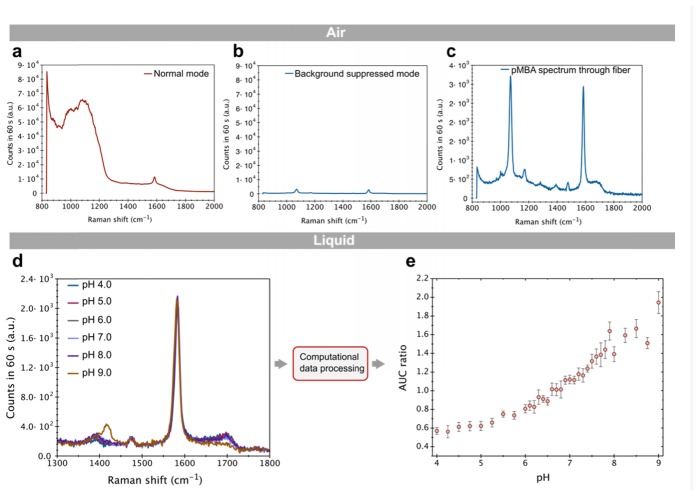
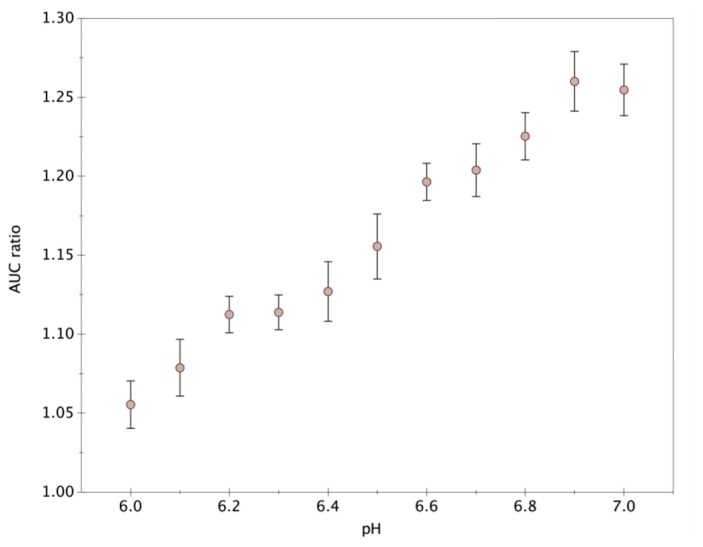
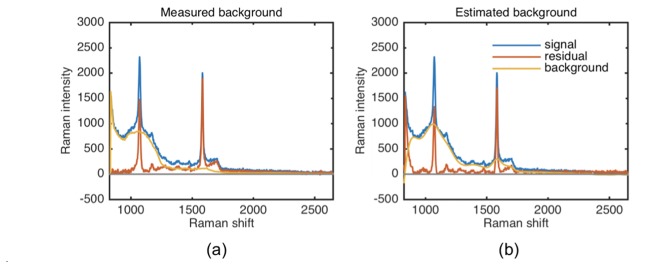
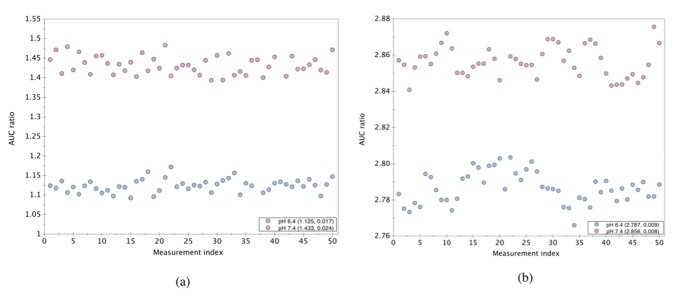
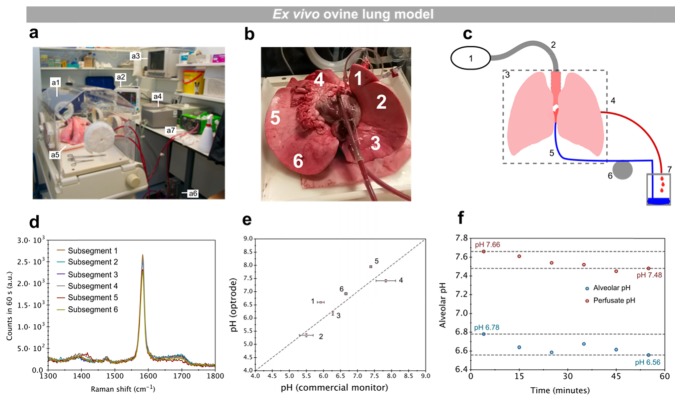
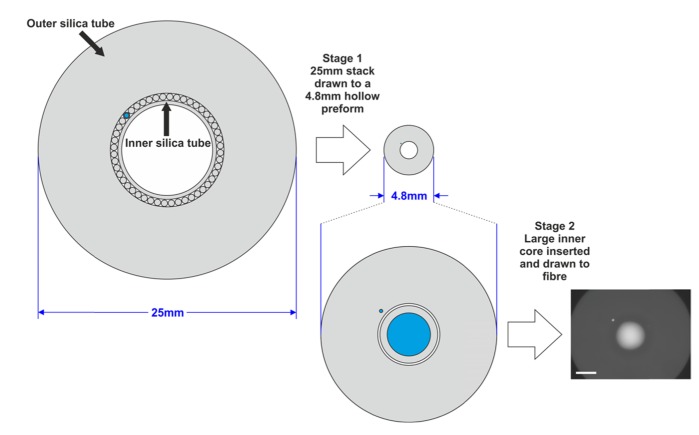
Previously unobtainable measurements of alveolar pH were obtained using an endoscope-deployable optrode. The pH sensing was achieved using functionalized gold nanoshell sensors and surface enhanced Raman spectroscopy (SERS). The optrode consisted of an asymmetric dual-core optical fiber designed for spatially separating the optical pump delivery and signal collection, in order to circumvent the unwanted Raman signal generated within the fiber. Using this approach, we demonstrate a ~100-fold increase in SERS signal-to-fiber background ratio, and demonstrate multiple site pH sensing with a measurement accuracy of ± 0.07 pH units in the respiratory acini of an ex vivo ovine lung model. We also demonstrate that alveolar pH changes in response to ventilation.

Keywords: (170.4580) Optical diagnostics for medicine; (170.6510) Spectroscopy, tissue diagnostics.


Figures

Fig. 1
Fig. 1
Schematic illustration of the fiber-optic sensing system and the miniaturized optrode for measuring alveolar pH. The packaged miniaturized optrode consisted of a 3 m long custom fabricated asymmetric dual-core optical fiber (outer diameter: 125 μm) and a bespoke distal end cap (outer diameter: 1.2 mm), assembled within a biocompatible tube (PEEK, outer diameter 1.5 mm). The fiber consists of a 2 μm diameter graded-index pump core (single mode at 785 nm) and a 28 μm diameter graded-index collection core that is multi-mode at the pump and signal wavelengths. The optrode was constructed by fusion splicing a short (~1 mm) section of a commercial multi-mode fiber (core diameter 50 μm, outer diameter 125 μm) onto the dual-core fiber. The end-face of the optrode was deposited with Au nanoshells functionalized with p-MBA as the pH sensing reporter molecule. The fiber-optic optrode was navigated through the working channel of a standard bronchoscope into the alveolar space of an ex vivo ovine lung model. A proximal end optical instrument (see Fig. 2) was built to collect and direct the SERS spectra encoding the pH information to a spectrometer. Post-acquisition, the data was processed using machine-learning algorithms to predict the unknown pH in the distal lung. Inset photograph: The packaged optrode emerging from the accessory channel of a bronchoscope. 4 distal end-caps are also shown alongside a one-penny coin.
Fig. 2
Fig. 2
A proximal-end optical instrument was used to input couple the excitation light into the SM core of the dual-core fiber and output couple the Raman-shifted signal light to the spectrometer. A continuous-wave 785 nm laser source (Thorlabs) with linewidth <0.1 nm was used as the pump source for this experiment. The 785 nm mode from a SM fiber (Thorlabs, 780-HP) was imaged at unit magnification using aspheric lenses (L1 & L2) onto the SM excitation core at the proximal end of the dual-core fiber. The SERS signal light from the MM core of the optrode was collected using lens L2 and, after passing through a long pass dichroic (DM), was imaged with unit magnification using the lens L3 and a fold mirror (FM 2) onto the step-index 50 μm core of a MM patch-cable which was attached to a spectrometer (Ocean Optics, QE Pro - 50 μm slit). In this background-suppressed mode, light in the SM core is explicitly excluded from being collected and routed to the spectrometer. Adjustment of fiber alignment allowed the instrument to be switched between background suppressed, and a more conventional non-suppressed mode, in which the same multi-mode core could be used for both excitation and collection. A short-pass filter (SP) was placed in the pump path before the dichroic to prevent the SERS signal being contaminated by long wavelength amplified spontaneous emission from the laser source. A long-pass filter (LP) was placed in the signal path to prevent 785 nm light from being coupled into the spectrometer. The spectral resolution was limited by the spectrometer to ~0.4 nm, narrower than the observed SERS spectral features (see Fig. 3(c)).
Fig. 3
Fig. 3
Background suppressed p-MBA SERS spectrum and its characteristics with respect to change in pH, observed using the packaged fiber-optic optrode. (a) p-MBA SERS spectrum acquired between 800 cm−1 and 2000 cm−1 when the MM core was used for both excitation and collection (normal mode). (b) p-MBA SERS spectrum acquired between 800 cm−1 and 2000 cm−1 when the SM and MM cores were used for excitation and collection respectively (background suppressed mode). Suppression of the fiber Raman background by ~100-fold was achieved in comparison to the spectrum shown in (a). (c) Characteristic p-MBA SERS spectrum acquired using the fiber-optic optrode. (d) p-MBA SERS spectrum from 1300 cm−1 to 1800 cm−1 showing pH sensitive response in the vicinity of 1380 cm−1 and 1700 cm−1. (e) Variation of the area under the curve (AUC) ratio with respect to pH in the range 4.0 – 9.0 obtained after computational data processing (see Section 3.1.1). The error bars represent the standard error of the mean over five technical replicate measurements, acquired over measurement intervals up to 9 hours. The extended time intervals between replicate measurements increase the extent of error bars. The intrinsic accuracy of the SERS measurements is analyzed separately (see Section 3.1.3).
Fig. 4
Fig. 4
Variation of area under the curve (AUC) ratio as a function of pH within the pH 6.0 – 7.0 range. The error bars represent the standard error of the mean over five technical replicate measurements, acquired over measurement intervals up to 4 hours.
Fig. 5
Fig. 5
Typical shape of p-MBA SERS, background and residual spectra acquired using the fiber optic optrode. The residual spectra were obtained using (a) a measured background spectrum and (b) background estimated using adaptive iterative reweighed penalized least squares, (airPLS). The measured background is subtracted by estimating its strength using airPLS by keeping the background(b)fixed and learning the coefficient(cbi). We observe that although the measured background exhibits a lower envelope of a typical p-MBA SERS spectrum (obtained through the fiber) at Raman shifts lower than 1200 cm−1, it is not so at shifts higher than 1200 cm−1.
Fig. 6
Fig. 6
The area under the curve (AUC) ratio obtained at pH 6.4 and 7.4 plotted against time over 50 consecutive replicate measurements (a) with background suppression (b) without background suppression. The numbers in the insets represent the mean and standard deviation of the data for each pH respectively.
Fig. 7
Fig. 7
Alveolar space pH measured using the fiber-optic optrode in an ex vivo ovine lung model. (a) Photograph of the ex vivo ovine lung perfusion and ventilation set-up used for the experiment. a1: Incubator a2: Physiology monitor a3: Bronchoscopy screen a4: Ventilator and closed breathing circuit a5: Ventilated ovine lung a6: Water bath and perfusate circuit a7: Roller pump. (b) Photograph of the ex vivo ovine lung with numbers representing the six subsegments interrogated using the fiber-optic probe (c) Illustration showing the perfusion and ventilation circuits used in the experiment. 1: Ventilator, 2: Breathing circuit, 3: Incubator and humidifier, 4: Left atrial cannula, 5: Pulmonary artery cannula, 6: Roller pump, 7: Reservoir (d) p-MBA spectrum between 1300 cm−1 and 1800 cm−1, obtained from the sequential interrogation of the six distal subsegments shown in (b). (e) The alveolar pH measured using the fiber-optic optrode for the six subsegments (y-axis). The x-axis represents the pH measured using the commercial pH monitor at the incised locations for each subsegment. The numbers indicate the order in which the instilled subsegments were interrogated using the fiber-optic optrode. (f) Alveolar pH variation as a function of time in an ex vivo ovine lung model with ceased ventilation (t = 0) measured using the fiber-optic optrode. The variation of perfusate pH with time measured using a commercial pH probe is also shown.
Fig. 8
Fig. 8
Fabrication stages of the dual core fiber. Stage one, the formation of the stack to include the small excitation core. Pure silica rods (shown in grey) are stacked between two nested pure silica tubes, except that one of the rods contains a Ge-doped core (shown in blue) to form the small excitation core in the final fiber. Stage two, formation of the large collection core. A large rod with a Ge-doped core was inserted into the hollow preform drawn from the stack, then drawn down to form the final fiber. An optical micrograph of a transverse cross-section of the fiber is shown in the bottom right corner. The high-index core regions appear lighter in the image, with the small excitation core visible at “11 o'clock”. The scale bar is 20 µm.

References

    1. Ng A. W., Bidani A., Heming T. A., “Innate Host Defense of the Lung: Effects of Lung-Lining Fluid pH,” Lung 182(5), 297–317 (2004).10.1007/s00408-004-2511-6 - DOI - PubMed
    1. Bodem C. R., Lampton L. M., Miller D. P., Tarka E. F., Everett E. D., “Endobronchial pH. Relevance of aminoglycoside activity in gram-negative bacillary pneumonia,” Am. Rev. Respir. Dis. 127(1), 39–41 (1983).10.1164/arrd.1983.127.1.39 - DOI - PubMed
    1. Pezzulo A. A., Tang X. X., Hoegger M. J., Abou Alaiwa M. H., Ramachandran S., Moninger T. O., Karp P. H., Wohlford-Lenane C. L., Haagsman H. P., van Eijk M., Bánfi B., Horswill A. R., Stoltz D. A., McCray P. B., Jr, Welsh M. J., Zabner J., “Reduced airway surface pH impairs bacterial killing in the porcine cystic fibrosis lung,” Nature 487(7405), 109–113 (2012).10.1038/nature11130 - DOI - PMC - PubMed
    1. Jayaraman S., Song Y., Verkman A. S., “Airway surface liquid pH in well-differentiated airway epithelial cell cultures and mouse trachea,” Am. J. Physiol. Cell Physiol. 281(5), C1504–C1511 (2001). - PubMed
    1. Nielson D. W., Goerke J., Clements J. A., “Alveolar subphase pH in the lungs of anesthetized rabbits,” Proc. Natl. Acad. Sci. U.S.A. 78(11), 7119–7123 (1981).10.1073/pnas.78.11.7119 - DOI - PMC - PubMed