

Posterior rat eye during acute intraocular pressure elevation studied using polarization sensitive optical coherence tomography
- PMID: 28101419
- PMCID: PMC5231300
- DOI: 10.1364/BOE.8.000298
Posterior rat eye during acute intraocular pressure elevation studied using polarization sensitive optical coherence tomography
Abstract
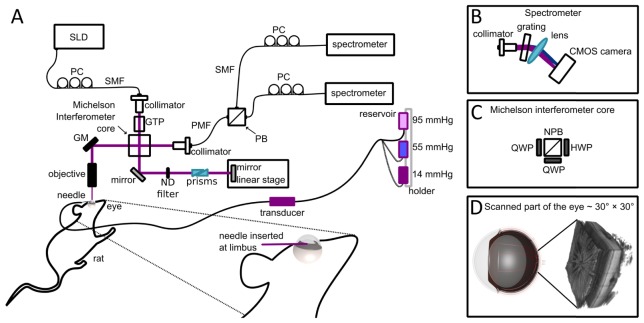
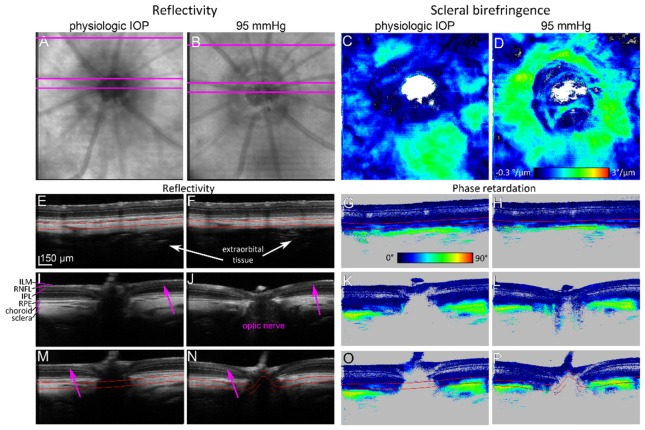
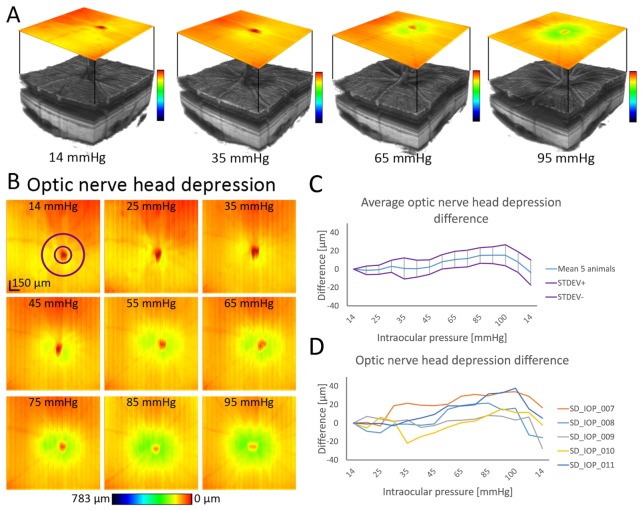
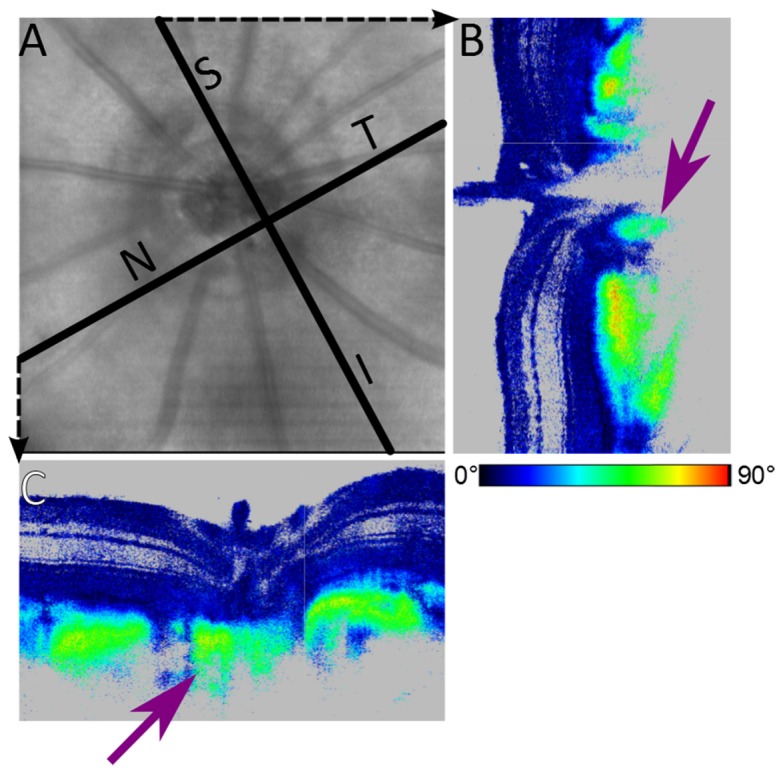
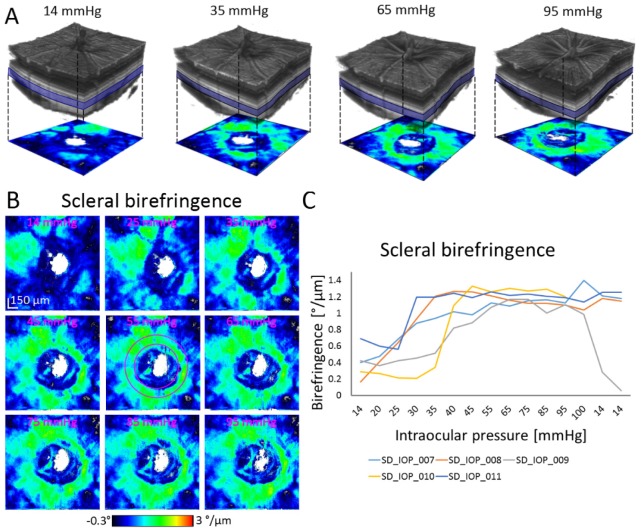
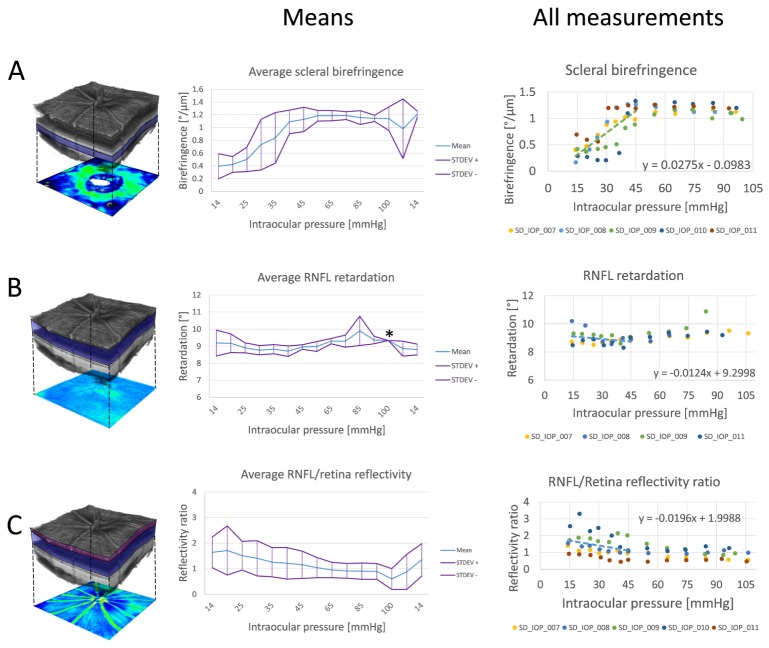
Polarization sensitive optical coherence tomography (PS-OCT) operating at 840 nm with axial resolution of 3.8 µm in tissue was used for investigating the posterior rat eye during an acute intraocular pressure (IOP) increase experiment. IOP was elevated in the eyes of anesthetized Sprague Dawley rats by cannulation of the anterior chamber. Three dimensional PS-OCT data sets were acquired at IOP levels between 14 mmHg and 105 mmHg. Maps of scleral birefringence, retinal nerve fiber layer (RNFL) retardation and relative RNFL/retina reflectivity were generated in the peripapillary area and quantitatively analyzed. All investigated parameters showed a substantial correlation with IOP. In the low IOP range of 14-45 mmHg only scleral birefringence showed statistically significant correlation. The polarization changes observed in the PS-OCT imaging study presented in this work suggest that birefringence of the sclera may be a promising IOP-related parameter to investigate.
Keywords: (110.4500) Optical coherence tomography; (130.5440) Polarization-selective devices; (170.3880) Medical and biological imaging; (170.5755) Retina scanning.
Figures
Similar articles
-
Peripapillary rat sclera investigated in vivo with polarization-sensitive optical coherence tomography.Invest Ophthalmol Vis Sci. 2014 Oct 28;55(11):7686-96. doi: 10.1167/iovs.14-15037. Invest Ophthalmol Vis Sci. 2014. PMID: 25352116
-
Deformation of the rodent optic nerve head and peripapillary structures during acute intraocular pressure elevation.Invest Ophthalmol Vis Sci. 2011 Aug 22;52(9):6651-61. doi: 10.1167/iovs.11-7578. Invest Ophthalmol Vis Sci. 2011. PMID: 21730343
-
In Vivo 3D Determination of Peripapillary Scleral and Retinal Layer Architecture Using Polarization-Sensitive Optical Coherence Tomography.Transl Vis Sci Technol. 2020 Oct 19;9(11):21. doi: 10.1167/tvst.9.11.21. eCollection 2020 Oct. Transl Vis Sci Technol. 2020. PMID: 33150047 Free PMC article.
-
Effect of lowering intraocular pressure on optical coherence tomography measurement of peripapillary retinal nerve fiber layer thickness.Ophthalmology. 2007 Dec;114(12):2252-8. doi: 10.1016/j.ophtha.2007.02.012. Epub 2007 Apr 27. Ophthalmology. 2007. PMID: 17466378
-
[A challenge to primary open-angle glaucoma including normal-pressure. Clinical problems and their scientific solution].Nippon Ganka Gakkai Zasshi. 2012 Mar;116(3):233-67; discussion 268. Nippon Ganka Gakkai Zasshi. 2012. PMID: 22568103 Review. Japanese.
Cited by
-
Molecular Contrast Optical Coherence Tomography and Its Applications in Medicine.Int J Mol Sci. 2022 Mar 11;23(6):3038. doi: 10.3390/ijms23063038. Int J Mol Sci. 2022. PMID: 35328454 Free PMC article. Review.
-
Ocular fundus pulsations within the posterior rat eye: Chorioscleral motion and response to elevated intraocular pressure.Sci Rep. 2017 Aug 18;7(1):8780. doi: 10.1038/s41598-017-09310-1. Sci Rep. 2017. PMID: 28821834 Free PMC article.
-
Structured polarized light microscopy for collagen fiber structure and orientation quantification in thick ocular tissues.J Biomed Opt. 2018 Oct;23(10):1-10. doi: 10.1117/1.JBO.23.10.106001. J Biomed Opt. 2018. PMID: 30277032 Free PMC article.
-
White light polarization sensitive optical coherence tomography for sub-micron axial resolution and spectroscopic contrast in the murine retina.Biomed Opt Express. 2018 Apr 5;9(5):2115-2129. doi: 10.1364/BOE.9.002115. eCollection 2018 May 1. Biomed Opt Express. 2018. PMID: 29760974 Free PMC article.
-
Posterior scleral birefringence measured by triple-input polarization-sensitive imaging as a biomarker of myopia progression.Nat Biomed Eng. 2023 Aug;7(8):986-1000. doi: 10.1038/s41551-023-01062-w. Epub 2023 Jun 26. Nat Biomed Eng. 2023. PMID: 37365268 Free PMC article.
References
-
- Burgoyne C. F., Downs J. C., Bellezza A. J., Suh J.-K. F., Hart R. T., “The optic nerve head as a biomechanical structure: a new paradigm for understanding the role of IOP-related stress and strain in the pathophysiology of glaucomatous optic nerve head damage,” Prog. Retin. Eye Res. 24(1), 39–73 (2005).10.1016/j.preteyeres.2004.06.001 - DOI - PubMed
-
- Yamanari M., Nagase S., Fukuda S., Ishii K., Tanaka R., Yasui T., Oshika T., Miura M., Yasuno Y., “Scleral birefringence as measured by polarization-sensitive optical coherence tomography and ocular biometric parameters of human eyes in vivo,” Biomed. Opt. Express 5(5), 1391–1402 (2014).10.1364/BOE.5.001391 - DOI - PMC - PubMed
LinkOut - more resources
Full Text Sources
Other Literature Sources