. 2016 Dec 19;8(1):323-337.
doi: 10.1364/BOE.8.000323. eCollection 2017 Jan 1.

Structural and functional human retinal imaging with a fiber-based visible light OCT ophthalmoscope

Affiliations

Structural and functional human retinal imaging with a fiber-based visible light OCT ophthalmoscope

Shau Poh Chong et al. Biomed Opt Express. .

Abstract

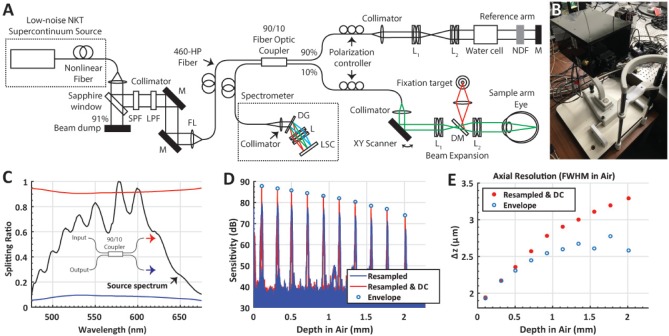
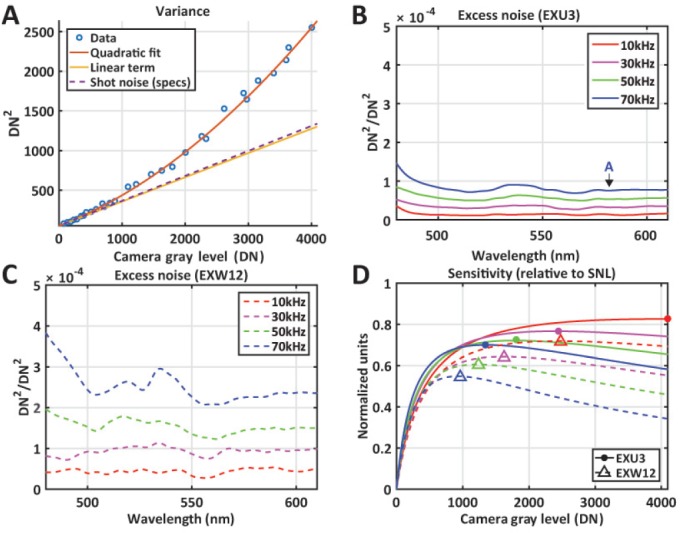
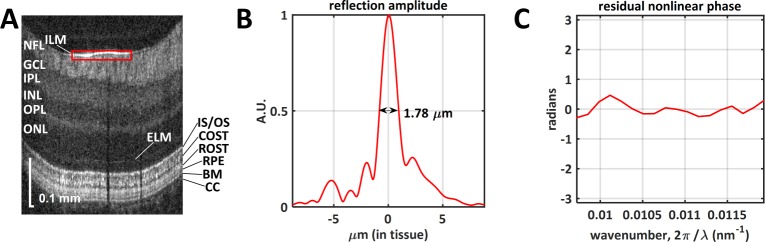
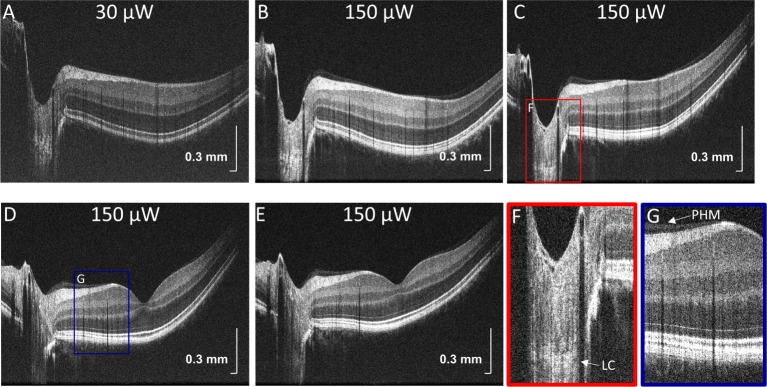
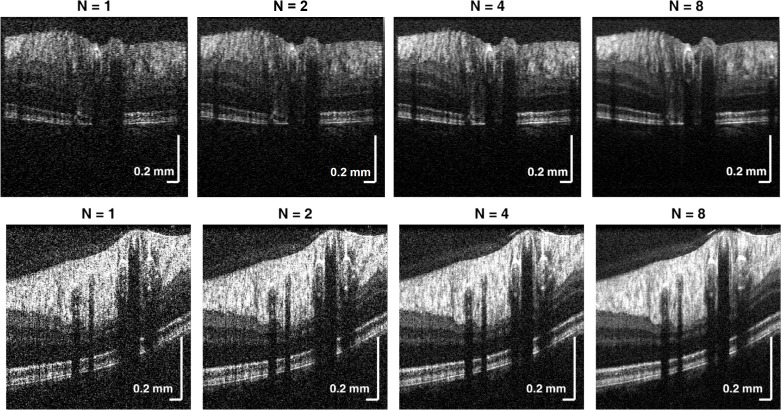
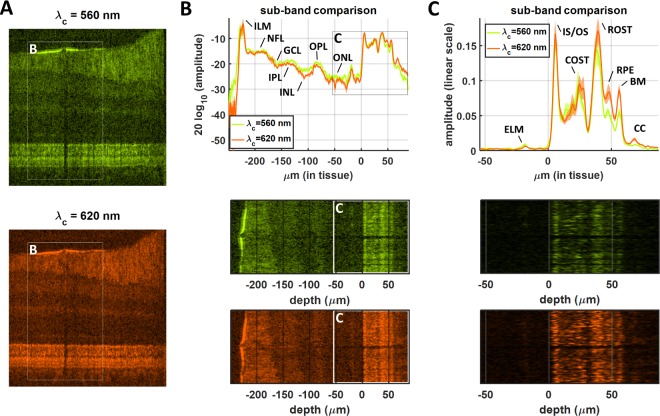
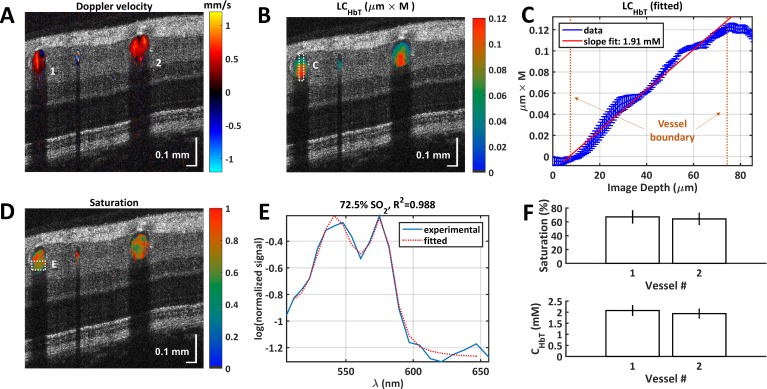
The design of a multi-functional fiber-based Optical Coherence Tomography (OCT) system for human retinal imaging with < 2 micron axial resolution in tissue is described. A detailed noise characterization of two supercontinuum light sources with different pulse repetition rates is presented. The higher repetition rate and lower noise source is found to enable a sensitivity of 96 dB with 0.15 mW light power at the cornea and a 98 microsecond exposure time. Using a broadband (560 ± 50 nm), 90/10, fused single-mode fiber coupler designed for visible wavelengths, the sample arm is integrated into an ophthalmoscope platform, similar to current clinical OCT systems. To demonstrate the instrument's range of operation, in vivo structural retinal imaging is also shown at 0.15 mW exposure with 10,000 and 70,000 axial scans per second (the latter comparable to commercial OCT systems), and at 0.03 mW exposure and 10,000 axial scans per second (below maximum permissible continuous exposure levels). Lastly, in vivo spectroscopic imaging of anatomy, saturation, and hemoglobin content in the human retina is also demonstrated.

Keywords: (060.2350) Fiber optics imaging; (140.7300) Visible lasers; (170.3880) Medical and biological imaging; (170.4500) Optical coherence tomography; (170.6480) Spectroscopy, speckle.


Figures

Fig. 1
Fig. 1
Fiber-based visible light OCT system for imaging the human retina. (A). Light from the supercontinuum light source passed through a short-pass filter (SPF) and a long-pass filter (LPF) after ∼9% reflection by a sapphire window before fiber coupling. A dichroic mirror was used to image a fixation target illuminated by a red LED onto the subject’s retina. M: mirror; L: lens; FL: focusing lens; DG: diffraction grating; LSC: line-scan camera, NDF: neutral density filter, DM: dichroic mirror. (B) A photograph showing the sample arm (covered) mounted on the ophthalmoscope platform. (C) The splitting ratio (90% arm-red, 10% arm-blue) of the broadband fiber coupler was measured using the OCT spectrometer, demonstrating flatness across the source spectrum (black). The FWHM spectral bandwidth was ∼110 nm. Assuming a Gaussian spectrum led to an axial resolution (FWHM of point spread function) of ∼1.4 µm in air. The spectrometer configuration used for imaging spanned ∼151 nm over 4096 pixels. Direct Fourier transformation of the spectrum registered on the spectrometer yielded an axial resolution of ∼1.7 µm in air. (D) The sensitivity rolloff, estimated from point spread functions (PSFs), derived by Fourier transformation of the resampled and dispersion compensated (DC) spectral fringes, was ~5–6 dB over the first half of the axial imaging range. Dispersion mismatch caused significant PSF broadening (blue), but if compensated (red), PSFs approached the sensitivity rolloff determined by Fourier transformation of the resampled spectral fringe envelopes [24] (blue circles). (E) The measured axial FWHM resolution was < 2.1 µm (in tissue) over the first half of the axial range.
Fig. 2
Fig. 2
Noise analysis for two supercontinuum light sources, EXU3 and EXW12, at visible wavelengths. (A) Quadratic fitting of the total noise variance versus camera gray level (DN), where the linear term corresponding to shot noise (solid yellow line), agrees with shot noise predicted from the manufacturer specified responsivity of ~13000 counts / 4096 DN (dashed purple line). (B) The excess noise coefficient, c(λ), of the EXU3, across visible wavelengths and a range of line rates, is shown, with an arrow indicating the location of the data in A. (C) The excess noise coefficient, c(λ), of the EXW12 is ≥ 2x larger than that of the EXU3 at the same wavelength and line rate. (D) Due to reduced excess noise of the higher repetition rate EXU3 source, more reference counts can be used without introducing excess noise, enabling maximal sensitivities (filled circles) closer to the shot noise limit (SNL), and higher than those achieved with the EXW12 source (open triangles).
Fig. 3
Fig. 3
(A) High resolution, in vivo, human retinal imaging. The nerve fiber layer (NFL), ganglion cell layer (GCL), inner plexiform layer (IPL), inner nuclear layer (INL), outer plexiform layer (OPL), and outer nuclear layer (ONL) are visualized in the inner retina. Outer retinal scattering bands include the external limiting membrane (ELM), photoreceptor inner/outer segment junction (IS/OS), cone outer segment tips (COST), rod outer segment tips (ROST), retinal pigment epithelium (RPE,) as well as Bruch’s membrane (BM). Posterior to BM are the choriocapillaris (CC) and choroid, with reduced signal due to attenuation by pigment and blood. (B) Reflection amplitude for the inner limiting membrane (ILM), extracted from the window marked as red box in panel A. The full-width at half maximum (FWHM) of the reflection profile amplitude was ~1.78 µm in tissue, consistent with our measured axial resolution in air (Fig. 1(E)). (C) The residual nonlinear spectral phase of the reflection profile in panel (B) was small compared to π radians, suggesting that the dispersion and resampling errors were minimized. Imaging was performed using configuration I.
Fig. 4
Fig. 4
High-definition images consisting of ~3800 axial scans over a field-of-view of 13 mm were acquired at an axial scan rate of 10 kHz. (A) Images with 30 µW incident power were used for alignment. (B) Once aligned, higher sensitivity images were acquired with 150 µW incident power to better delineate retinal anatomy. (C–E) Additional images on or near the papillomacular axis show inner and outer retinal layers, while zooms (F–G) show the lamina cribrosa (LC) and a visible posterior hyaloid membrane (PHM). The image in panel A was acquired using configuration II, and images in panels B–G were acquired using configuration III.
Fig. 5
Fig. 5
Motion correction and averaging of images, acquired using configuration IV at a frame rate of 136 Hz, improves visualization of retinal layers. The images in the upper and lower panels, displayed on the same grayscale, were acquired at two different cross-sectional locations, superior and inferior to the optic nerve head, respectively. N is the number of images averaged.
Fig. 6
Fig. 6
Split-spectrum analysis of OCT retinal morphology. (A) Flattened sub-band images of the retina with center wavelengths of 560 nm (top) and 620 nm (bottom) are shown. The axial resolution was reduced to 4.0 µm (in tissue) within each sub-band, in exchange for spectroscopic information. (B) Axial signal profiles in each sub-band were normalized to the ILM reflection and averaged across a region of interest (white boxes in panel A), before plotting on a logarithmic scale. Interestingly, the inner retinal layers produced higher signal in the shorter wavelength sub-band, suggesting higher backscattering at shorter wavelengths. (C) Axial signal profiles of the outer retina, plotted on a linear scale, show that distinctive outer retinal layers can be visualized. The retinal pigment epithelium (RPE) and Bruch’s Membrane (BM) produced higher signal in the longer wavelength sub-band, possibly due to presence of chromophores that absorb more around 560 nm than around 620 nm. Imaging was performed using configuration I.
Fig. 7
Fig. 7
Functional human retinal imaging using visible light OCT. (A) Image of Doppler velocities overlaid on structural OCT image. (B) Cumulative hemoglobin in retinal vessels exhibits a characteristic downward “crescent” shape, due to a larger cumulative path length at the distal end of the vessel. (C) The hemoglobin concentration in the marked vein was estimated to be 1.91 mM, corresponding to 12.3 g/dL. (D) Oxygen saturation mapping in retinal vessels is shown, with a spectroscopic fit for the distal portion of the vein (E). (F) The means and standard deviations of sO2 and CHbT are shown for vessels 1 and 2 (labelled in A) over a period of ∼3 seconds. The measured saturations for the two vessels are 67.2 ± 8.8 % and 64.4 ± 8.2 % respectively. The measured CHbT values for the same vessels are 2.08 ± 0.22 mM (13.4 ± 1.4 g/dL) and 1.94 ± 0.20 mM (12.5 ± 1.3 g/dL) respectively. Imaging was performed using configuration I.

References

    1. Wojtkowski M., Leitgeb R., Kowalczyk A., Bajraszewski T., Fercher A. F., “In vivo human retinal imaging by Fourier domain optical coherence tomography,” J. Biomed. Opt. 7, 457–463 (2002).10.1117/1.1482379 - DOI - PubMed
    1. Schuman J. S., Puliafito C. A., Fujimoto J. G., Duker J. S., Optical Coherence Tomography of Ocular Diseases, 3rd ed. (SLACK Inc., Thorofare, NJ, 2013), pp. xviii, 615.
    1. Lee E. C. W., de Boer J. F., Mujat M., Lim H., Yun S. H., “In vivo optical frequency domain imaging of human retina and choroid,” Opt. Express 14, 4403–4411 (2006).10.1364/OE.14.004403 - DOI - PubMed
    1. Leitgeb R., Hitzenberger C., Fercher A., “Performance of fourier domain vs. time domain optical coherence tomography,” Opt. Express 11, 889–894 (2003).10.1364/OE.11.000889 - DOI - PubMed
    1. de Boer J. F., Cense B., Park B. H., Pierce M. C., Tearney G. J., Bouma B. E., “Improved signal-to-noise ratio in spectral-domain compared with time-domain optical coherence tomography,” Opt. Lett. 28, 2067–2069 (2003).10.1364/OL.28.002067 - DOI - PubMed