

Immunohistochemical expression of intrarenal renin angiotensin system components in response to tempol in rats fed a high salt diet
- PMID: 28101449
- PMCID: PMC5215206
- DOI: 10.5527/wjn.v6.i1.29
Immunohistochemical expression of intrarenal renin angiotensin system components in response to tempol in rats fed a high salt diet
Abstract
Aim: To determine the effect of tempol in normal rats fed high salt on arterial pressure and the balance between antagonist components of the renal renin-angiotensin system.
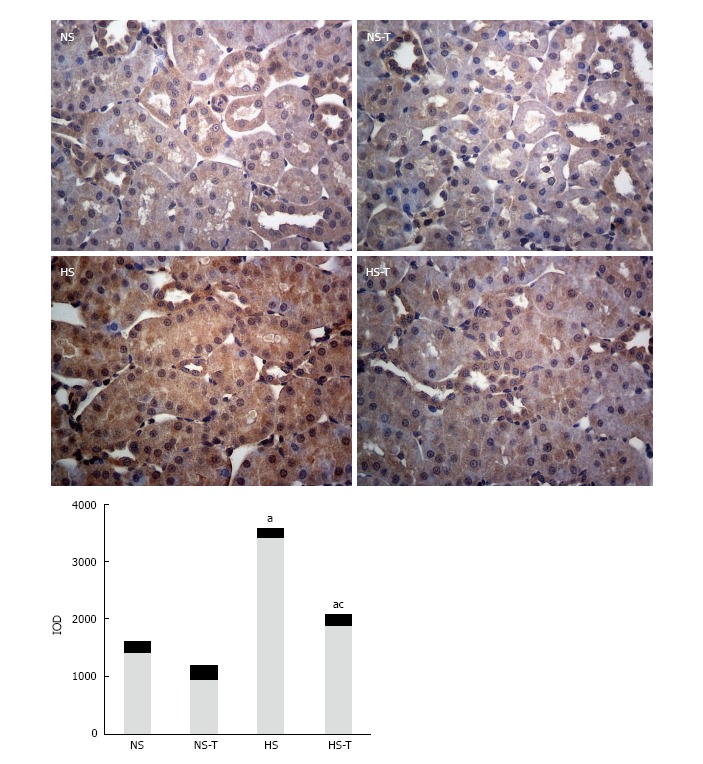
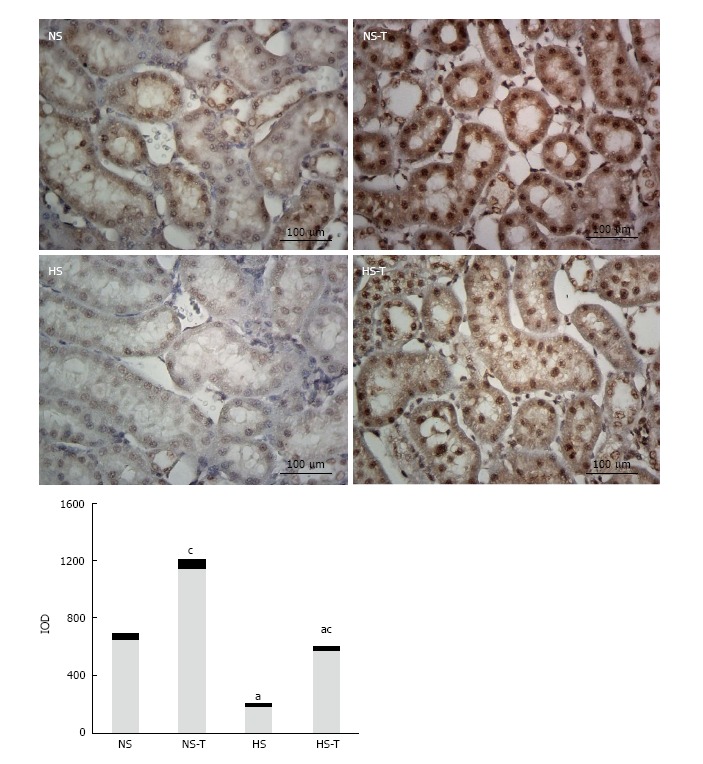
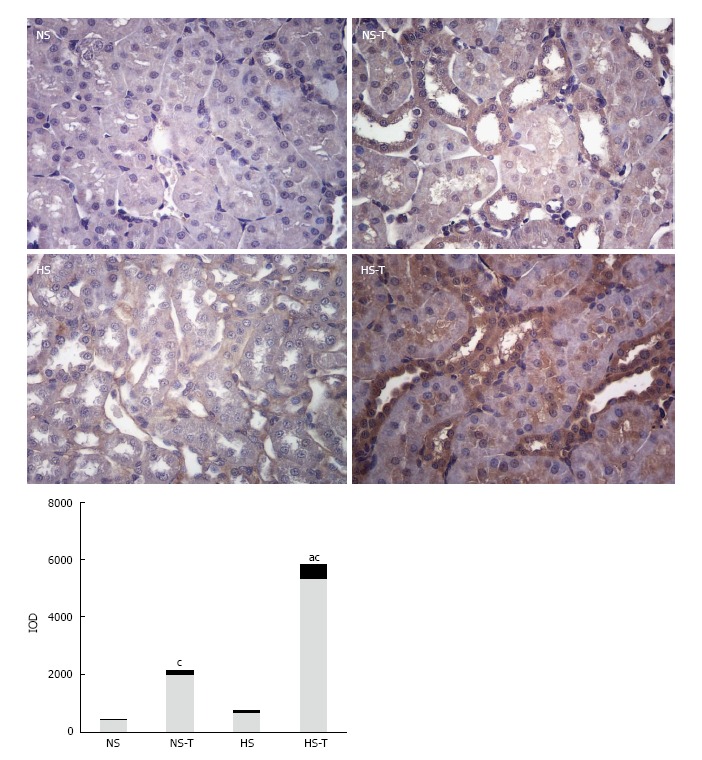
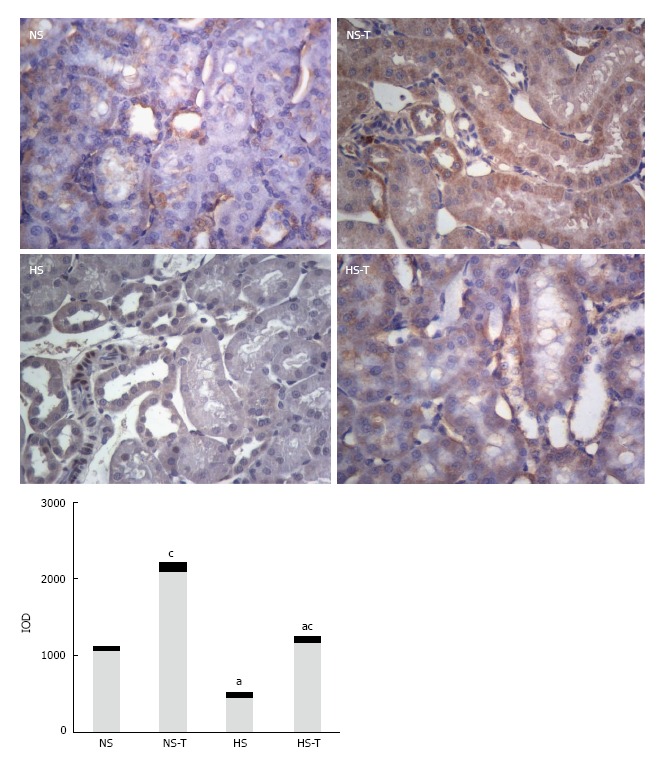
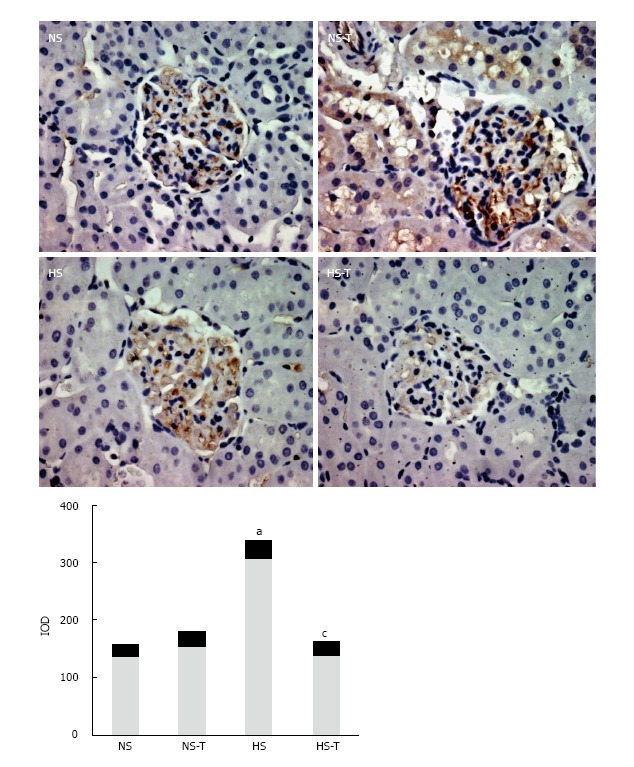
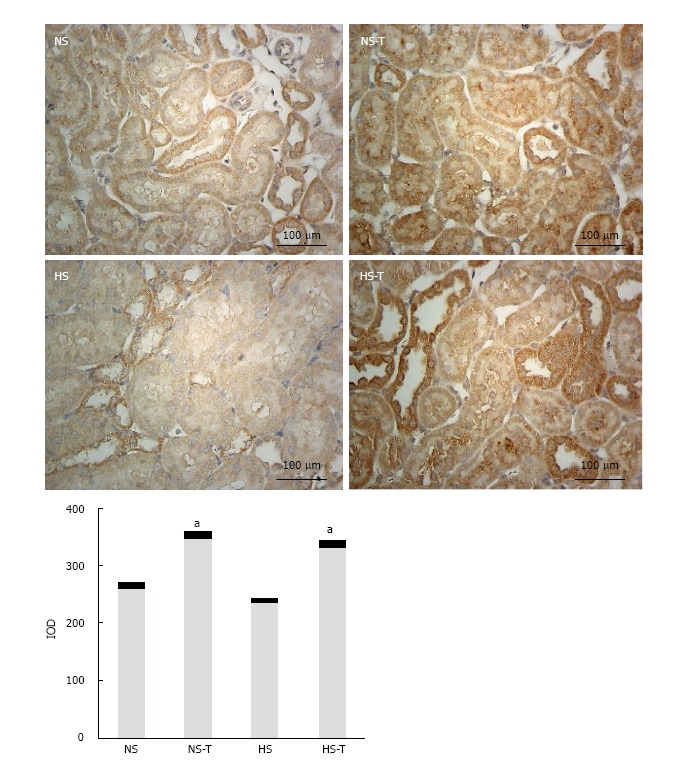
Methods: Sprague-Dawley rats were fed with 8% NaCl high-salt (HS) or 0.4% NaCl (normal-salt, NS) diet for 3 wk, with or without tempol (T) (1 mmol/L, administered in drinking water). Mean arterial pressure (MAP), glomerular filtration rate (GFR), and urinary sodium excretion (UVNa) were measured. We evaluated angiotensin II (Ang II), angiotensin 1-7 (Ang 1-7), angiotensin converting enzyme 2 (ACE2), mas receptor (MasR), angiotensin type 1 receptor (AT1R) and angiotensin type 2 receptor (AT2R) in renal tissues by immunohistochemistry.
Results: The intake of high sodium produced a slight but significant increase in MAP and differentially regulated components of the renal renin-angiotensin system (RAS). This included an increase in Ang II and AT1R, and decrease in ACE-2 staining intensity using immunohistochemistry. Antioxidant supplementation with tempol increased natriuresis and GFR, prevented changes in blood pressure and reversed the imbalance of renal RAS components. This includes a decrease in Ang II and AT1R, as increase in AT2, ACE2, Ang (1-7) and MasR staining intensity using immunohistochemistry. In addition, the natriuretic effects of tempol were observed in NS-T group, which showed an increased staining intensity of AT2, ACE2, Ang (1-7) and MasR.
Conclusion: These findings suggest that a high salt diet leads to changes in the homeostasis and balance between opposing components of the renal RAS in hypertension to favour an increase in Ang II. Chronic antioxidant supplementation can modulate the balance between the natriuretic and antinatriuretic components of the renal RAS.
Keywords: Angiotensin 1-7; Angiotensin II; High sodium diet; Kidney; Tempol.
Conflict of interest statement
Conflict-of-interest statement: The authors have no conflicts of interest to disclose.
Figures
Similar articles
-
High Na intake increases renal angiotensin II levels and reduces expression of the ACE2-AT(2)R-MasR axis in obese Zucker rats.Am J Physiol Renal Physiol. 2012 Aug 1;303(3):F412-9. doi: 10.1152/ajprenal.00097.2012. Epub 2012 May 16. Am J Physiol Renal Physiol. 2012. PMID: 22592638 Free PMC article.
-
Oxidative stress causes imbalance of renal renin angiotensin system (RAS) components and hypertension in obese Zucker rats.J Am Heart Assoc. 2015 Feb 16;4(2):e001559. doi: 10.1161/JAHA.114.001559. J Am Heart Assoc. 2015. PMID: 25687731 Free PMC article.
-
High-sodium diet promotes a profibrogenic reaction in normal rat kidneys: effects of Tempol administration.J Nephrol. 2011 Jan-Feb;24(1):119-27. doi: 10.5301/jn.2010.5824. J Nephrol. 2011. PMID: 20954139
-
ACE2 and vasoactive peptides: novel players in cardiovascular/renal remodeling and hypertension.Ther Adv Cardiovasc Dis. 2015 Aug;9(4):217-37. doi: 10.1177/1753944715597623. Epub 2015 Aug 13. Ther Adv Cardiovasc Dis. 2015. PMID: 26275770 Review.
-
The intrarenal renin-angiotensin system in hypertension.Adv Chronic Kidney Dis. 2015 May;22(3):204-10. doi: 10.1053/j.ackd.2014.11.004. Adv Chronic Kidney Dis. 2015. PMID: 25908469 Review.
Cited by
-
Sodium status and kidney involvement during COVID-19 infection.Virus Res. 2020 Sep;286:198034. doi: 10.1016/j.virusres.2020.198034. Epub 2020 May 21. Virus Res. 2020. PMID: 32445872 Free PMC article.
-
ACE2 in the Era of SARS-CoV-2: Controversies and Novel Perspectives.Front Mol Biosci. 2020 Sep 30;7:588618. doi: 10.3389/fmolb.2020.588618. eCollection 2020. Front Mol Biosci. 2020. PMID: 33195436 Free PMC article. Review.
-
SARS-CoV-2, Placental Histopathology, Gravity of Infection and Immunopathology: Is There an Association?Viruses. 2022 Jun 18;14(6):1330. doi: 10.3390/v14061330. Viruses. 2022. PMID: 35746801 Free PMC article.
-
iTRAQ-based proteomics reveals serum protein changes in hypertensive rats induced by a high-salt diet.EXCLI J. 2020 Nov 6;19:1496-1511. doi: 10.17179/excli2020-2740. eCollection 2020. EXCLI J. 2020. PMID: 33250683 Free PMC article.
-
Angiotensin-(1-7)-A Potential Remedy for AKI: Insights Derived from the COVID-19 Pandemic.J Clin Med. 2021 Mar 13;10(6):1200. doi: 10.3390/jcm10061200. J Clin Med. 2021. PMID: 33805760 Free PMC article. Review.
References
-
- Koliaki C, Katsilambros N. Dietary sodium, potassium, and alcohol: key players in the pathophysiology, prevention, and treatment of human hypertension. Nutr Rev. 2013;71:402–411. - PubMed
-
- Titze J, Ritz E. Salt and its effect on blood pressure and target organ damage: new pieces in an old puzzle. J Nephrol. 2009;22:177–189. - PubMed
-
- Majid DS, Kopkan L. Nitric oxide and superoxide interactions in the kidney and their implication in the development of salt-sensitive hypertension. Clin Exp Pharmacol Physiol. 2007;34:946–952. - PubMed
-
- Silva GB, Ortiz PA, Hong NJ, Garvin JL. Superoxide stimulates NaCl absorption in the thick ascending limb via activation of protein kinase C. Hypertension. 2006;48:467–472. - PubMed
LinkOut - more resources
Full Text Sources
Other Literature Sources
Miscellaneous
