. 2017 Jan 4:4:150.
doi: 10.3389/fcell.2016.00150. eCollection 2016.

Plasma Membrane Targeting of Endogenous NKCC2 in COS7 Cells Bypasses Functional Golgi Cisternae and Complex N-Glycosylation

Affiliations

Plasma Membrane Targeting of Endogenous NKCC2 in COS7 Cells Bypasses Functional Golgi Cisternae and Complex N-Glycosylation

Richa Singh et al. Front Cell Dev Biol. .

Abstract

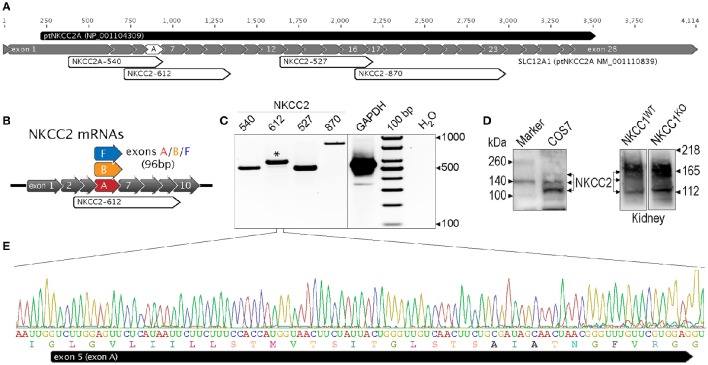
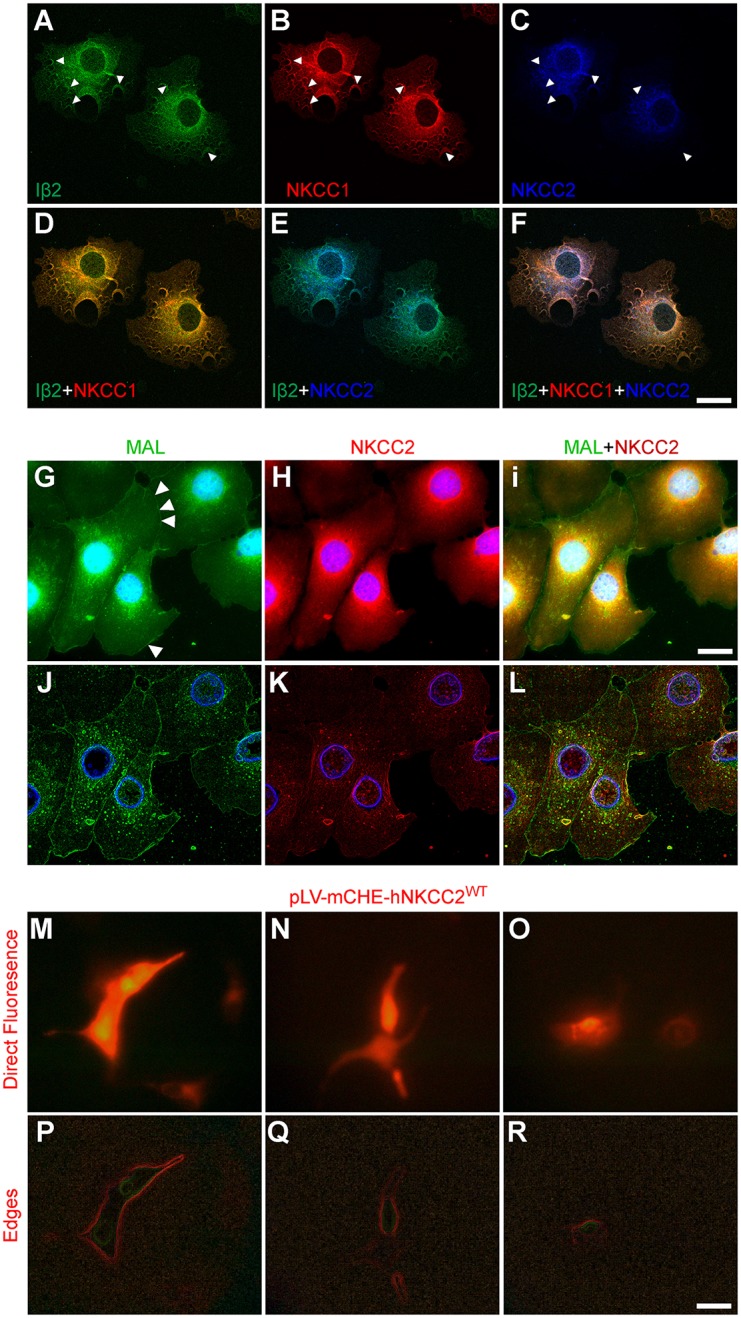
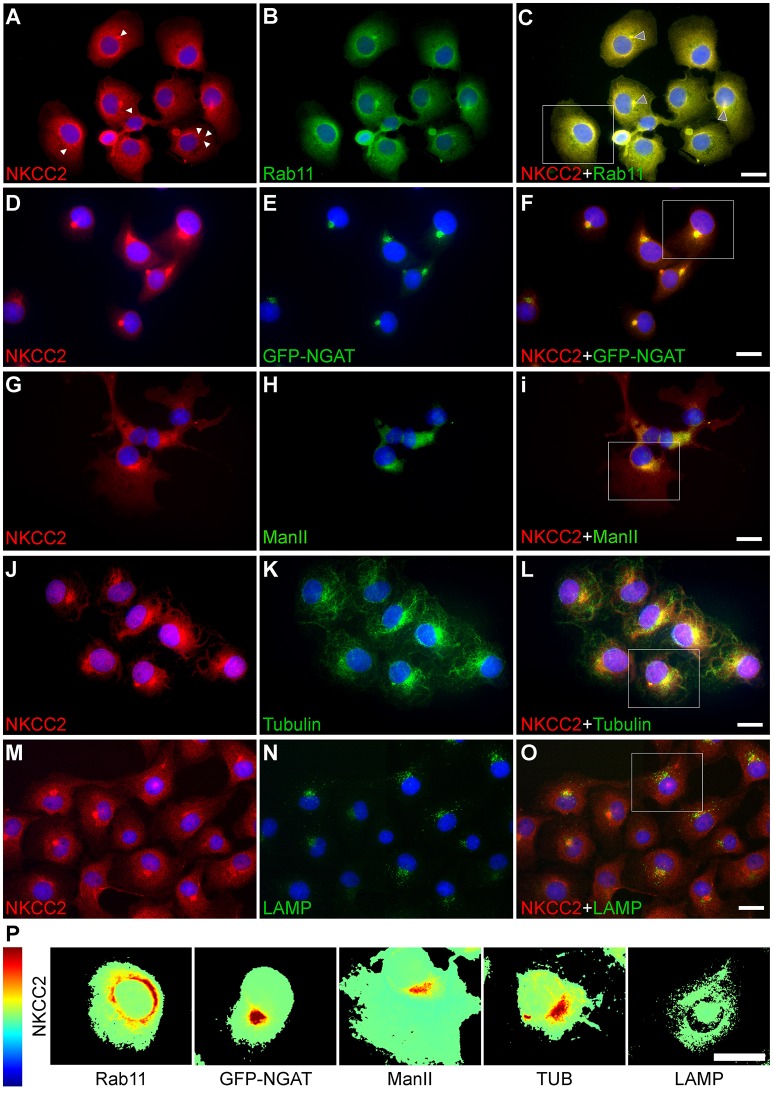
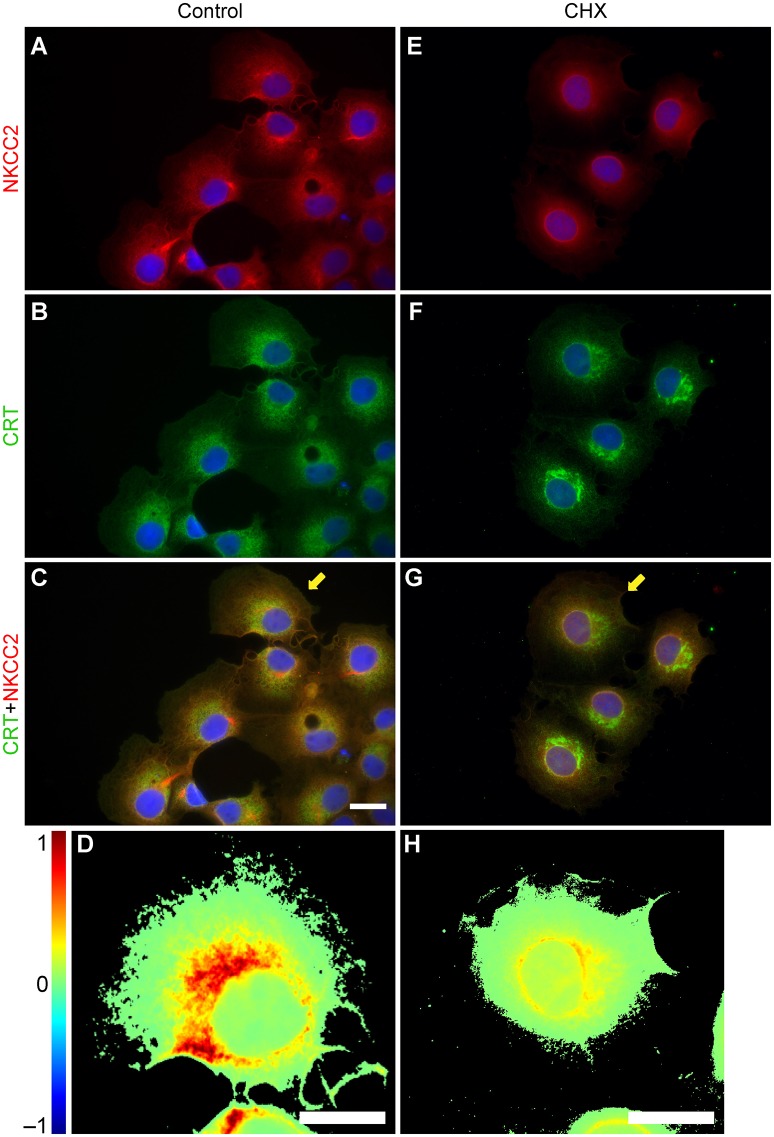
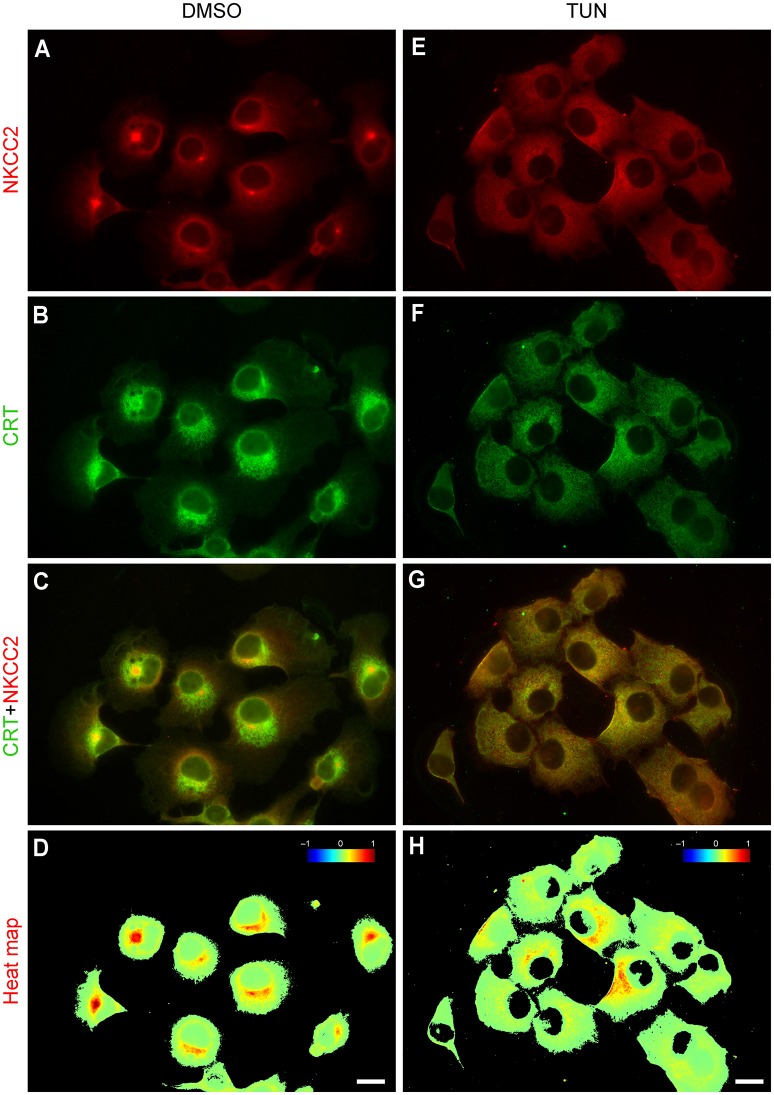
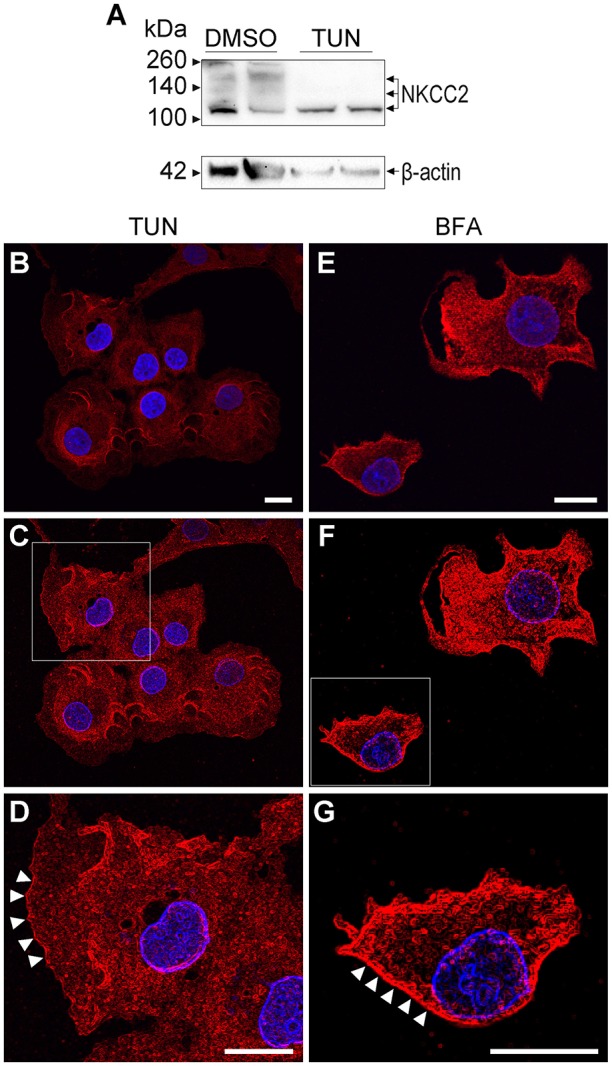
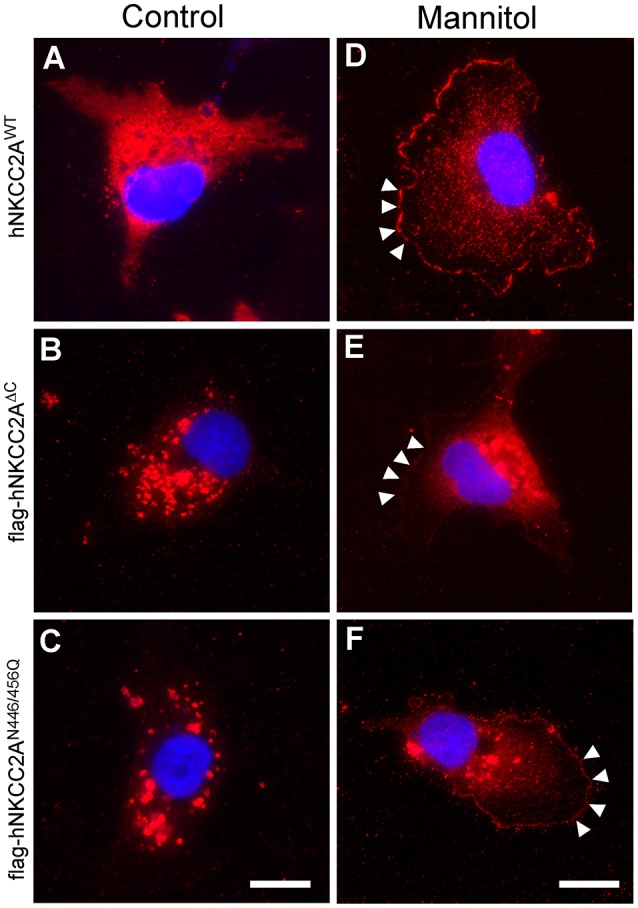
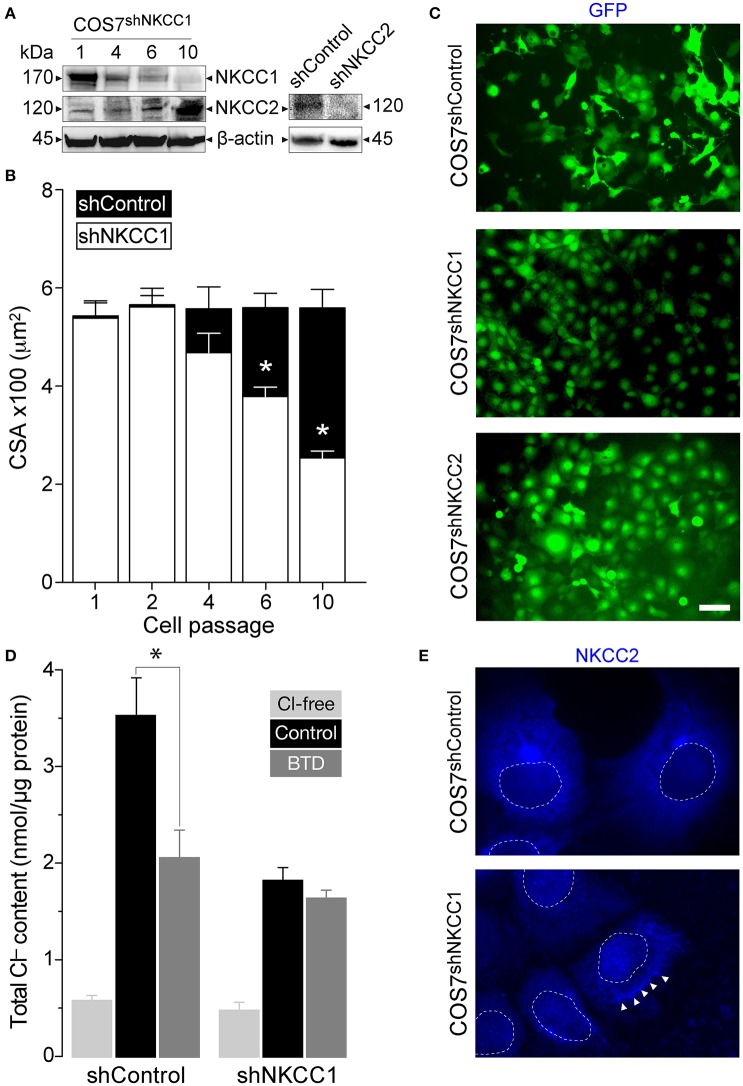
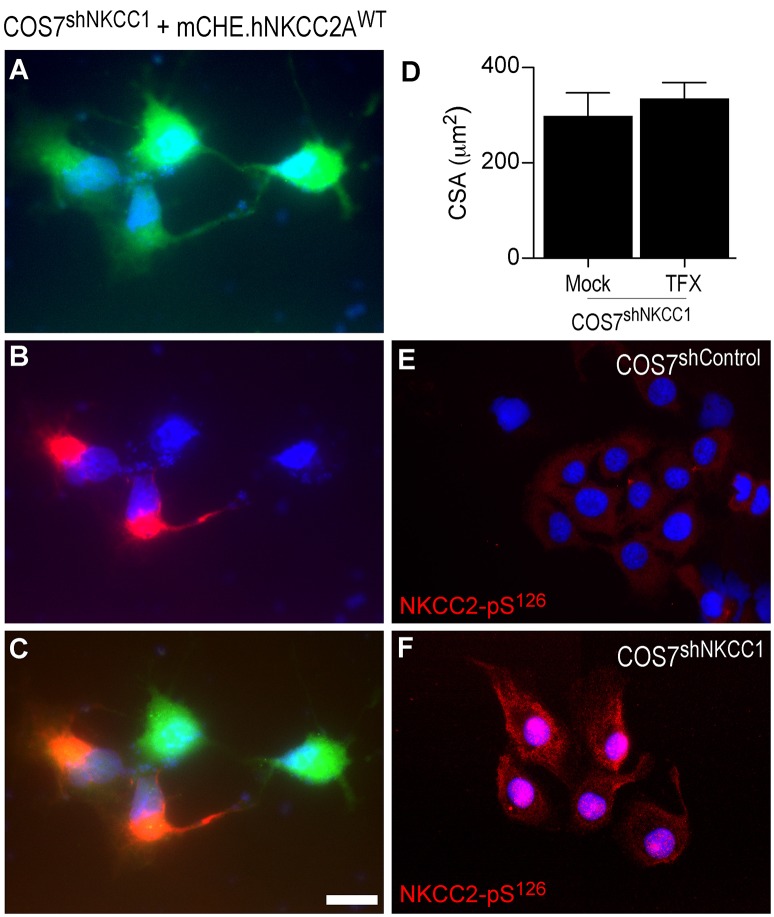
Na+K+2Cl- co-transporters (NKCCs) effect the electroneutral movement of Na+-K+ and 2Cl- ions across the plasma membrane of vertebrate cells. There are two known NKCC isoforms, NKCC1 (Slc12a2) and NKCC2 (Slc12a1). NKCC1 is a ubiquitously expressed transporter involved in cell volume regulation, Cl- homeostasis and epithelial salt secretion, whereas NKCC2 is abundantly expressed in kidney epithelial cells of the thick ascending loop of Henle, where it plays key roles in NaCl reabsorption and electrolyte homeostasis. Although NKCC1 and NKCC2 co-transport the same ions with identical stoichiometry, NKCC1 actively co-transports water whereas NKCC2 does not. There is growing evidence showing that NKCC2 is expressed outside the kidney, but its function in extra-renal tissues remains unknown. The present study shows molecular and functional evidence of endogenous NKCC2 expression in COS7 cells, a widely used mammalian cell model. Endogenous NKCC2 is primarily found in recycling endosomes, Golgi cisternae, Golgi-derived vesicles, and to a lesser extent in the endoplasmic reticulum. Unlike NKCC1, NKCC2 is minimally hybrid/complex N-glycosylated under basal conditions and yet it is trafficked to the plasma membrane region of hyper-osmotically challenged cells through mechanisms that require minimal complex N-glycosylation or functional Golgi cisternae. Control COS7 cells exposed to slightly hyperosmotic (~6.7%) solutions for 16 h were not shrunken, suggesting that either one or both NKCC1 and NKCC2 may participate in cell volume recovery. However, NKCC2 targeted to the plasma membrane region or transient over-expression of NKCC2 failed to rescue NKCC1 in COS7 cells where NKCC1 had been silenced. Further, COS7 cells in which NKCC1, but not NKCC2, was silenced exhibited reduced cell size compared to control cells. Altogether, these results suggest that NKCC2 does not participate in cell volume recovery and therefore, NKCC1 and NKCC2 are functionally different Na+K+2Cl- co-transporters.

Keywords: COS7; Golgi; N-glycosylation; NKCC2A; cell volume.


Figures

Figure 1
Figure 1
Endogenous NKCC2A expression in COS7 cells. (A) Representation of chimpanzee NKCC2A mRNA sequence of reference (ptNKCC2A, RefSeq NM_001110839), inferred from genomic sequences. The 28 coding exons are represented as gray filled arrows, numbered relative to the first coding exon (exon 1). The protein predicted in silico has 1099 amino acids and it is represented as a black-filled arrow on top of this panel. The predicted RT-PCR fragments amplified using the NKCC2 primer sets are represented as white arrows, and are labeled as follows: NKCC2A-540, NKCC2-612, NKCC2-527, and NKCC2-870. (B) Representation of mouse NKCC2 splicing variants mNKCC2A, mNKCC2B, and mNKCC2F showing the encompassing primer set NKCC2-612, predicted to co-amplify NKCC2A, B and F. (C) Representative RT-PCR experiment performed using NKCC2 primer sets indicated in B. Shown is a 2% agarose gel showing bands of predicted size for NKCC2 i.e., 540, 612, 527, and 870 bps. RT-PCR reactions included amplification of GAPDH (555 bp). Negative controls were performed using H2O instead of RNA and GAPDH-555 primer set. (D) Immunoblot of COS7 lysates (left) showing NKCC2 protein expression as bands of ~120kDa, ~135kDa, and ~165kDa. As positive control for NKCC2 expression, whole mouse kidney lysates obtained from WT and NKCC1KO mice (right panel) were run in parallel. (E) Partial nucleotide sequence of the RT-PCR amplicon obtained with NKCC2-612 primer set. The band of 612 bp (asterisk) was sequenced in both directions. The sequence chromatogram shown is representative of 6 different amplification reactions and corresponds to the region encompassing exon A of COS7 NKCC2A mRNA.
Figure 2
Figure 2
Endogenous NKCC2 does not localize to the plasma membrane region of COS7 cells under basal normotonic conditions. (A–C) Confocal immunofluorescence microscopy images of sub-confluent COS7 cells immunolabeled with primary antibodies directed against integrin β2 (Iβ2, A), NKCC1 (B), and NKCC2 (C). The secondary antibodies were conjugated to AF488 (green), Cy3 (red), and DyLight405 (blue), respectively. (D) Overlays of (A; Iβ2) and (B; NKCC1). (E) Overlays of (A; Iβ2) and (C). (F) Overlays of (A; Iβ2), (B; NKCC1), and (C; (NKCC2). (G–I) Immunofluorescence microscopy images of fixed and permeabilized COS7 cells labeled with FITC-conjugated Maackia Amurensis lectin (MAL, G) to visualize cell membranes (arrowheads). Cells were also probed against NKCC2 coupled to Cy3-conjugated secondary antibodies (H) and the images superimposed (I). In (G–I), cell nuclei were counterstained using DAPI. (J–L) Visualization of cell edges of images (G–I) by using ImageJ and applying the Canny-Deriche filtering plugin. Note the lack of NKCC2-IR in the overlay image shown in (L). (M–O) Direct immunofluorescence microscopy of COS7 cells growing in glass coverslips and over-expressing different levels of the lentiviral vector mCherry-NKCC2AWT. (P,R) Visualization of the edges of the transfected cells shown in (M–O) by applying the Canny-Deriche filtering plugin of ImageJ. All images were taken at 600x magnification. Bar represents 10 μm.
Figure 3
Figure 3
Endogenous NKCC2 localizes to recycling endosomes, Golgi cisternae, and tubulin-positive structures. Immunofluorescence microscopy images of sub-confluent COS7 cells grown in glass coverslips were permeabilized and immunolabeled with markers of intracellular organelles. (A–C) COS7 cells labeled with primary antibodies against NKCC2 (A) and Rab11, a marker of the recycling endosomal compartment (B). Co-localization of NKCC2 and Rab11 is shown in the merged image (C), where the withe arrowheads indicate NKCC2 localization in structures lying at one of the poles of the cell or in vesicles. (D–F) COS7 cells transduced with GFP-NGAT constructs to visualize the Golgi compartments (E) and then permeabilized and immunolabeled against NKCC2 (D, F). (G–I) COS7 cells immunolabeled against NKCC2 (G) and α-mannosidase II, a marker of trans-Golgi cisternae (ManII, H). Localization of NKCC2 to Golgi compartments is shown in the respective merged images (F and I). (J–L) COS7 cells immunolabeled against NKCC2 (J) and tubulin (K) showing localization of the transporter to structures resembling the MTOC/pericentriolar compartment (L). (M–O) Expression of NKCC2 (M) and the lysosomal marker LAMP (N) were detected but not co-localized (O). The cell nuclei were counterstained with DAPI in all micrographs. All micrographs were taken at 600x. Bar represents 10 μm. (P) Co-localization heat-map of the cells framed with a white rectangle in (C, F, I, L, and O), computed by using the NIH ImageJ co-localization plugin.
Figure 4
Figure 4
NKCC2 localizes to the ER of COS7 cells. (A–D) COS7 cells immunolabeled against NKCC2 (A) or calreticulin (CRT, B), a calcium-binding protein that resides in the ER. Secondary antibodies were: Cy3 (NKCC2, red) and AF488 (CRT, green). The co-localization of NKCC2 and CRT is shown in C, a merged image of (A,B), and in the heat-map shown in (D), which corresponds to the cell labeled with a yellow arrow. (E–H) Images of COS7 cells grown in the presence of cycloheximide (CHX, 1 μg/ml, 2 h) to acutely inhibit ongoing protein synthesis in the ER. NKCC2 (E) and CRT (F) were detected by using the relevant primary antibodies and secondary antibodies labeled with Cy3 (red) and AF488 (green). Merged images (E,F) show degree of co-localization on heat-maps (G–H).
Figure 5
Figure 5
Inhibition of N-glycosylation results in redistribution of endogenous NKCC2 in COS7 cells. Immunofluorescence microscopy images of COS7 cells grown under control conditions (DMSO 0.2% used as vehicle, 16 h, A–D) or treated with 2 μg/ml tunicamycin (TUN plus vehicle, 16 h E–H). NKCC2 and CRT co-localization is shown in merged images (C,G), which were used to compute their respective co-localization heat maps (D,H). Bars represent 10 μm.
Figure 6
Figure 6
The first step of N-glycan biosynthesis impairs N-glycosylation of NKCC2 but not its expression or trafficking. (A) Representative immunoblots showing NKCC2 expression in protein extracts from COS7 cells that were grown under control conditions (0.2% DMSO) or treated with TUN (2 μg/ml, 16 h). Note the cotransporter's bands of ~120 kDa, ~135 kDa, and ~160 kDa in control immunoblots. In contrast, protein extracted from cells treated with TUN only showed a band at ~120 kDa. β-actin was used as loading control. (B–D) Confocal images of COS7 cells grown in control conditions (DMSO 0.2% used as vehicle) immunolabeled against NKCC2 and visualized with Cy3-conjugated secondary antibodies (red). Bars in (B,D) represent 10 μm. The edges of COS7 cells were visualized by applying the Canny-Deriche filtering plugin of ImageJ (C) and the cell within the square frame magnified (D) to visualize the plasma membrane region, where NKCC2-IR is indicated with arrowheads. (E–G) Confocal images of COS7 cells cultured in the presence of brefeldin-A (BFA 1 μg/ml 16 h, E) to collapse Golgi membranes into the ER. NKCC2 was visualized using Cy3-conjugated secondary antibodies (red). The edges of COS7 cells were visualized as indicated in (C). The square in (F) indicates the cell magnified in (G), where the plasma membrane location of NKCC2 is indicated with arrowheads. Bars in (E,G) represent 10 μm.
Figure 7
Figure 7
Sustained hyperosmotic stress promotes NKCC2A plasma membrane localization independently of N-glycosylation. Immunofluorescence microscopy images of COS7 cells transfected with FLAG-tagged hNKCC2AWT (A), hNKCC2AΔC (B), or hNKCC2AN446/456Q (C) growing on glass coverslips in normotonic conditions (~300 mOsm/kg H2O) or in hyperosmotic (~6.7%) media (320 mOsm/kg H2O) for 16 h. The hyperosmotic media was prepared by adding 19.5 mM mannitol to control media (D–F). Cells were labeled by using FLAG antibodies coupled to Cy3-conjugated secondary antibodies. Arrowheads in (D–F) represent FLAG-NKCC2 expressed toward the edges of the cells. Bar represents 10 μm and applies to (E,D).
Figure 8
Figure 8
COS7 in which NKCC1 was silenced were reduced in size. (A) Immunoblots of protein extracts obtained from COS7shNKCC1 cells at indicated post-transfection cell passages. Immunoreactive bands were visualized using anti-NKCC1 and -NKCC2 antibodies coupled to HRP-conjugated secondary antibodies. As controls of NKCC2 expression, protein extracts of COS7shControl and COS7shNKCC2 cells were immunoblotted against NKCC2. (B) Cell areas of COS7shControl (mock transfected, filled bars) and COS7shNKCC1 cells (open bars). Cells at the indicated post-transfection passages (1–10) were plated on coverslips and their cross sectional area (CSA) determined the day after, using ImageJ. Asterisks represent statistical significance respect to COS7shControl cells at the same passage number (p < 0.05, n > 100 cells per group). (C) Direct fluorescence microscopy images of confluent COS7shControl (top), COS7shNKCC1 (center), and COS7shNKCC2 cells (bottom) stably expressing GFP to visualize the reduced overall cell size of COS7shNKCC1 cells (p10). Bar represents 50 μm. (D) Total and BTD-sensitive components of Cl uptake into COS7shControl and COS7shNKCC1 cells cultured under isotonic conditions in the absence of Cl (light gray bars), physiological concentrations of Cl without (black bars) or with 10 μM BTD (dark gray bars). Results are expressed as nmol/μg protein ± SEM (n = 5). (E) Fluorescence microscopy images of COS7shControl (top) and COS7shNKCC1 cells (bottom) where immunolabeled NKCC2 was detected using Dylight405-conjugated secondary antibodies. Dashed circles denote the cell nuclei. Arrowheads indicate NKCC2 location toward the plasma membrane.
Figure 9
Figure 9
NKCC2A does not recover the decreased cell size of COS7shNKCC1 cells. (A–C) Direct fluorescence microscopy images of COS7shNKCC1 cells (p10) grown in glass coverslips and stably expressing GFP from pGIPz-GFP.shNKCC1 constructs (A), transfected with mCherry-hNKCC2AWT (B) and superimposed (C). (D) Mean CSA in COS7hNKCC1 cells transiently transfected with mock or mCherry-hNKCC2AWT (TFX). (E–F) Fluorescence microscopy images of COS7shControl (E) and COS7shNKCC1 (F) where endogenous NKCC2 was immunolabeled by using antibodies against the activating phospho-residue pS126.

Similar articles

Cited by

References

    1. Akiyama K., Miyashita T., Matsubara A., Mori N. (2010). The detailed localization pattern of Na+/K+/2Cl- cotransporter type 2 and its related ion transport system in the rat endolymphatic sac. J. Histochem. Cytochem. 58, 759–763. 10.1369/jhc.2010.956045 - DOI - PMC - PubMed
    1. Akiyama K., Miyashita T., Mori T., Mori N. (2007). Expression of the Na+-K+-2Cl− cotransporter in the rat endolymphatic sac. Biochem. Biophys. Res. Commun. 364, 913–917. 10.1016/j.bbrc.2007.10.107 - DOI - PubMed
    1. Alshahrani S., Almutairi M. M., Kursan S., Dias-Junior E., Almiahuob M. M., Aguilar-Bryan L., et al. . (2015). Increased Slc12a1 expression in β-cells and improved glucose disposal in Slc12a2 heterozygous mice. J. Endocrinol. 227, 153–165. 10.1530/JOE-15-0327 - DOI - PMC - PubMed
    1. Alshahrani S., Alvarez-Leefmans F., Di Fulvio M. (2012). Expression of the Slc12a1 gene in pancreatic β-cells: molecular characterization and in silico analysis. Cell. Physiol. Biochem. 30, 95–112. 10.1159/000339050 - DOI - PubMed
    1. Alshahrani S., Di Fulvio M. (2012). Enhanced insulin secretion and improved glucose tolerance in mice with homozygous inactivation of the Na+K+2Cl- co-transporter 1. J. Endocrinol. 215, 59–70. 10.1530/JOE-12-0244 - DOI - PubMed

LinkOut - more resources