. 2017 Jan 19:8:14105.
doi: 10.1038/ncomms14105.

Fibronectin-guided migration of carcinoma collectives

Affiliations

Fibronectin-guided migration of carcinoma collectives

Sandeep Gopal et al. Nat Commun. .

Abstract

Functional interplay between tumour cells and their neoplastic extracellular matrix plays a decisive role in malignant progression of carcinomas. Here we provide a comprehensive data set of the human HNSCC-associated fibroblast matrisome. Although much attention has been paid to the deposit of collagen, we identify oncofetal fibronectin (FN) as a major and obligate component of the matrix assembled by stromal fibroblasts from head and neck squamous cell carcinomas (HNSCC). FN overexpression in tumours from 435 patients corresponds to an independent unfavourable prognostic indicator. We show that migration of carcinoma collectives on fibrillar FN-rich matrices is achieved through αvβ6 and α9β1 engagement, rather than α5β1. Moreover, αvβ6-driven migration occurs independently of latent TGF-β activation and Smad-dependent signalling in tumour epithelial cells. These results provide insights into the adhesion-dependent events at the tumour-stroma interface that govern the collective mode of migration adopted by carcinoma cells to invade surrounding stroma in HNSCC.


Figures
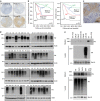
Figure 1
Figure 1. Fibronectin overexpression in human tumours predicts poor clinical outcome in HNSCC patients.
(a) Representative staining of total FN in histospots (600 μm) from HNSCC TMAs scored from 0 to 3. (b) Kaplan–Meier estimates of overall and DFS stratified by the dichotomized score of FN expression (low=score 0–1 versus high=score 2–3) in stage I–II (green and blue curves) and stage III–IV (red and black curves) tumours. P-values are from a log-rank test. (c) Representative staining of EDA-containing FN in a histospot. Scale bar, 100 μm. (d) Western blot analyses of FN expression in lysates of tissue samples from 60 human HNSCC (see Methods). Each blot includes six to eight tumour samples (patient numbers indicated above blots) and a control (Cont) lysate (40 μg, CAL33 cells). Actin staining provides a control of sample integrity and cellularity of tumour samples. (e) Western analysis of conditioned medium (top blots) and lysates (bottom blots) from HNSCC lines (CAL33, CAL27, Detroit 562, CAL60 and CAL166), TIF, CAFs and normal human fibroblasts (NF). Equivalent amounts of serum-containing culture medium (10% FCS for tumour cells and 20% FCS for TIFs) were deposited to determine levels of serum-borne FN. Erk1/2 expression in cell lysates was monitored as loading control.
Figure 2
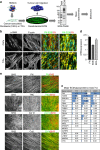
Figure 2. Composition and architecture of fibroblast-derived ECM.
(a) Scheme of the matrisome analysis workflow. (b) Left panels: representative immunofluoresence staining of α-smooth muscle actin (α-SMA) and F-actin in CAFs (top) and TIFs (bottom). Scale bar, 20 μm. Right panels: co-staining of total FN (green) and FN-EDB or FN-EDA/FN (red) in CAFs (top) and TIFs (bottom). Scale bar, 50 μm. Similar stainings were obtained for CAF1 and CAF2 preparations. (c) Top 20 ECM glycoproteins identified by mass spectrometry in cell-derived matrices produced by TIFs or by CAFs isolated from two different tumours. See Supplementary Data 1 for complete list of matrisome core proteins and matrisome-associated proteins. (d) Quantitative PCR analysis of transcripts encoding all FN isoforms (FN1), or isoforms harbouring the EDB and EDA, relative to GAPDH mRNA isolated from confluent TIFs. Results show mean ±s.d. from three independent experiments. (e) Comparison of second-harmonic generation (SHG) and immunofluorescence staining of TNC, FN, Col VI and Col I in TIF-derived matrix by two-photon laser microscopy. Representative images are from the same focal plane (n≥3 fields per staining from at least three matrix preparations). Scale bar, 50 μm.
Figure 3
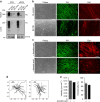
Figure 3. Directional migration of tumour cell cohorts on ECM fibres.
(a) Representative phase contrast images of HNSCC lines plated on plastic or TIF-derived ECM for 24 h. Scale bar, 150 μm. (b) Analysis of CAL33 cells on TIF-derived ECM by laser scanning confocal microscopy: (top) three-dimensional rendering of Dapi-stained nuclei and FN-EDA-stained ECM, (bottom) single projections of E-cadherin in intercellular junctions (left) and in tumour cell-derived vesicles sequestered in the ECM (right). Scale bar, 20 μm. (c) Migration of non-dividing CAL33 cells (n≥100) in cohorts was monitored by time-lapse videomicroscopy, 12 h after seeding on plastic or TIF-derived ECM. Images were acquired every 5 min for 24 h. Representative tracings (denoted by different grey levels) from origin of CAL33 cell cohort migration on plastic (No coat) or ECM are shown. (d) Tracks with different directionality ratios were simulated (mean square displacement (MSD) versus time), as described in Methods, and analysed in the same way as experimental data. (e) Histograms depict the velocity and directionality of cell movement on plastic (No coat) or ECM. For directionality, the confidence interval is measured as defined by MATLAB in the fit function (see ‘Analysis of cell migration' in Methods). Statistically significant data are indicated by *P<0.05, **P<0.01, ***P<0.001 or ****P<0.0001. If no statistical difference, error bars are shown at 95%. Results from a representative experiment, of at least three, are shown.
Figure 4
Figure 4. FN expression by TIFs is essential for matrix assembly and cell cohort migration.
(a) Western blot of FN in conditioned medium (top) and lysates (bottom) of TIF-derived cells stably expressing a control (Sh Cont) or FN-targeting shRNA (sh FN1) grown in presence of serum (FCS) or plasma FN-depleted serum (dFCS). Erk1/2 was monitored as loading control. (b) Left: phase-contrast images of de-cellularized ECM produced by control or FN-deficient TIFs cultured in medium supplemented with FN-depleted serum (scale bar, 150 μm); right: immunofluorescence staining of FN and collagen I fibrils in the ECM (scale bar, 15 μm). (c) Phase-contrast images and fluorescence staining, as in b, of TIF-derived matrix assembled by TIFs cultured in presence (+AA) or absence (−AA) of ascorbic acid. (d) Representative trackings of cells (n≥100, denoted by different grey levels) within clusters seeded on ECM generated by TIFs cultured in presence (+AA) or absence (−AA) of ascorbic acid. (e) Histograms depicting the speed and directionality of movement from a representative experiment of three are shown. Statistical methods for analysis of cell migration data are described in Methods. If no statistical difference, error bars are shown at 95%. Results from a representative experiment, of at least three, are shown.
Figure 5
Figure 5. αvβ6 Integrin regulates collective cell migration on TIF-derived ECM.
(a) Surface staining (mean fluorescence intensity) of the indicated integrins was determined by flow cytometry. (be) Cells were allowed to adhere to ECM for 12 h before addition of the indicated blocking antibody. (b,d) Tracking of cells (denoted by different grey levels) within clusters seeded on TIF-derived ECM was performed for 6 h following addition, or not (Control), of blocking antibodies: anti-α5β1 (10 μg ml−1, clone JBS5) anti-αvβ6 (45 μg ml−1, Stromedix 6.3G9) anti-αvβ5 (20 μg ml−1, clone P1F6), 5 μg ml−1 of the S36578-2 αv integrin antagonist. (c,e) Histograms depict the velocity and directionality of movement. Statistical methods for analysis of cell migration data are described in Methods. Results from a representative of at least three independent experiments are shown.
Figure 6
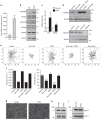
Figure 6. αvβ6 Integrin-dependent collective cell migration is independent of TGF-β activation.
(a) Total TGF-β1 secreted by CAL33 cells plated on non-coated plastic dishes (NC) or TIF-derived matrix (ECM) was measured by ELISA (mean ±s.d. from three independent experiments). (b) Western blotting of Smad2 (Ser465/467) and Smad3 (Ser423/425) phosphorylation and (c) qPCR analysis (mean ±s.d. from three independent experiments) of Pai1 and TGFBI mRNA expression in cells seeded for 36 h on ECM, versus plastic (No coat) dishes (*P<0.05). (d) Western blot analysis of cell lysates from cells plated on ECM for 12 h and treated for 24 h with no addition (Control) or blocking antibodies to αvβ6 (45 μg ml−1), αvβ5 (20 μg ml−1), β1 (10 μg ml−1) or S 36578-2 (5 μM), TGF-β1 (5 ng ml−1) or TGFβRI inhibitor SB-431542 (10 μM). (e) Representative tracings of cells in clusters migrating on ECM (denoted by different grey levels) in the absence (Control) or presence of the indicated blocking antibody added 12 h after seeding. (f) Histograms depict the corresponding velocity and directionality of movement. See Methods for statistical analysis of migration data. Results from a representative experiment, of at least three, are shown. (g) Representative phase contrast images of CAL33 cells on plastic in the absence (Control) or presence (48 h) of TGF-β1 (5 ng ml−1). Scale bar, 150 μm. (h) Western blotting of histone H3 phosphorylation on serine10 in lysates from non-treated (Control) or TGF-β1-treated CAL33 cells. (i) Western blot analysis of histone H3 phosphorylation on serine ten in lysates from CAL33 cells plated on ECM for 12 h.
Figure 7
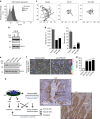
Figure 7. The β1-based integrin α9β1 regulates motility of HNSCC cohorts on ECM.
(a) Mean fluorescence intensity of α9β1 integrin expression on the surface of CAL33 cells was determined by flow cytometry (anti-α9β1 Clone Y9A2) in cells plated for 12 h on non-coated plastic (No coat) or TIF-derived ECM, as indicated; isotype control is shown by a light grey histogram. Data are representative of FACS analysis results from three independent experiments. (b) Western blotting of α9 integrin subunit expression in lysates of cells plated for 12 h on non-coated plastic (NC) or ECM. (c) Representative tracings from origin (denoted by different grey levels) and (d) histograms showing the velocity and directionality of CAL33 cell migration (n≥100 cells) on TIF-derived ECM in the absence (Control) or presence of function blocking antibodies to α9β1 (10 μg ml−1, clone Y9A2) or β1 (10 μg ml−1, clone P5D2) integrins. Results from three experiments are shown; see Methods for description of statistical analysis. (e) Western blotting of lysates from CAL33 cells expressing control (Control shRNA) or three different α9-targeting shRNA sequences. Erk1/2 was monitored as loading control. (f) Motion analysis of control or the indicated α9-depleted CAL33 cells on TIF-derived ECM. Average of stacked phase contrast images from videomicroscopy 0–12 h after plating. Static components are in greyscale (static cells are framed in blue); cell motion is coloured chronologically. Scale bar, 150 μm. (g) Quantification of static cells (mean ±s.d. from three fields) expressing three different shRNA sequences. Results from one of three independent experiments are shown. Statistically significant data are indicated by *P<0.05, **P<0.01, ***P<0.001 or ****P<0.0001. (h) Left: schematic summary of our results and (right) representative staining of αvβ6 and α9 in human HNSCC samples.

Similar articles

Cited by

References

    1. Cancer Genome Atlas, N. Comprehensive genomic characterization of head and neck squamous cell carcinomas. Nature 517, 576–582 (2015). - PMC - PubMed
    1. Leemans C. R., Braakhuis B. J. & Brakenhoff R. H. The molecular biology of head and neck cancer. Nat. Rev. Cancer 11, 9–22 (2011). - PubMed
    1. Hynes R. O. The extracellular matrix: not just pretty fibrils. Science 326, 1216–1219 (2009). - PMC - PubMed
    1. Kalluri R. & Zeisberg M. Fibroblasts in cancer. Nat. Rev. Cancer 6, 392–401 (2006). - PubMed
    1. Levental K. R. et al.. Matrix crosslinking forces tumor progression by enhancing integrin signaling. Cell 139, 891–906 (2009). - PMC - PubMed

Publication types