Review
. 2017 Jan 18;541(7637):331-338.
doi: 10.1038/nature21350.

Scaling single-cell genomics from phenomenology to mechanism

Affiliations
Review

Scaling single-cell genomics from phenomenology to mechanism

Amos Tanay et al. Nature. .

Abstract

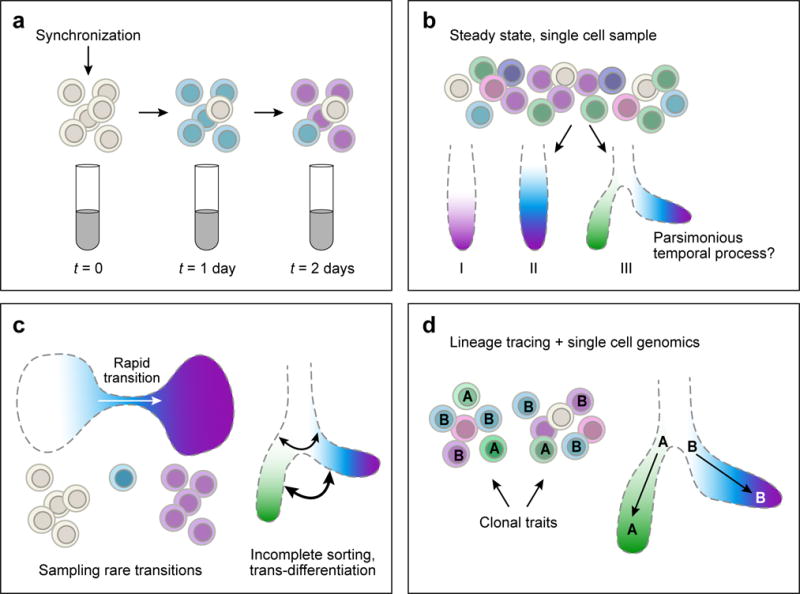
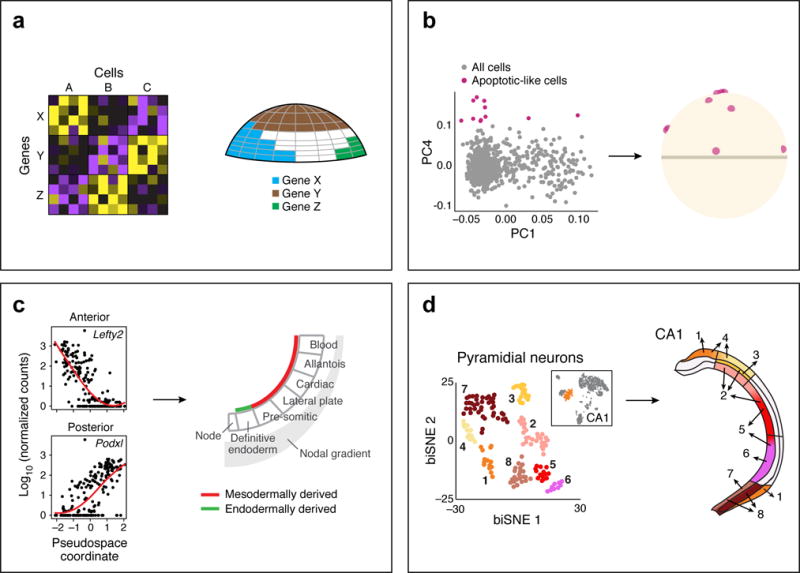
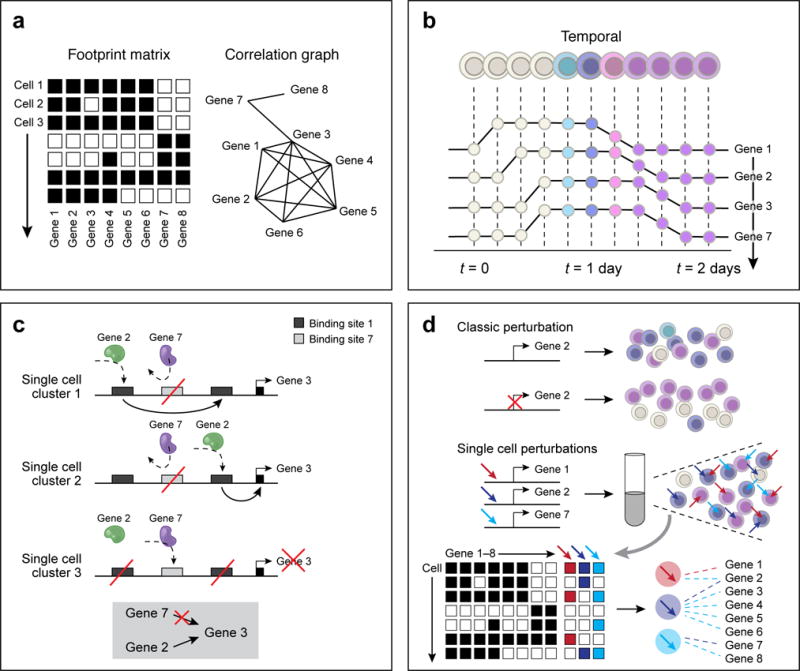
Three of the most fundamental questions in biology are how individual cells differentiate to form tissues, how tissues function in a coordinated and flexible fashion and which gene regulatory mechanisms support these processes. Single-cell genomics is opening up new ways to tackle these questions by combining the comprehensive nature of genomics with the microscopic resolution that is required to describe complex multicellular systems. Initial single-cell genomic studies provided a remarkably rich phenomenology of heterogeneous cellular states, but transforming observational studies into models of dynamics and causal mechanisms in tissues poses fresh challenges and requires stronger integration of theoretical, computational and experimental frameworks.


Figures

Figure 1
Figure 1. The temporal axis
(a) Bulk assays sample cell populations that progressively lose synchrony, limiting the precise inference of the temporal dynamics. (b) Sampling of a single heterogenous mixture of single cells in different states can be used to infer temporal dynamics based on a maximum parsimony principle, where the sampled cells are organized along a linear or tree-like process, such that differences in the molecular profiles of the sampled cells are captured fatefully by the inferred topology. (c) The maximum parsimony approach for inferring temporal dynamics from single cell samples is challenged when transition between frequent states are rare (left), or when cells undergo complex, non-hierarchical, or non-deterministic dynamics (right). In either case, the maximum parsimony model for the data may become under-determined. (d) Adding anchor points, such as known stem cell states or differentiated states, may help distinguishing between different alternative dynamical models in single cell data. Experimental information on the clonal relationship within a single cell sample can lead to correct identification of a bifurcation process as illustrated schematically here.
Figure 2
Figure 2. The spatial axis
(a) Spatial mapping takes as input single cell profiles (left) and a reference map of the spatial expression patterns of a small number of landmark genes. The expression of the landmark genes in the cells is used to determine the spatial position of the entire cell. (b–d) Examples of successful spatial mapping in the early fish embryo (b) (adapted from ), where a few cells, with a distinct apoptotic-like profile, were mapped to a salt-and-pepper pattern; in the early mesoderm, where single cell expression can define an anterior-posterior pseudospace (adapted from ); and in the hippocampus (d) where pyramidal neuron cell clusters from the CA1 region map along lateral-medial and anterior-posterior axis (adapted from ).
Figure 3
Figure 3. The mechanism axis
(a) Inference through co-variation across single cells. Using expression profiles for regulators and targets (left, columns) across cells (rows), a correlation graph (right) is constructed between genes and identify candidate regulators. With increasing number of cells, the correlation approach can help exclude putative regulatory relationships, if they are inconsistent with observing states. In the schematic example, gene 7 is unlikely to regulate genes 1,2,4,5, or 6, but may regulate genes 3 and 8. (b) Inference through temporally resolved single cell data. Putative regulatory interactions are identified as time lags between the activity profiles of regulators and their potential targets. In the schematic example, the data suggest that gene 7 is unlikely to regulate gene 3. (c) Refinement of regulatory models with epigenetic information. A schematic depiction of a regulatory region around gene 3, including three putative enhancer elements that are targeted by two putative regulators, encoded by genes 2 and 7. Pooled single cell epigenomics data identifies two states: (1) gene 3 is active and targeted by gene 2, and (2) gene 3 is inactive and targeted by gene 7, suggesting together, that gene 2, but not gene 7, is activating gene 3. (d) Causal inference of regulatory models by perturbations. Top: Perturbation experiments of specific genes, followed by single cell profiling help determine causal relationships. Bottom: Perturbations performed in a pool, combinatorially for multiple loci, followed by single cell monitoring of both the perturbation and its effect on transcription, with enhanced power for causal inference.

References

    1. Okabe Y, Medzhitov R. Tissue biology perspective on macrophages. Nature immunology. 2016;17:9–17. doi: 10.1038/ni.3320. - DOI - PubMed
    1. Mayr E. The Growth of Biological Thought: Diversity, Evolution, and Inheritance. Belknap Press; 1982.
    1. Szathmary E, Maynard-Smith J. The Major Transitions in Evolution. Oxford; Univeristy Press: 1995.
    1. Gould SJ. Ontogeny and Phylogeny. Belknap Press; 1977.
    1. Richardson L, et al. EMAGE mouse embryo spatial gene expression database: 2014 update. Nucleic acids research. 2014;42:D835–844. doi: 10.1093/nar/gkt1155. - DOI - PMC - PubMed

Publication types