. 2017 Jan 19:7:40790.
doi: 10.1038/srep40790.

Neural Correlates of Speech Segregation Based on Formant Frequencies of Adjacent Vowels

Affiliations

Neural Correlates of Speech Segregation Based on Formant Frequencies of Adjacent Vowels

Claude Alain et al. Sci Rep. .

Abstract

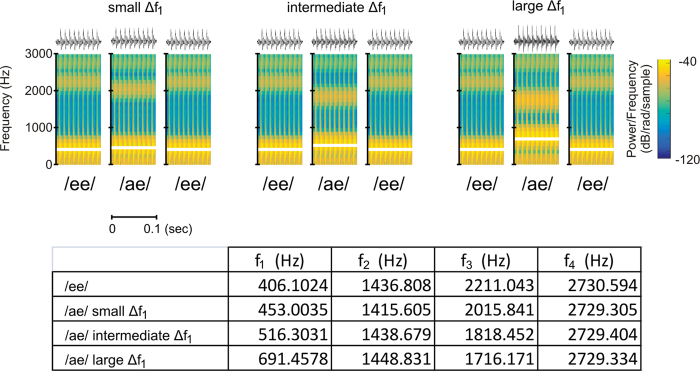
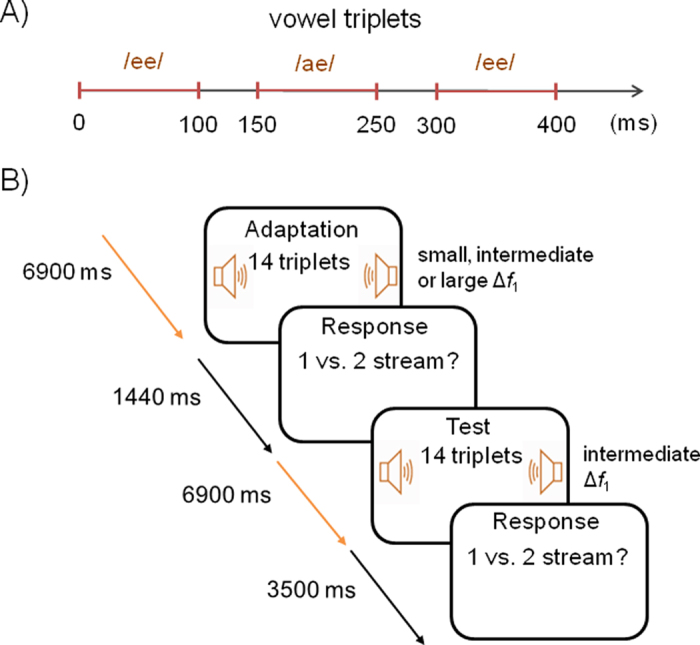
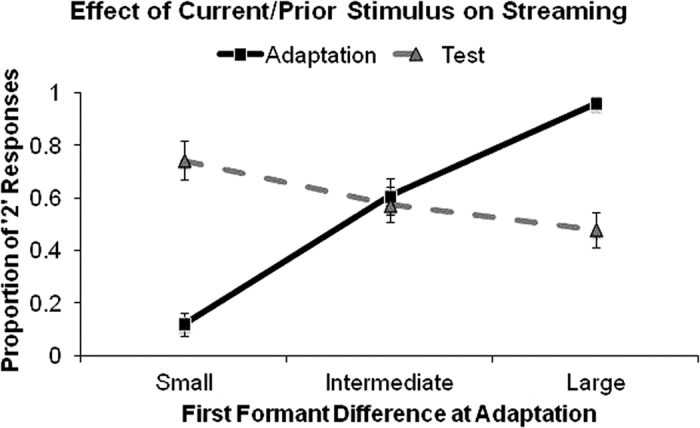
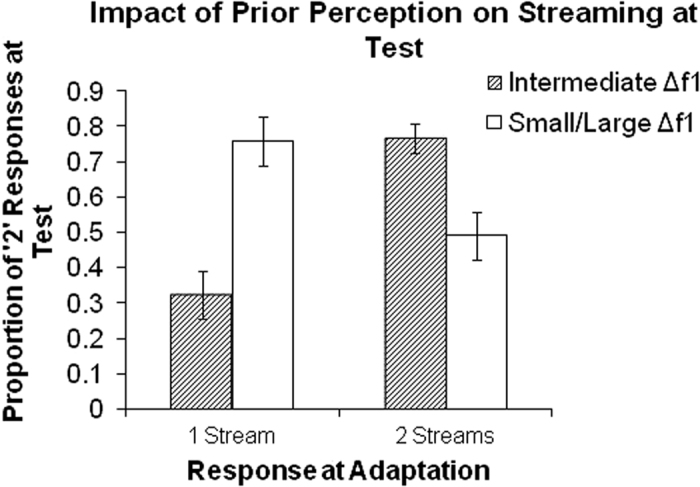
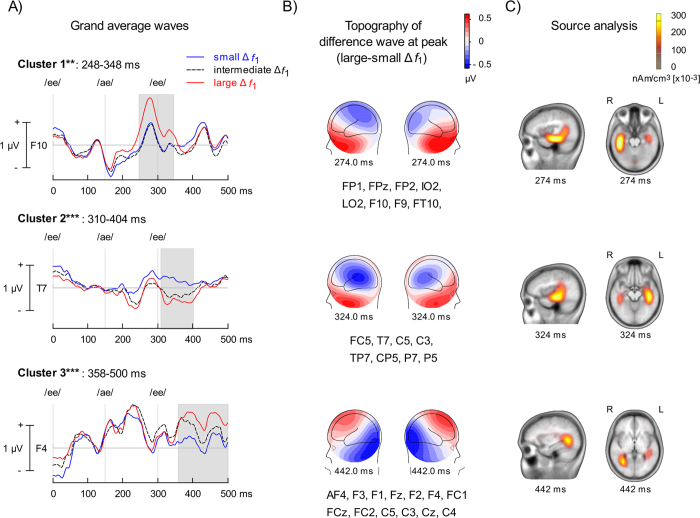
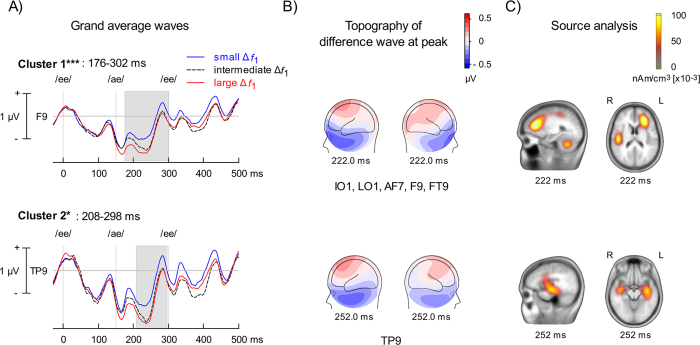
The neural substrates by which speech sounds are perceptually segregated into distinct streams are poorly understood. Here, we recorded high-density scalp event-related potentials (ERPs) while participants were presented with a cyclic pattern of three vowel sounds (/ee/-/ae/-/ee/). Each trial consisted of an adaptation sequence, which could have either a small, intermediate, or large difference in first formant (Δf1) as well as a test sequence, in which Δf1 was always intermediate. For the adaptation sequence, participants tended to hear two streams ("streaming") when Δf1 was intermediate or large compared to when it was small. For the test sequence, in which Δf1 was always intermediate, the pattern was usually reversed, with participants hearing a single stream with increasing Δf1 in the adaptation sequences. During the adaptation sequence, Δf1-related brain activity was found between 100-250 ms after the /ae/ vowel over fronto-central and left temporal areas, consistent with generation in auditory cortex. For the test sequence, prior stimulus modulated ERP amplitude between 20-150 ms over left fronto-central scalp region. Our results demonstrate that the proximity of formants between adjacent vowels is an important factor in the perceptual organization of speech, and reveal a widely distributed neural network supporting perceptual grouping of speech sounds.


Figures

Figure 1
Figure 1. Top.
Spectograms of the vowels used during small, intermediate and large difference in first formant frequency (Δƒ1). The white horizontal lines highlight first formant frequency within the spectrogram. Bottom. Table showing the actual frequency of the first, second, third and fourth formants for the vowel /ee/ and /ae/ for small, intermediate and larger Δƒ1.
Figure 2
Figure 2
(A) Graphical depiction of vowel pattern. Each triplet lasted 400 ms and contained three vowels. The interval between triplets was 100 ms. When the first formant difference between consecutive vowels was small, the sequence was usually heard as a single galloping rhythm. (B) Schematic of a trial. Each trial consisted of an adaptation sequence of 14 triplets followed by a test sequence of 14 triplets, each requiring the participant to make a response immediately after the sequence indicating whether one stream or two streams were perceived.
Figure 3
Figure 3. Effects of first formant differences on perception of streaming during the adaptation and test phase.
Note that the difference in first formant frequency between adjacent vowels presented at test is always intermediate. Error bars represent standard error of the mean.
Figure 4
Figure 4. Effect of perception during adaptation on streaming reports at test for ambiguous (intermediate ∆f1) and non-ambiguous (small/large ∆f1) adaptation sequences.
For comparison, we show the proportion of trials perceived as two streams depending on perception after the adaptation. Error bars represent standard error of the mean.
Figure 5
Figure 5. Adaptation phase.
(A) Group mean event-related potentials (ERPs) time-locked on triplet onset when the difference between the first formant (Δf1) was small (blue) or large (red). Vertical lines indicate the onsets of the corresponding vowel in the triplet. Note that baseline correction was applied prior to the /ae/ vowel rather than triplet onset to emphasize transient changes in neural activity following the changes in Δf1. Three ERP modulations (i.e., clusters) were identified. The third cluster shows difference at the triplet onset, which likely reflects residual Δf1-related changes in ERP amplitude from the previous triplet. Each panel shows the recording site (i.e., electrode) where the difference was largest for each cluster. The shaded area reveals the time window that was significantly different within each cluster. (B) Left and right views of iso-contour maps showing the peak of the ERP modulation as revealed by the difference in ERPs elicited by small and large Δf1. The electrodes showing significant effects of Δf1 are listed below the contour maps. The blue color refers to negative voltage while the red color indicates positive voltage. (C) Cortical Low resolution electromagnetic tomography Analysis Recursively Applied (CLARA, BESA version 6.1) at each peak activity identified in the cluster analysis. **p < 0.01, ***p < 0.001.
Figure 6
Figure 6. Test phase.
(A) Group mean event-related potentials (ERPs) time-locked on triplet onset when the test sequence was preceded by small or large difference between the first formant (Δf1). Vertical lines indicate the onsets of the corresponding vowel in the triplet. Note that baseline correction was applied prior to the triplet onset. Two ERP modulations (i.e., clusters) were identified. The top and bottom panels show the recording site (i.e., electrode) where the difference was largest for each cluster. The shaded area revealed the time window that was significantly different within each cluster. (B) Left and right views of iso-contour maps showing the peak of the ERP modulation as revealed by the difference in ERPs at test when preceded by small and large Δf1. The electrodes showing significant effects of Δf1 are listed below the contour maps. The blue color refers to negative voltage while the red color indicates positive voltage. (C) Cortical Low resolution electromagnetic tomography Analysis Recursively Applied (CLARA, BESA version 6.1) at each peak activity identified in the cluster analysis. *p < 0.05, ***p < 0.001.
Figure 7
Figure 7. Scatterplots displaying the Pearson correlations (y axis) between participants’ perception of streaming and event-related potential (ERP) mean amplitude for the adaptation sequence.
For each cluster, the mean amplitude measurements (50 ms centered on the peak latency) included all electrodes from the cluster (see Fig. 5).

References

    1. Snyder J. S. & Gregg M. K. Memory for sound, with an ear toward hearing in complex auditory scenes. Atten Percept Psychophys 73, 1993–2007 (2011). - PubMed
    1. Ding N. & Simon J. Z. Emergence of neural encoding of auditory objects while listening to competing speakers. Proceedings of the National Academy of Sciences of the United States of America 109, 11854–9 (2012). - PMC - PubMed
    1. Alain C. & Arnott S. R. Selectively attending to auditory objects. Front Biosci 5, D202–12 (2000). - PubMed
    1. Alain C. & Winkler I. Recording event-related brain potentials: Application to study auditory perception. In Human Auditory Cortex (eds Poeppel D., Overath T., Popper A. & Fay R. R.) 69–96 (Springer, 2012).
    1. Dorman M. F., Cutting J. E. & Raphael L. J. Perception of temporal order in vowel sequences with and without formant transitions. J Exp Psychol Hum Percept Perform 104, 147–53 (1975). - PubMed

Publication types

Grants and funding

LinkOut - more resources