. 2017 Jan 19:7:40771.
doi: 10.1038/srep40771.

Dynamic modeling of uteroplacental blood flow in IUGR indicates vortices and elevated pressure in the intervillous space - a pilot study

Affiliations

Dynamic modeling of uteroplacental blood flow in IUGR indicates vortices and elevated pressure in the intervillous space - a pilot study

Christian J Roth et al. Sci Rep. .

Abstract

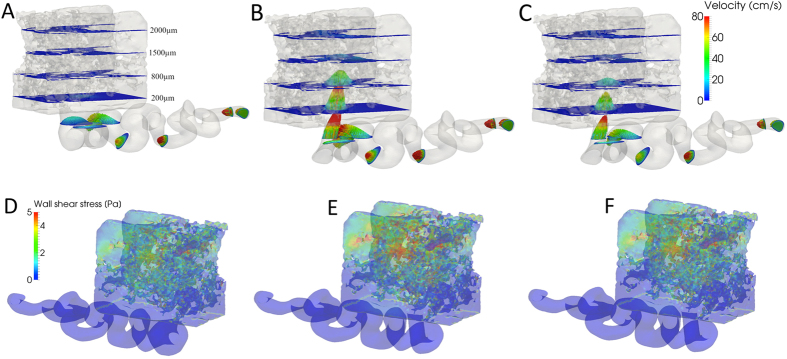
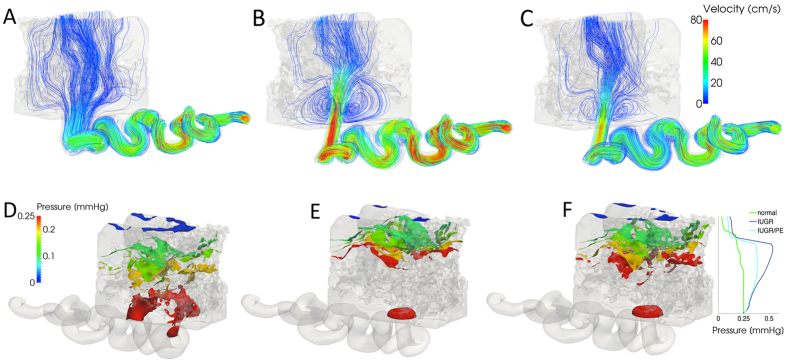
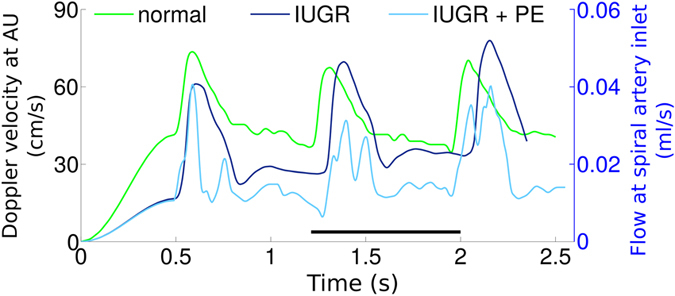
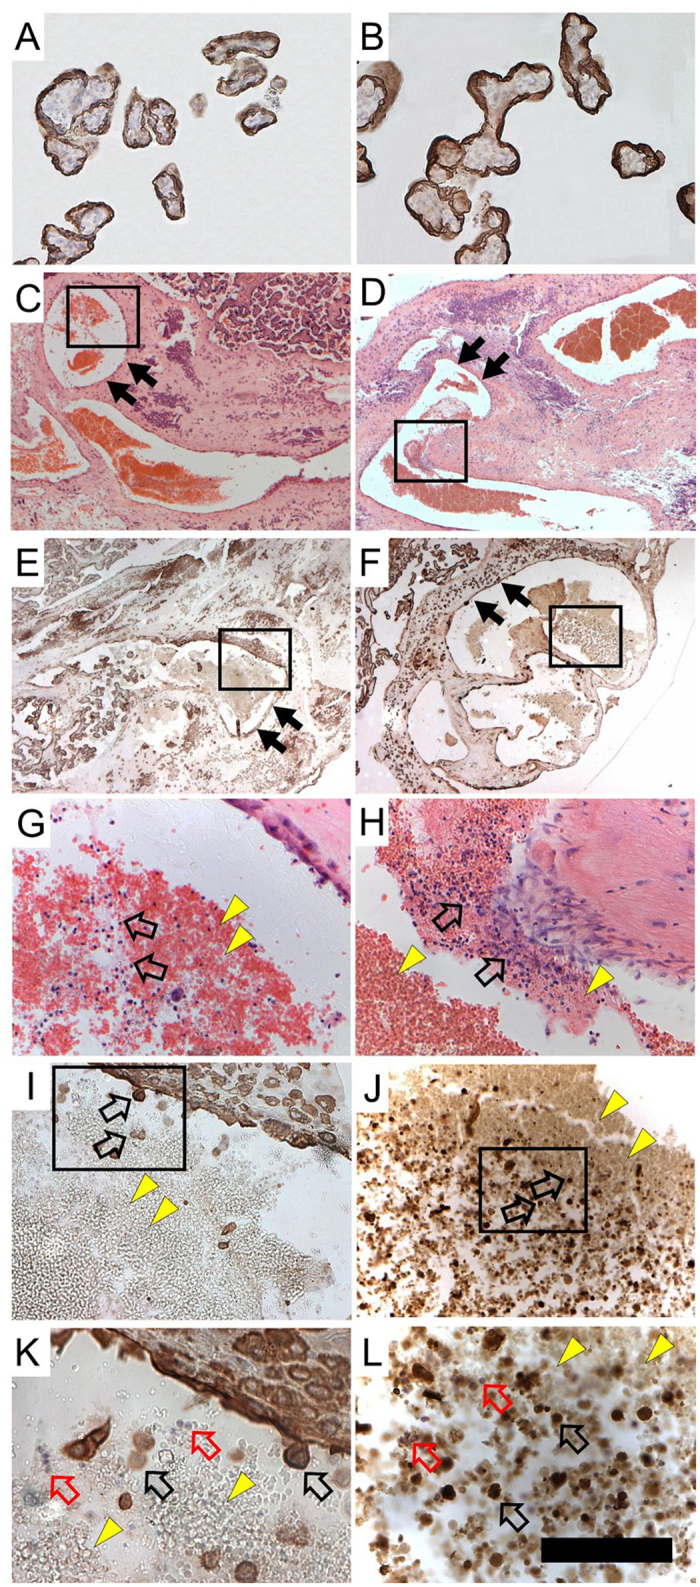
Ischemic placental disease is a concept that links intrauterine growth retardation (IUGR) and preeclampsia (PE) back to insufficient remodeling of uterine spiral arteries. The rheological consequences of insufficient remodeling of uterine spiral arteries were hypothesized to mediate the considerably later manifestation of obstetric disease. However, the micro-rheology in the intervillous space (IVS) cannot be examined clinically and rheological animal models of the human IVS do not exist. Thus, an in silico approach was implemented to provide in vivo inaccessible data. The morphology of a spiral artery and the inflow region of the IVS were three-dimensionally reconstructed to provide a morphological stage for the simulations. Advanced high-end supercomputing resources were used to provide blood flow simulations at high spatial resolution. Our simulations revealed turbulent blood flow (high-velocity jets and vortices) combined with elevated blood pressure in the IVS and increased wall shear stress at the villous surface in conjunction with insufficient spiral artery remodeling only. Post-hoc histological analysis of uterine veins showed evidence of increased trophoblast shedding in an IUGR placenta. Our data support that rheological alteration in the IVS is a relevant mechanism linking ischemic placental disease to altered structural integrity and function of the placenta.


Figures

Figure 1
Figure 1. The tiles of the figure each show the entire morphological stage of the model as a light gray background, including the spiralized uterine artery in the lower part and the cuboid block of the proximal IVS in the upper part of each tile.
(A and D) show the model of the clinically normal situation with a dilated arterial opening, (B and E) the model of the situation in IUGR, and (C and F) the model of the situation in IUGR/PE. (AF) show simulated blood flow at the point of maximum systolic flow of a maternal heart cycle. (A–C) show blood velocity vectors, which are color-coded from low (blue) to high (red) velocity; the velocity color scale is shown in C (right to the proximal IVS). The proximal IVS cuboids of (AC) contain blue planes that mark the distance from the arterial opening (scale shown in (A) right of the proximal IVS). In (A) the velocity decreases at the arterial opening, with dominating blue colors at the arterial opening. In (B) and less pronounced in (C) the velocity accelerates at the arterial opening, forming a velocity jet that projects deeply into the proximal IVS. (DF) show wall shear stress; the color scale for (DF) (in Pa) is shown in (D) (left of the proximal IVS). In the clinically normal situation (D), there are moderate to low values of wall shear stress at the villous surface in the proximal IVS. In (E) and less pronounced in (F) the wall shear stress is elevated in central parts of the proximal IVS, as indicated by more red colors appearing at the villous surface.
Figure 2
Figure 2. The tiles of the figure each show the entire morphological stage of the models as a light gray background, including the spiralized uterine artery in the lower part and the cuboid block of the proximal IVS in the upper part in each tile.
(AF) show the situation in the models at the point of maximum systolic flow of a maternal heart cycle. (A and D) show the model of the clinically normal situation with a dilated arterial opening, (B and E) show the model of the situation in IUGR, and (C and F) show the model of the situation in IUGR/PE. In (AC) streamlines visualize the course of individual erythrocytes with the velocity color coded along the streamlines; the velocity color scale is shown in (C) (right of the proximal IVS). In (A) the streamlines run smoothly without turbulence at low speed from the arterial opening into the proximal IVS. In (B) and less pronounced in (C) the streamlines show the development of vortices in immediate proximity of the arterial opening. (DF) show color-coded iso-pressure surfaces, which are spaced by an interval of 0.05 mm Hg; the color scale for (DF) (in mm Hg) is shown in (D) (left of the proximal IVS). In the clinically normal situation (D), the pressure decreases evenly through the proximal IVS toward the upper boundary (at the upper boundary, the pressure is defined as zero). In E and less pronounced in (F) the pressure remains elevated in a large part of the proximal IVS and then rapidly drops toward the upper boundary by compressing the iso-pressure surfaces at a short distance. The insert right of the proximal IVS in (F) visualizes the course of pressure along individual streamlines between the arterial opening and upper boundary for all three models.
Figure 3
Figure 3. The figure shows Doppler ultrasound waveforms over time measured at the uterine artery from clinically normal (normal; green), intrauterine growth restriction (IUGR; blue), and intrauterine growth restriction with preeclampsia (IUGR/PE; light blue) pregnancies.
Time is shown on the x-axis, Doppler flow velocity in the uterine artery is shown on the left y-axis, and flow at the spiral artery inlet is shown on the right y-axis. Flow velocity in cm/s is the original output of the ultrasound analysis; flow velocity in ml/s is calculated from the original ultrasound data using the diameter of the respective arteria uterina. The entire waveforms were used to feed the dynamic flow model of the present study, and the interval of 1.2 to 2.0 s (indicated by the black bar in the upper panel) was used for extraction of the evaluation data.
Figure 4
Figure 4
Photomicrographs of histological sections of a clinically normal placenta (A,E,G,I,K) and an IUGR placenta (B,D,F,H,J,L) showing villi and veins (embedded in intercotyledonary septa) in a plane parallel to the chorionic plate (A,B). Villous sections of a clinically normal (A) and an IUGR (B) placenta demonstrate specific labeling of trophoblast by cytokeratin 7 (CK7). (CF) Tissue sections of veins (the vein walls are marked with black arrows) of a clinically normal (C,E) and an IUGR (D,F) placenta in low power overview. Sections shown in (C,D) were stained with hematoxylin-eosin (H,E), and sections shown in (E,F) were processed with immunohistochemistry using an anti-CK7 primary antibody. The black squares in (CF) mark the regions shown at higher magnification in (GJ). The square in (C) corresponds to (G) the one in (D) corresponds to (H) the one in (E) corresponds to (I) and the square in (F) corresponds to (J). (GJ) Cells inside the veins of a clinically normal (G,I) and an IUGR (H,J) placenta. (G,H) Cells inside the veins stained with HE and (I,J) CK7 positive cells are shown. Yellow arrow heads mark erythrocytes, and clear arrows mark isolated mononuclear cells. The black squares in (I and J) mark the regions shown at even higher magnification in (K and L). The square in I corresponds to (K) and the square in (J) corresponds to (L). (K,L) Cells inside the veins of a clinically normal (K) and an IUGR (L) placenta. Yellow arrowheads mark erythrocytes, clear red arrows mark isolated mononuclear cells and clear black arrows mark CK7 positive particles, putatively trophoblast shedding. The scale bar in (L) is 50 μm in (K,L), 100 μm in (A,B,GJ) and 800 μm in (C–F).

References

    1. Ananth C. V. Ischemic placental disease: A unifying concept for preeclampsia, intrauterine growth restriction, and placental abruption. Ischemic placental disease. Semin Perinatol. 38, 131–132 (2014). - PubMed
    1. Ananth C. V. & Friedman A. M. Ischemic placental disease and risks of perinatal mortality and morbidity and neurodevelopmental outcomes. Semin Perinatol. 38, 151–158 (2014). - PubMed
    1. Parker S. E. & Werler M. M. Epidemiology of ischemic placental disease: A focus on preterm gestations. Ischemic placental disease. Semin Perinatol. 38, 133–138 (2014). - PMC - PubMed
    1. Rath W. Geburtshilfe und Perinatologie. 2nd ed. (Thieme, Stuttgart, 2010).
    1. Chaddha V., Viero S., Huppertz B. & Kingdom J. Developmental biology of the placenta and the origin of placental insufficiency. Semin Fetal Neonatal Med. 9, 57–69 (2004). - PubMed

LinkOut - more resources