. 2017 Jan 19:7:40877.
doi: 10.1038/srep40877.

Lasing in Live Mitotic and Non-Phagocytic Cells by Efficient Delivery of Microresonators

Affiliations

Lasing in Live Mitotic and Non-Phagocytic Cells by Efficient Delivery of Microresonators

Marcel Schubert et al. Sci Rep. .

Abstract

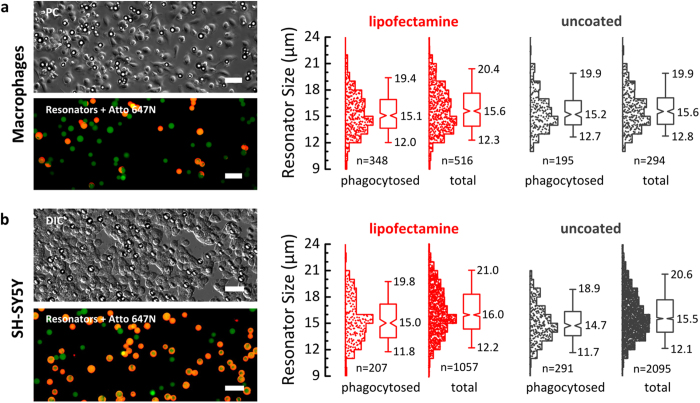
Reliable methods to individually track large numbers of cells in real time are urgently needed to advance our understanding of important biological processes like cancer metastasis, neuronal network development and wound healing. It has recently been suggested to introduce microscopic whispering gallery mode lasers into the cytoplasm of cells and to use their characteristic, size-dependent emission spectrum as optical barcode but so far there is no evidence that this approach is generally applicable. Here, we describe a method that drastically improves intracellular delivery of resonators for several cell types, including mitotic and non-phagocytic cells. In addition, we characterize the influence of resonator size on the spectral characteristics of the emitted laser light and identify an optimum size range that facilitates tagging and tracking of thousands of cells simultaneously. Finally, we observe that the microresonators remain internalized by cells during cell division, which enables tagging several generations of cells.


Figures

Figure 1
Figure 1. Internalization assay reveals resonator uptake by different cell types.
(a) Representative images from a bioassay for quantification of resonator uptake efficiency in SH-SY5Y cells. DIC microscopy overview image (left), green bulk fluorescence of WGM resonators (center) and red fluorescence from surface staining by the cell-impermeable Atto 647N-streptavidin conjugate (right). White dashed circles and white arrows indicate the position of phagocytosed resonators. (b) Overlay of phase contrast (greyscale) with fluorescence microscopy images for N7, HEK 293 and NIH 3T3 cells. Phagocytosed resonators appear green while extracellular resonators appear yellow-orange due to the overlap of the bulk fluorescence (green channel) with the Atto 647 N surface staining (red channel). Scale bars: 50 μm.
Figure 2
Figure 2. Uptake efficiency of uncoated (grey) and lipofectamine coated (red) WGM resonators for different cell types as determined by the internalization bioassay.
(a) Primary human macrophages, epithelial (Hela), fibroblast (NIH 3T3) and HEK 293 cells. (b) Cells from the nervous system, including primary mouse astrocytes and neuronal cell lines N7 and SH-SY5Y. Unless indicated otherwise, uptake efficiencies were determined after 4 h of incubation. Error bars represent standard error of the mean. Two sample t-test is used to evaluate statistical significance (****p < 0.0001; n.s. = not significant). The number at each column indicates the number of resonators analyzed.
Figure 3
Figure 3. Size dependence of resonator uptake.
(a) Primary human macrophages and (b) SH-SY5Y cells. Left: Representative microscopy images of uptake experiments. Right: Histograms and statistical analysis of resonator size for phagocytosed resonators and for the entire resonator sample (total = phagocytosed + external). n indicates number of resonators for each histogram. Box plots show lower and upper quartile, and notches represent 95% confidence interval for the median at the center of the notch. Whiskers extend to 5th and 95th percentile (Altman style). Median size and sizes at 5%/95% percentile are listed. Scale bars: 50 μm.
Figure 4
Figure 4. Effect of resonator size on lasing characteristics.
(a) Comparison of emission spectra of resonators phagocytosed by SH-SY5Y cells on a logarithmic intensity scale (left) and linear scale (right). The resonator diameter is indicated for each spectrum. For the 8.56 μm resonator no lasing is observed and the experimentally observed (grey line) and simulated (red line) linewidths increase drastically. (b) Simulated free spectral range (FSR) and (c) Q factor (dashed lines) as function of resonator diameter. Symbols mark the resonator diameters given in (a). In the simulation, refractive indices of nPS = 1.6 and ncell = 1.37 were assumed for the resonator and the cell, respectively.
Figure 5
Figure 5. Long-term tracking of 3T3 fibroblasts over several cell generations.
Mother cells are denoted as A (red) and subsequent daughter generations are labeled with B (blue), C (violet) and D (orange), respectively. (a) Left: DIC images of WGM laser within migrating cell, before, during and after three cycles of cell division. The times indicated in the images are in h:min and represent the time after acquisition of the first lasing spectrum. Right: Corresponding lasing spectra of the WGM resonator recorded during migratory period, i.e. between cell divisions. Arrows mark FSR between two neighboring TE modes. (b) Left: Tagging of both daughter cells (B1 and B2) from a mother cell carrying two intracellular lasers (R1 and R2). Right: Lasing spectra of resonators inside the mother cell (center, recorded separately for each resonator but plotted together) and after cell division (top/bottom). All DIC images show an area of 100 × 100 μm2.

References

    1. Schermelleh L., Heintzmann R. & Leonhardt H. A guide to super-resolution fluorescence microscopy. J. Cell Biol. 190, 165–175 (2010). - PMC - PubMed
    1. Moffitt J. R., Chemla Y. R., Smith S. B. & Bustamante C. Recent Advances in Optical Tweezers. Annu. Rev. Biochem. 77, 205–228 (2008). - PubMed
    1. Vogt N. Precision optogenetics. Nat. Methods 13, 34–34 (2015).
    1. Packer A. M., Russell L. E., Dalgleish H. W. P. & Häusser M. Simultaneous all-optical manipulation and recording of neural circuit activity with cellular resolution in vivo. Nat. Methods 12, 140–146 (2014). - PMC - PubMed
    1. Polson R. C. & Vardeny Z. V. Random lasing in human tissues. Appl. Phys. Lett. 85, 1289 (2004).

Publication types

LinkOut - more resources