

Tutorial on Biostatistics: Linear Regression Analysis of Continuous Correlated Eye Data
- PMID: 28102741
- PMCID: PMC5597052
- DOI: 10.1080/09286586.2016.1259636
Tutorial on Biostatistics: Linear Regression Analysis of Continuous Correlated Eye Data
Abstract
Purpose: To describe and demonstrate appropriate linear regression methods for analyzing correlated continuous eye data.
Methods: We describe several approaches to regression analysis involving both eyes, including mixed effects and marginal models under various covariance structures to account for inter-eye correlation. We demonstrate, with SAS statistical software, applications in a study comparing baseline refractive error between one eye with choroidal neovascularization (CNV) and the unaffected fellow eye, and in a study determining factors associated with visual field in the elderly.
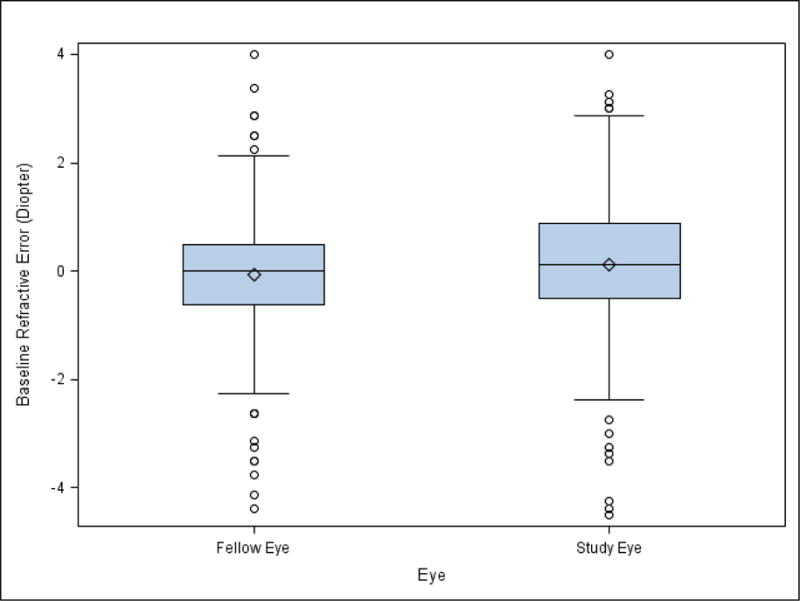
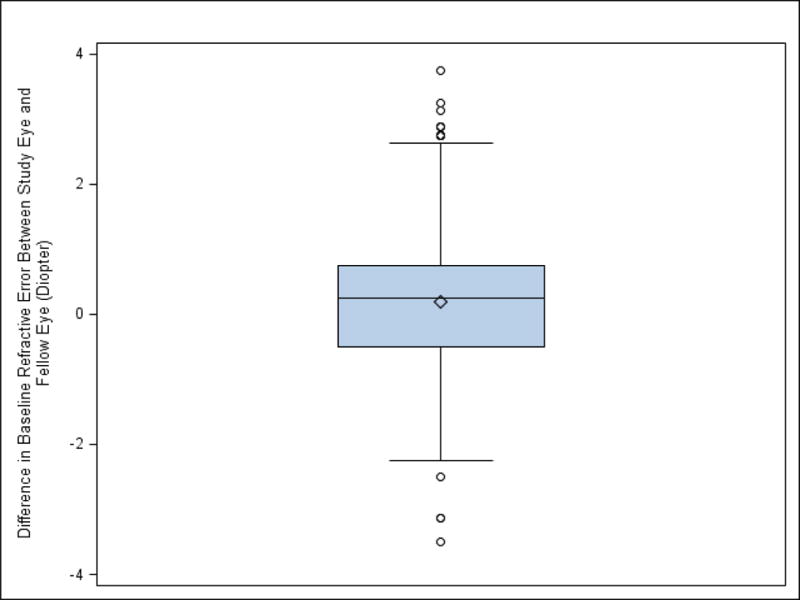
Results: When refractive error from both eyes were analyzed with standard linear regression without accounting for inter-eye correlation (adjusting for demographic and ocular covariates), the difference between eyes with CNV and fellow eyes was 0.15 diopters (D; 95% confidence interval, CI -0.03 to 0.32D, p = 0.10). Using a mixed effects model or a marginal model, the estimated difference was the same but with narrower 95% CI (0.01 to 0.28D, p = 0.03). Standard regression for visual field data from both eyes provided biased estimates of standard error (generally underestimated) and smaller p-values, while analysis of the worse eye provided larger p-values than mixed effects models and marginal models.
Conclusion: In research involving both eyes, ignoring inter-eye correlation can lead to invalid inferences. Analysis using only right or left eyes is valid, but decreases power. Worse-eye analysis can provide less power and biased estimates of effect. Mixed effects or marginal models using the eye as the unit of analysis should be used to appropriately account for inter-eye correlation and maximize power and precision.
Keywords: Correlated data; generalized estimating equations; inter-eye correlation; linear regression models; marginal model; mixed effects model.
Conflict of interest statement
All authors have no conflict of interest disclosure to make.
Figures
References
-
- Armstrong RA. Statistical guidelines for the analysis of data obtained from one or both eyes. Ophthalmic & Physiological Optics. 2013;33:7–14. - PubMed
-
- Laird NM, Ware JH. Random-effects models for longitudinal data. Biometrics. 1982;38:963–74. - PubMed
-
- Liang KY, Zeger SL. Longitudinal data analysis using generalized linear models. Biometrika. 1986;73:13–22.
-
- Liang KY, Zeger SL. Regression analysis for correlated data. Annu. Rev. Pub Health. 1993;14:43–68. - PubMed
Publication types
MeSH terms
Grants and funding
LinkOut - more resources
Full Text Sources
Other Literature Sources
Medical