. 2017 Feb 23;542(7642):498-502.
doi: 10.1038/nature21384. Epub 2017 Jan 19.

Basis of catalytic assembly of the mitotic checkpoint complex

Affiliations

Basis of catalytic assembly of the mitotic checkpoint complex

Alex C Faesen et al. Nature. .

Abstract

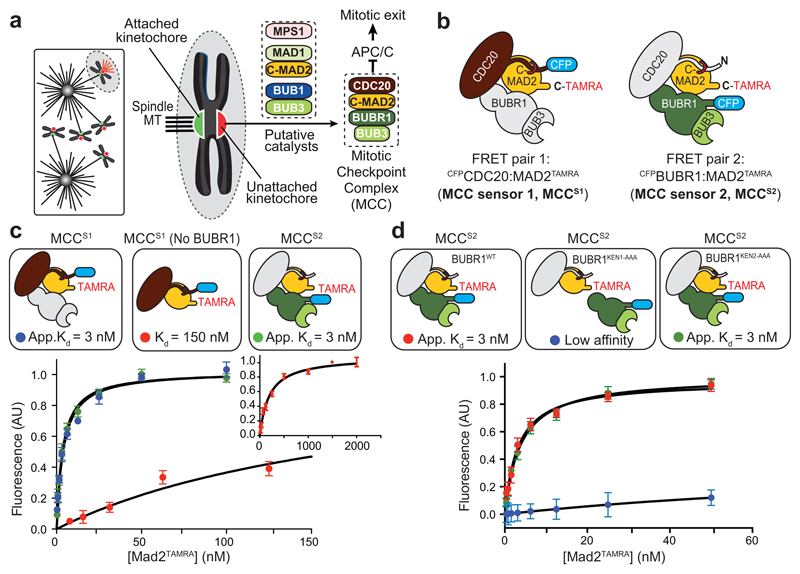
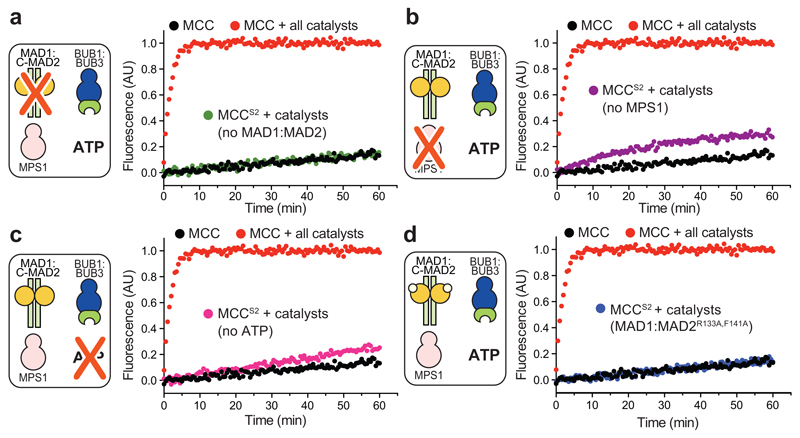
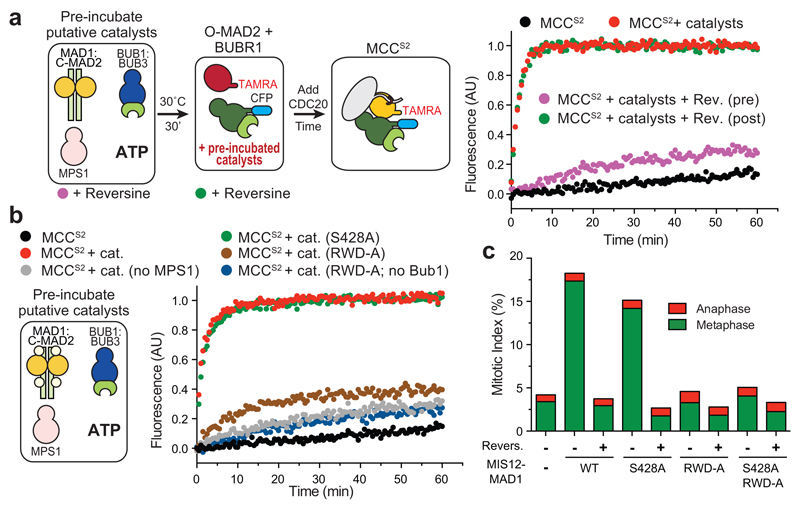
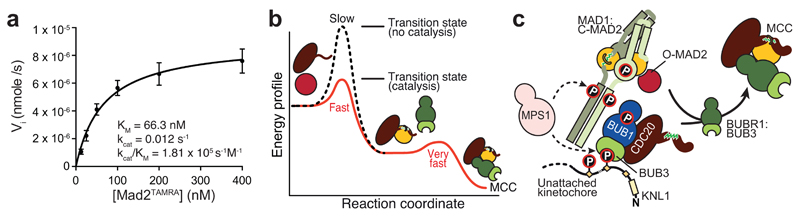
In mitosis, for each daughter cell to inherit an accurate copy of the genome from the mother cell, sister chromatids in the mother cell must attach to microtubules emanating from opposite poles of the mitotic spindle, a process known as bi-orientation. A surveillance mechanism, termed the spindle assembly checkpoint (SAC), monitors the microtubule attachment process and can temporarily halt the separation of sister chromatids and the completion of mitosis until bi-orientation is complete. SAC failure results in abnormal chromosome numbers, termed aneuploidy, in the daughter cells, a hallmark of many tumours. The HORMA-domain-containing protein mitotic arrest deficient 2 (MAD2) is a subunit of the SAC effector mitotic checkpoint complex (MCC). Structural conversion from the open to the closed conformation of MAD2 is required for MAD2 to be incorporated into the MCC. In vitro, MAD2 conversion and MCC assembly take several hours, but in cells the SAC response is established in a few minutes. Here, to address this discrepancy, we reconstituted a near-complete SAC signalling system with purified components and monitored assembly of the MCC in real time. A marked acceleration in MAD2 conversion and MCC assembly was observed when monopolar spindle 1 (MPS1) kinase phosphorylated the MAD1-MAD2 complex, triggering it to act as the template for MAD2 conversion and therefore contributing to the establishment of a physical platform for MCC assembly. Thus, catalytic activation of the SAC depends on regulated protein-protein interactions that accelerate the spontaneous but rate-limiting conversion of MAD2 required for MCC assembly.


Figures

Extended Data Figure 1
Extended Data Figure 1. MCC constituents and MAD2-template model
a, Schematic of MCC constituents with their domain structure. b, Cartoon model of the crystal structure of the S. pombe MCC complex77 (PDB: 4AEZ). CDC20 consists mainly of WD40 β-propeller domain, where the N-terminal extension interacts with MAD2 (MIM). Mad3 is the yeast ortholog of BUBR1. BUBR1, which is constitutively bound to BUB3, contains many functional motifs and structural domains, a few of which are highlighted in a. c, cartoon models of the crystal structures of O-MAD2 and C-MAD2. The HORMA domain of MAD2 exists in two distinct topologies, ‘open’ (O-MAD2) when unliganded, and ‘closed’ (C-MAD2) when bound to MIMs of MAD1 or CDC20 (references 14,15). The change in topology is due to relocation of mobile elements of the structure, indicated in grey. d, Schematic representation of MAD1 and deletion mutants used in this study. e, Schematic representation of the MAD2 template model.
Extended Data Figure 2
Extended Data Figure 2. Characterizing MCC complex using FRET sensors
a, Coomassie-stained SDS-PAGE of recombinant proteins used in this study. b, Fluorescence emission spectrum of MCC Sensor 1 excited at 430 nm. The concentration of all proteins is 100 nM, expect for the CDC20-peptide, which was used in large excess (5 μM) in competition reaction. Signals were normalized to peak donor emission at 470 nm. No change in emission was observed in presence of only MAD2TAMRA, or when CFPCDC20 was measured in isolation (black) or with a TAMRA-labeled peptide (green). Excess of CDC20-peptide competed for MAD2 binding and no FRET was observed (brown). c, In an additional control for Sensor 1, CFP-Cdc20 was tested against TAMRA-labeled “loopless” (MAD2-LLTAMRA), a MAD2 mutant that is locked in the O-MAD2 conformation and that cannot bind CDC20 (reference 17). Assay conditions were as described in panel b. d, MCC formation critically relies on the presence of CDC20. Fluorescence emission spectra of MCC Sensor 2 or parts thereof excited at 430 nm. No change in emission was observed in presence of only MAD2TAMRA (no CFPBUBR1:BUB3, blue) or when CFPBUBR1:BUB3 was measured in isolation (black), in presence of MAD2TAMRA (without CDC20, purple), or in presence of CDC20 and a TAMRA-labeled peptide not conjugated to MAD2 (green). The only condition leading to changes in donor and acceptor emission was when CFPBUBR1:BUB3, MAD2TAMRA, and CDC20 were present at the same time (red). FRET efficiency upon complex formation at equilibrium was 35%. The concentration of all proteins was 100 nM. Signals were normalized to peak donor emission at 470 nm. e, In an additional control for Sensor 2, CFP-BUBR1 was tested in the presence of CDC20 against MAD2-LLTAMRA. Assay conditions were as described in panel d. f, Recombinant MAD2TAMRA, CDC20 and CFPBUBR1:BUB3 form MCC complex. Size-exclusion chromatography elution profiles of TAMRAMAD2 (dark blue trace), CDC20 (green trace), CFPBUBR1:BUB3 (light blue trace) mixed to form MCC complex (orange trace). Shift in the elution profile indicate complex formation. g, BUB3 does not affect MCC core stability. Titration experiment determining the binding isotherms of the MCC complex using sensor 2 in presence (red) or absence (blue) of BUB3 showed indistinguishable apparent Kd’s. Bars indicate ± SEM of 3 independent technical replicates of the experiments.
Extended Data Figure 3
Extended Data Figure 3. Microinjection of recombinant fluorescent MCC proteins
a,b, Recombinant fluorescent MCC proteins inject into mitotic cells localize to kinetochores. HeLa cells constitutively expressing LAP-BUB1 (a) or transiently expressing mCherry-CENP-A (b) were synchronized in the G2 phase of the cell cycle by treatment with the CDK1 inhibitor RO3306 (reference 80) and released into mitosis in the presence of Nocodazole. Shortly after the release, cells were injected with either TAMRA-MAD2 or TAMRA (a), and with CFP-BUBR1:BUB3 (b). Cells were live-imaged both before (Pre) and after (Post) microinjection. Scale bars = 2 µm. Number of Injected cells, N: for TAMRA N=2; for TAMRA-MAD2 N=9; for Turquoise-BUBR1:BUB3 N=8.
Extended Data Figure 4
Extended Data Figure 4. MCC assembly kinetics
a, The CDC20:MAD2 complex forms slowly. The time-dependent change of acceptor (left) and donor (right) fluorescence (normalized to values at equilibrium) with 10 nM CFPBUBR1:BUB3 (see Supplementary Information, Section G on effects of BUBR1 concentration on reaction rate of Sensor 2) and 500 nM CDC20 with varying concentrations of MAD2TAMRA. Signal changes were fitted to single exponential curves. b, After single exponential fitting of the curves in a, the apparent first order rate constants (kobs) were plotted as function of MAD2 concentration, with kon being the slope of the resulting curve. These kon values depend on the BUBR1 concentration (see panel c and Supplementary Information, Section G). Bars indicate ± SEM of 3 independent technical replicates of the experiments. c, MCC assembly assay performed with Sensor 2 at 100 nM MAD2TAMRA, 500 nM CDC20, and the indicated concentrations of CFPBUBR1:BUB3. d, BUBR1 does not influence the assembly kinetics of the MCC. Monitoring the assembly of CDC20:MAD2 (Sensor 1; blue), CDC20:MAD2 with dark BUBR1:BUB3 (Sensor 1; red) and BUBR1:MAD2 with dark CDC20 (green) shows indistinguishable rates. e, Catalysis rates scale linearly with catalysts concentration. After pre-incubation of catalyst proteins, MCC assembly was monitored with Sensor 2 [sensor concentrations were 100 nM, except CDC20 (500 nM)] at varying catalyst concentration. Initial velocity (Vi) signal changes were plotted against catalyst concentration, revealing a linear dependency. Bars indicate ± SEM of 3 independent technical replicates of the experiment. f, Catalysis of MCC formation could be observed with both FRET sensors. After pre-incubation of MAD1:C-MAD2, BUB1:BUB3 and MPS1 at 1 μM for 30 minutes, similar catalysis rates were observed with either FRET Sensor 1 (blue) or FRET Sensor 2 (red). Assay performed as described in Figure 2b with all proteins at 100 nM.
Extended Data Figure 5
Extended Data Figure 5. Molecular requirements of catalytic MCC assembly
a, catalytic MCC assembly requires MAD1:C-MAD2, MPS1, ATP, and BUB1:BUB3. MCC assembly was monitored with Sensor 2 as described in Figure 2b using 100 nM catalysts. Individual components were omitted as indicated. The same control profiles (black and red curves) are shown in all panels. b, MAD1420-C (red) is minimal construct capable of full catalysis. Reduction of catalytic rate was observed with MAD1485-C (purple) compared to MAD1FL (yellow) or MAD1420-C. Assay performed with sensor 2 as described in Figure 2b using 100 nM catalysts. Catalytic activation is salt sensitive, likely because high salt inhibits phosphorylation-mediated polar interactions (Extended data Figure 5c,d). c-d, Catalysis is sensitive to salt concentration. MCC assembly was monitored with FRET sensor 2 using either 75 mM (red), 150 mM (blue), 300 mM (green) or 500 mM NaCl (brown), both in the absence (c) or presence (d) of catalysts. Assay performed with Sensor 2 as described in Figure 2b.
Extended Data Figure 6
Extended Data Figure 6. Inhibiting catalysis
a, MPS1 and BUB1 inhibition during pre-incubation strongly reduces catalysis. Adding both Reversine and BAY-320 to pre-incubation of catalyst strongly reduced the catalysis of MCC formation. Adding the inhibitors after pre-incubation but before addition to the MCC FRET Sensor 2 components did not affect catalysis. Final concentrations of inhibitors were 50 μM during pre-incubation and 5 μM in assay. b, As in Figure 4a, but with BUB1 inhibitor BAY-320. Kinase dead BUB1 (BUB1KD) was used as control. c, Catalysis rates remained unchanged when “splitting” the pre-incubation of catalyst proteins into two reactions (MAD1:C-MAD2 together with MPS1 and BUB1 alone; compare green to red). Assay performed with Sensor 2 as described in Figure 2b using 100 nM catalysts. d, MAD1:C-MAD2 is phosphorylated by MPS1. Catalysis rates remained unchanged when “splitting” the pre-incubation of catalyst proteins into two reactions (MAD1:C-MAD2 together with MPS1 and BUB1 alone; compare green to red). Adding kinase inhibitors Reversine (MPS1) and BAY-320 (BUB1) to the proper pre-incubation reaction strongly reduced the catalysis rates (orange). However, inverting the inhibitors had no effect on the catalysis rates (blue). Assay performed with Sensor 2 as described in Figure 2b using 100 nM catalysts. Final concentrations of inhibitors are 5 μM in assay (50 μM during pre-incubation).
Extended Data Figure 7
Extended Data Figure 7. MPS1 phosphorylation of MAD1
a, Phosphorylation sites of MAD1 by MPS1. The peptide sequence with the phosphorylated residue in bold, the amino acid position within the protein, the p-value of the posterior error probability for the identified peptide (PEP) and the Andromeda search engine score (score) are shown. Residue numbers in bold indicate phosphorylation sites found in at least two experiments. b-d, In (b), HeLa cells were transfected with mCherry (Control), mCherry-MIS12-MAD1WT (WT), mCherry-MIS12-MAD1S428A (S428A), mCherry-MIS12-MAD1RWD-A (RWD-A) or mCherry-MIS12-MAD1S428A,RWD-A (S428A, RWD-A) as described and quantified in the legend to Figure 4c. Shown are mitotic cells, representative of the mitotic population in each cohort [mCherry control, 59 cells; mCherry-MIS12-MAD1WT (WT), 247 cells; mCherry-MIS12-MAD1S428A (S428A), 203 cells; mCherry-MIS12-MAD1RWD-A (RWD-A), 83 cells; mCherry-MIS12-MAD1S428A,RWD-A (S428A, RWD-A), 91 cells]. Following a 30-hour transfection with the indicated constructs, cells were fixed and processed for western blotting (c) or immunofluorescence (panel d and Figure 4c). Western blot analysis showed that expression levels of mCherry-MIS12-MAD1 fusions are lower than endogenous MAD1 levels (c). Scale bars, 5 µm. Quantification of kinetochore signals was performed on unmodified Z-series images. Following background subtraction, a ratio for mCherry-MIS12-MAD1/CREST intensity signals was calculated. All ratios were normalized to the mean of mCherry-MIS12-MAD1WT ratio. Quantifications are based on two independent biological replicates of the experiment, for a total of 5 cells for each condition, where 254 (WT), 143 (S428A mutant), 207 (RWD-A) or 188 (S428A, RWD-A) kinetochores were analyzed. Shown is a ‘box and whiskers’ graph indicating the median, a box with the 25-75th percentile, and hinges indicating the upper and lower limits of the datapoints.
Extended Data Figure 8
Extended Data Figure 8. MAD1 and BUB1 interact to combine O-MAD2 and CDC20
a, MAD1:C-MAD2 and BUB1:BUB3 together form the MCC enzyme, while MPS1 suffices in sub-stoichiometric amounts. Lowering concentration of all catalysts increased halftime 10-fold (compare conditions 1 and 8). Lowering individual components reduces rates to intermediate levels for MAD1:C-MAD2 (condition 2) and BUB1:BUB3 (conditions 3), but not MPS1 (condition 4). Lowering both MAD1:C-MAD2 and BUB1:BUB3 (condition 5) mimics reduction of all components (condition 8), while reducing MAD1:C-MAD2 or BUB1:BUB3 in combination with MPS1 only resulted in intermediate rates. Assays were performed with MCC Sensor 2. Bars indicate ± SEM of 3 independent technical replicates of the experiment. Assay performed with sensor 2 and as described in Figure 2b using either 100 nM (1x) or 10 nM (0.1x) catalysts. b, Excluding BUBR1 does not affect catalytic rates (green and blue). Assays performed using MCC sensor 1 and all proteins at 100 nM. c, BUB1 interaction with CDC20 enhances binding with MAD2. A BUB1 construct that does not bind CDC20 (KEN1-ABBA mutant; purple) yields similar rates as in the absence of BUB1 (grey). Assay performed with sensor 2 and as described in Figure 2b using 100 nM catalysts. d, MAD1:C-MAD2 and BUB1:BUB3 show an ATP-dependent interaction in presence of MPS1. Pull-down experiment using MBP-MAD1:C-MAD2 as bait. Assay was performed with 1 μM MAD1:C-MAD2, 2 μM BUB1:BUB3 and 400 nM MPS1. e, Values of FRET from MCC Sensor 2 (1 nM CFPBUBR1 and 500 nM CDC20) after equilibration with or without catalysts (25 nM catalyst concentration). Bars indicate ± SEM of 3 independent technical replicates of the experiment.
Figure 1
Figure 1. Stability of MCC
a, Putative SAC catalysts at unattached kinetochores promote MCC assembly to inhibit APC/C, preventing mitotic exit. b, Scheme of two MCC FRET sensors used. c, Intersubunit interactions in MCC augment binding affinity. Response of Sensor 1 and Sensor 2 to the indicated MAD2 concentrations (red, Sensor 1, no BUBR1; Blue, Sensor 1, with BUBR1; Green, Sensor 2). BUBR1 augments the stability of Sensor 1. 1 nM CFPCDC20, 500 nM BUBR1 (Sensor 1), or 1 nM CFPBUBR1 and 500 nM CDC20 (Sensor 2) were used. Bars indicate ± SEM of 3 independent technical replicates of the experiment. Unless otherwise specified, “Fluorescence” on the Y-axis indicates FRET acceptor fluorescence at the indicated MAD2 concentration normalized to the maximum FRET acceptor fluorescence at saturating MAD2 concentrations (measured at 583 nm). App. Kd is the apparent Kd. d, Titration experiment with BUBR1 wild-type (red) or Ala-Ala-Ala (“AAA”) mutants of KEN-box 1 (blue) or KEN-box 2 (green). Bars indicate ± SEM of 3 independent technical replicates of the experiment.
Figure 2
Figure 2. Catalytic assembly of MCC
a, Binding of CDC20 with MAD2 is rate-limiting for MCC formation. Time zero is the first time point after mixing 100 nM CFPBUBR1:BUB3 with CDC20 and MAD2TAMRA (red) or with CDC20:C-MAD2 allowed to form by overnight pre-incubation at 4ºC (blue). All panels reporting time-dependent changes in FRET signal are single measurements representative of at least three independent technical replicates of the experiment. b, MAD1:C-MAD2, BUB1:BUB3 and MPS1 catalyse MCC assembly. After pre-incubation at 30ºC for 30’, MAD1:C-MAD2, BUB1:BUB3 and MPS1 were diluted at indicated concentrations into 100 nM MCC FRET Sensor 2 (with 500 nM CDC20).
Figure 3
Figure 3. Molecular requirements of catalytic MCC assembly
a-c, catalytic MCC assembly requires MAD1:C-MAD2, MPS1, ATP, and BUB1:BUB3. MCC assembly was monitored with Sensor 2 as described in Figure 2b using 100 nM catalysts. Individual components were omitted as indicated. The same control profiles (black and red curves) are shown in all panels. d, Mutations in C-MAD2 bound to MAD1 that prevent its interaction with the sensor’s O-MAD2 abrogate catalysis. Control profiles (black and red curves) are the same shown in Figure 3a-c and Extended data Figure 5a. Assay performed with sensor 2 as described in Figure 2b using 100 nM catalysts.
Figure 4
Figure 4. MPS1 activates MAD1
a, Reversine added during pre-incubation of catalysts (“pre”, purple) or during MCC Sensor 2 assembly phase (“post”, green). Concentration of inhibitor was 5 μM in FRET assay and 50 μM in pre-incubation. Assay performed as described in Figure 2b using 100 nM catalysts. b, Phosphorylation sites in the RWD domain of MAD1 (MAD1RWD-A) are required for MCC catalysis (brown). Limited residual catalysis is due to Bub1 (compare brown and blue). Experiments conducted with MAD1420-C as described in Figure 2b using 100 nM catalysts. c, HeLa cells were transfected with mCherry (-, 1471 cells), mCherry-MIS12-MAD1WT (WT, 1451 and 1224 cells), mCherry-MIS12-MAD1S428A (S428A, 1309 and 1198 cells), mCherry-MIS12-MAD1RWD-A (RWD-A, 1838 and 1138 cells), or mCherry-MIS12-MAD1S428A,RWD-A (S428A-RWD-A, 1657 and 1289 cells). After 30 hours, mitotic indexes of mCherry positive cells (Extended data Figure 6b) were scored by visualization of DNA, CREST (kinetochores), and α-tubulin (not shown). Cells were also treated with 500 nM Reversine for 2 h before fixation. Graphs report mean of at least two technically independent experiments and the number of cells used for each quantification are listed above.
Figure 5
Figure 5. Role of catalysis in MAD2 activation dynamics
a, Michaelis-Menten kinetics of MCC catalysis. Catalysts were prepared as described in Figure 2b and used at 5 nM concentration; CDC20 and BUBR1 concentration was 500 nM. Bars indicate ± SEM of 3 independent technical replicates of the experiment. b, The catalytic apparatus of the SAC targets binding of O-MAD2 with CDC20, rate-limiting step of MCC assembly. Relative energy profiles indicate reaction is spontaneous but slow due to high activation energy. Catalysis reduces it, increasing reaction rate. Incorporation of BUBR1:BUB3 in MCC is fast and does not require catalysis. c, Summary drawing. MPS1 phosphorylates KNL1 to promote kinetochore recruitment of BUB1:BUB3, and MAD1:C-MAD2 to activate it and promote binding to BUB1:BUB3. MAD1:C-MAD2 and BUB1:BUB3 recruit O-MAD2 and CDC20, respectively, catalysing their interaction. Subsequent incorporation of BUBR1:BUB3 drives MCC assembly.

References

    1. Musacchio A. The Molecular Biology of Spindle Assembly Checkpoint Signaling Dynamics. Current biology : CB. 2015;25:R1002–1018. doi: 10.1016/j.cub.2015.08.051. - DOI - PubMed
    1. Luo X, et al. The Mad2 spindle checkpoint protein has two distinct natively folded states. Nature structural & molecular biology. 2004;11:338–345. doi: 10.1038/nsmb748. - DOI - PubMed
    1. Simonetta M, et al. The influence of catalysis on mad2 activation dynamics. PLoS Biol. 2009;7:e10. doi: 10.1371/journal.pbio.1000010. - DOI - PMC - PubMed
    1. Kulukian A, Han JS, Cleveland DW. Unattached kinetochores catalyze production of an anaphase inhibitor that requires a Mad2 template to prime Cdc20 for BubR1 binding. Developmental cell. 2009;16:105–117. doi: 10.1016/j.devcel.2008.11.005. - DOI - PMC - PubMed
    1. Dick AE, Gerlich DW. Kinetic framework of spindle assembly checkpoint signalling. Nature cell biology. 2013;15:1370–1377. doi: 10.1038/ncb2842. - DOI - PMC - PubMed

Publication types