. 2017 Jan 19;8(1):e2565.
doi: 10.1038/cddis.2016.475.

Autophagy dysregulation in Danon disease

Affiliations

Autophagy dysregulation in Danon disease

Anna Chiara Nascimbeni et al. Cell Death Dis. .

Abstract

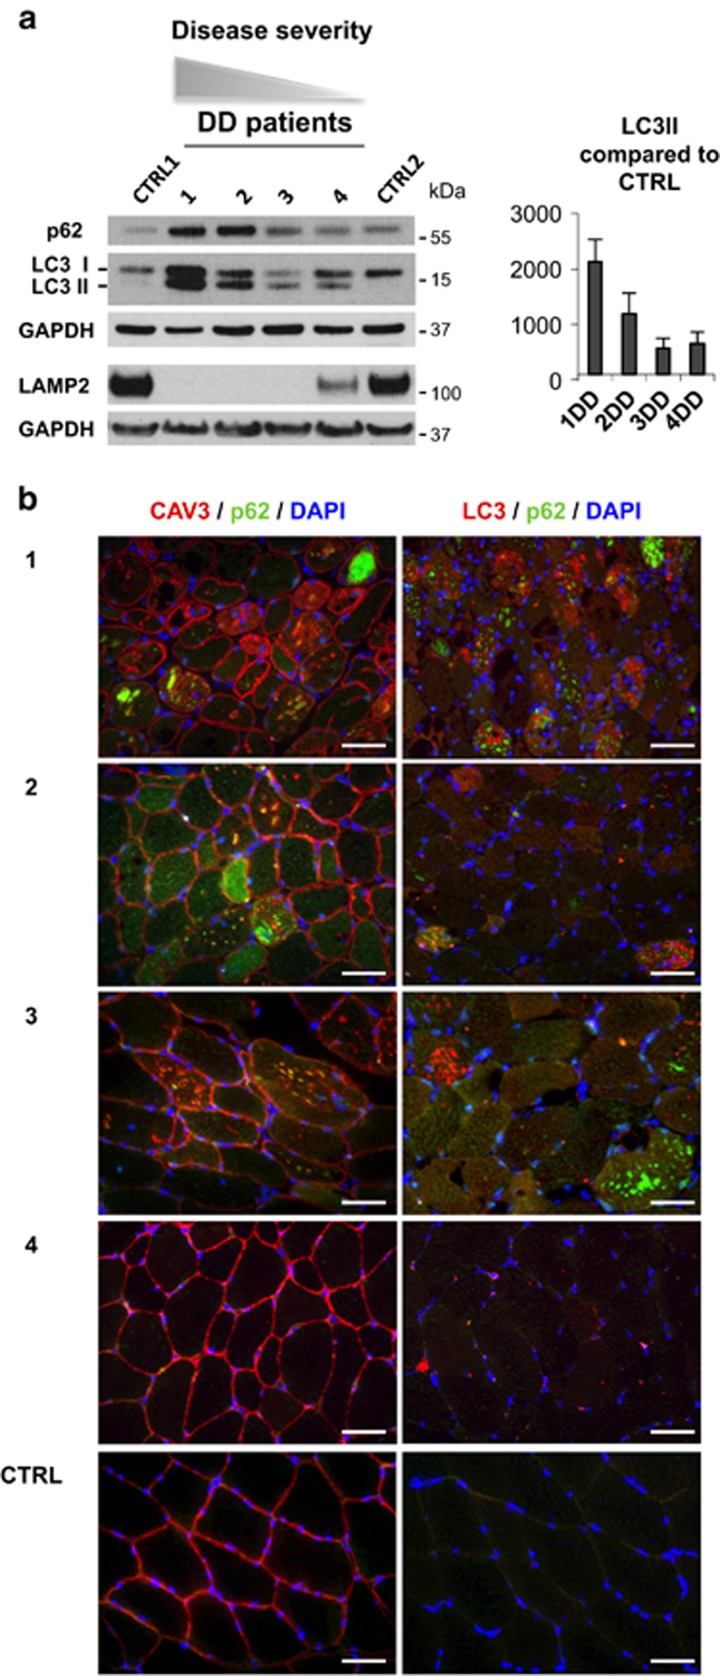
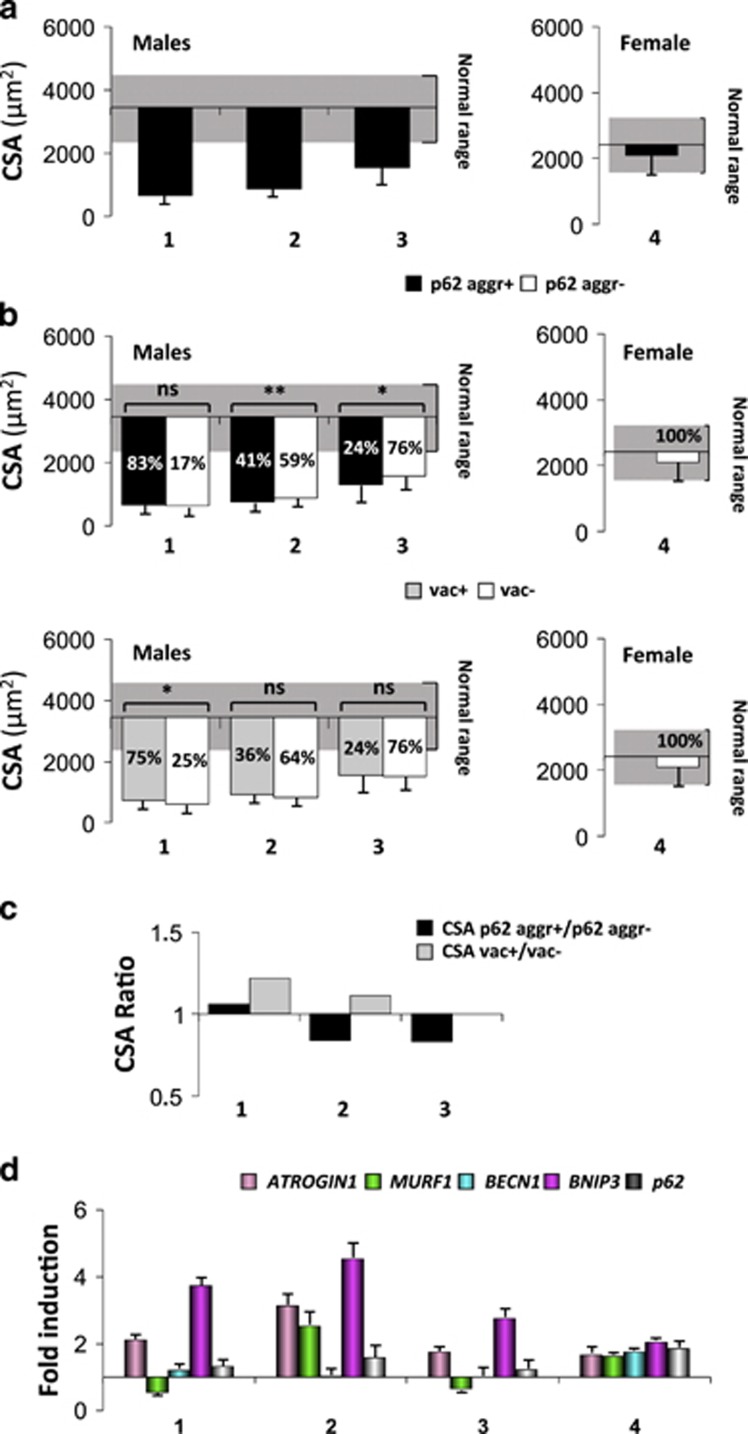
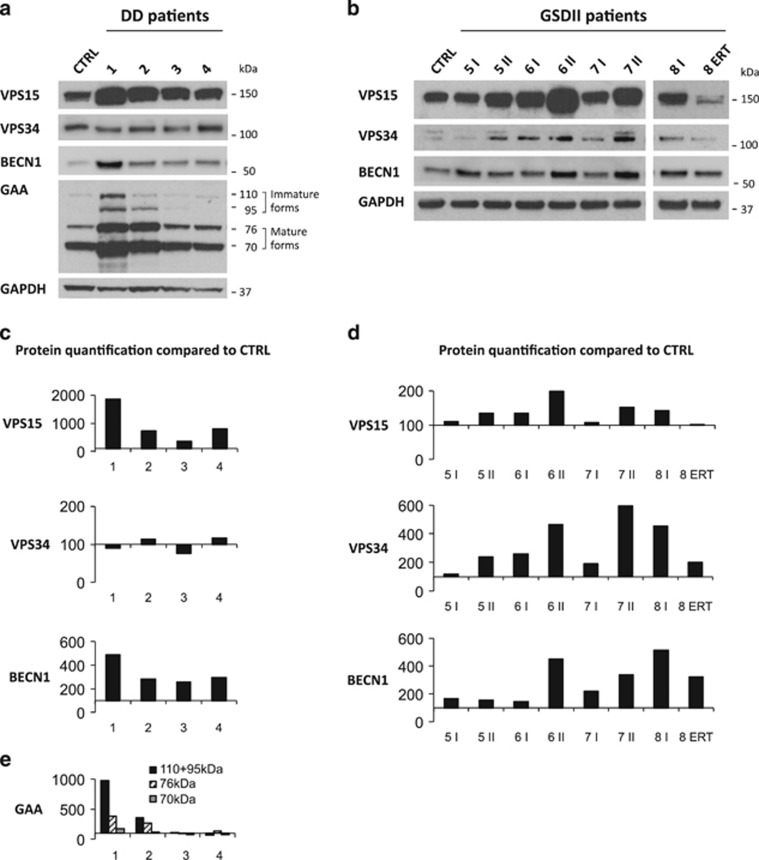
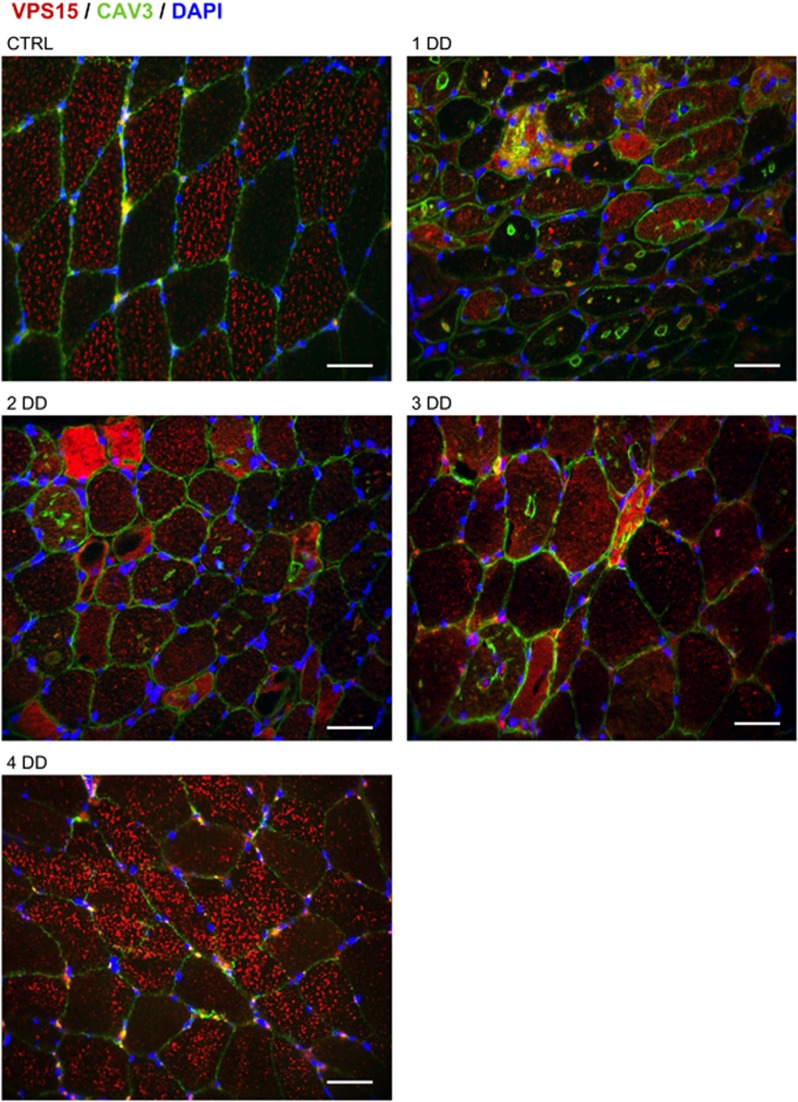
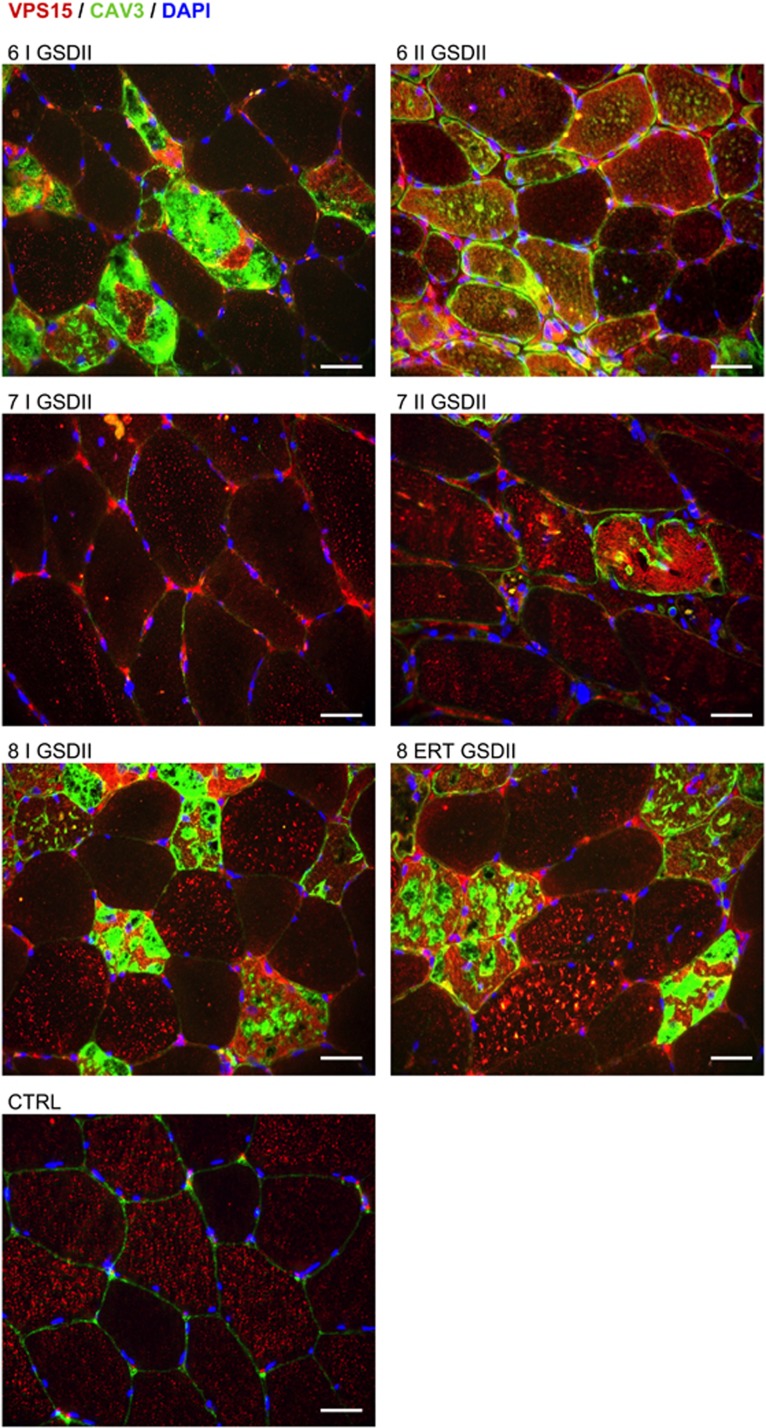
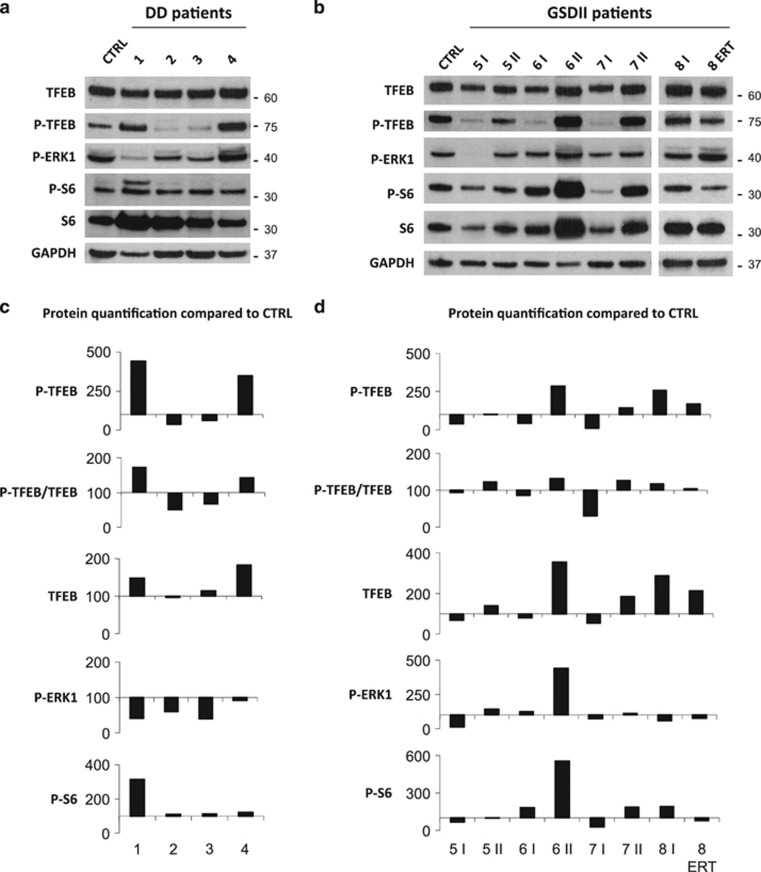
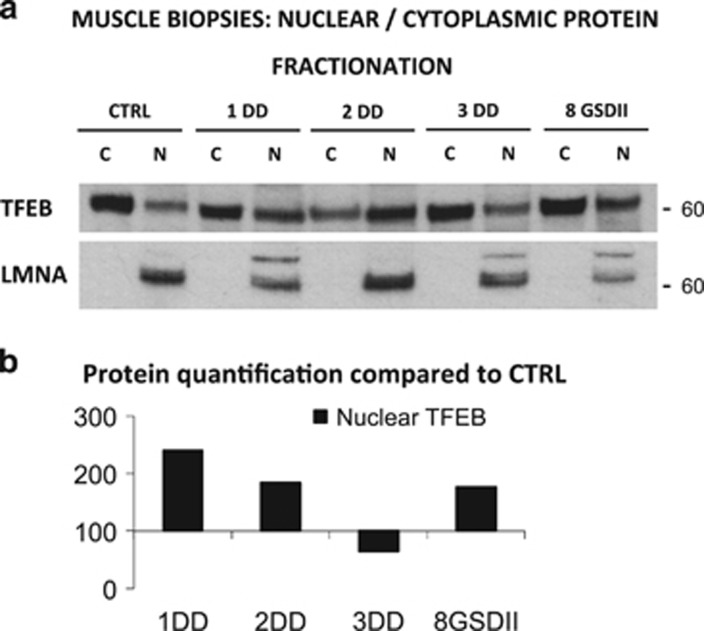
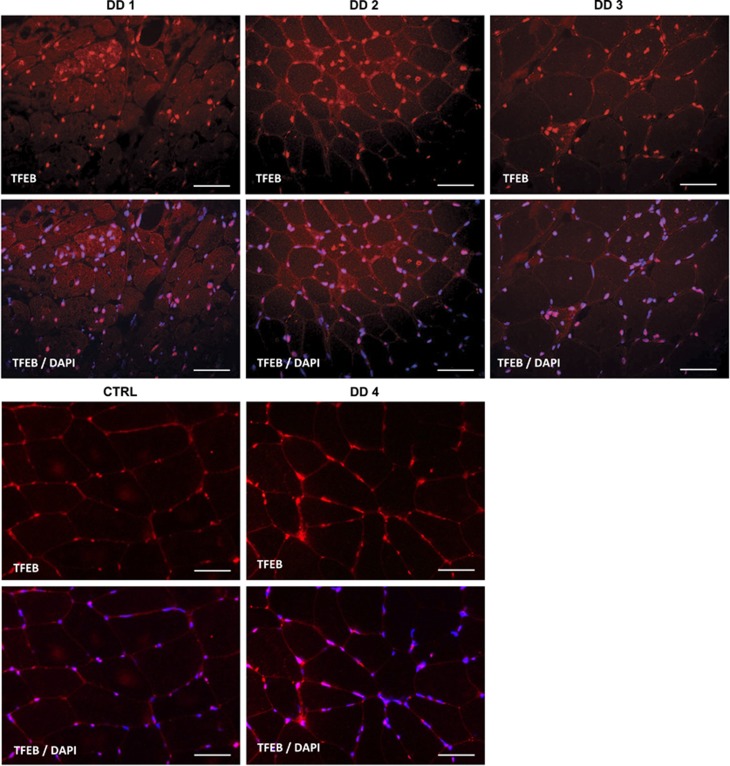
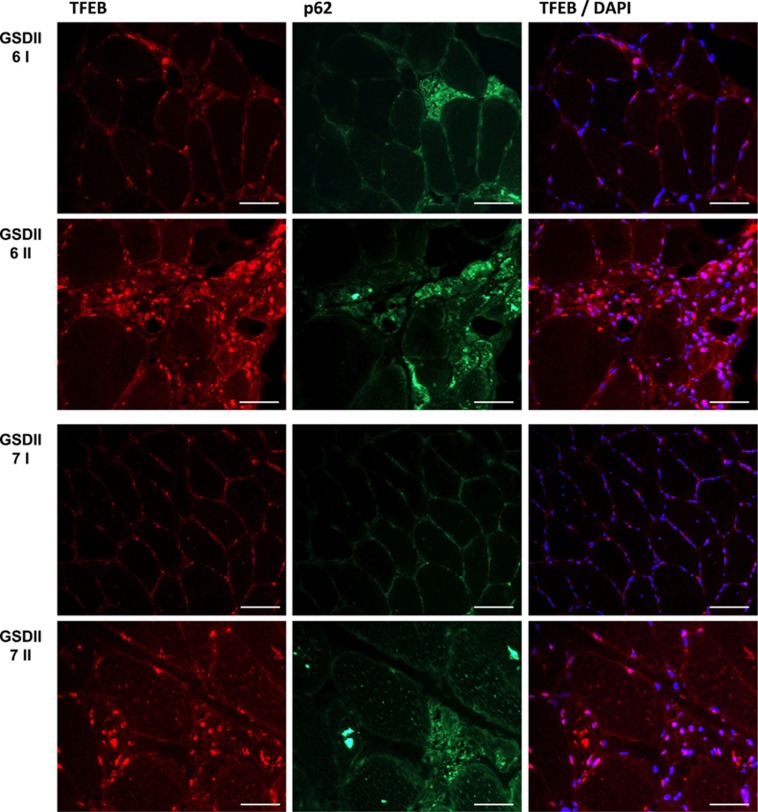
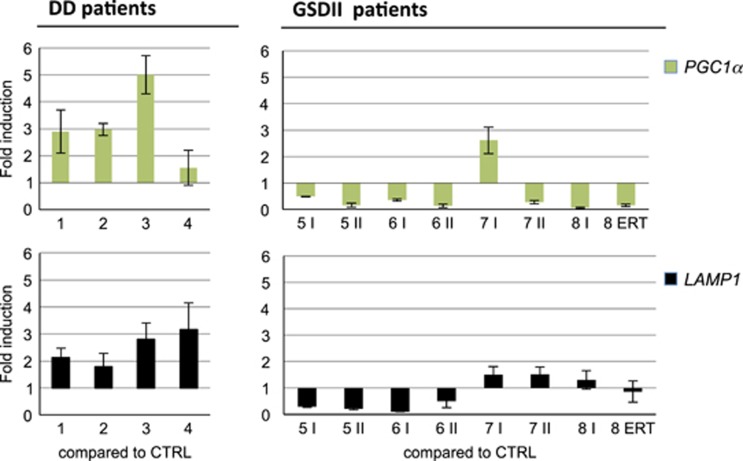
The autophagy-lysosome system is critical for muscle homeostasis and defects in lysosomal function result in a number of inherited muscle diseases, generally referred to as autophagic vacuolar myopathies (AVMs). Among them, Danon Disease (DD) and glycogen storage disease type II (GSDII) are due to primary lysosomal protein defects. DD is characterized by mutations in the lysosome-associated membrane protein 2 (LAMP2) gene. The DD mouse model suggests that inefficient lysosome biogenesis/maturation and impairment of autophagosome-lysosome fusion contribute to the pathogenesis of muscle wasting. To define the role of autophagy in human disease, we analyzed the muscle biopsies of DD patients and monitored autophagy and several autophagy regulators like transcription factor EB (TFEB), a master player in lysosomal biogenesis, and vacuolar protein sorting 15 (VPS15), a critical factor for autophagosome and endosome biogenesis and trafficking. Furthermore, to clarify whether the mechanisms involved are shared by other AVMs, we extended our mechanistic study to a group of adult GSDII patients. Our data show that, similar to GSDII, DD patients display an autophagy block that correlates with the severity of the disease. Both DD and GSDII show accumulation and altered localization of VPS15 in autophagy-incompetent fibers. However, TFEB displays a different pattern between these two lysosomal storage diseases. Although in DD TFEB and downstream targets are activated, in GSDII patients TFEB is inhibited. These findings suggest that these regulatory factors may have an active role in the pathogenesis of these diseases. Therapeutic approaches targeted to normalize these factors and restore the autophagic flux in these patients should therefore be considered.


Conflict of interest statement

Dr. Angelini is a member of the European Pompe Registry, which is financially supported by Sanofi-Genzyme Corporation. The remaining authors declare no conflict of interest.

Figures

Figure 1
Figure 1
Characterization of autophagy in Danon disease. (a) Immunoblot analysis of LC3, p62, LAMP2 and the loading control GAPDH. Ctrl1, Ctrl2, healthy controls; numbers, patient identifiers. LC3II protein quantification normalized to GAPDH and compared with healthy controls. (b) Immunofluorescence analysis of muscle biopsies for p62-positive aggregates (green), the sarcolemmal membrane and vacuolar marker CAV3 and LC3 puncta (red), and the nuclear marker DAPI (blue) in DD patients and healthy adult control. Bar=40 μm
Figure 2
Figure 2
Characterization of atrophy and autophagy in Danon disease. (a) Mean CSA of total myofibers. (b) CSA of fibers showing p62-positive aggregates (p62+ aggr) compared with fibers without p62-positive aggregates (p62- aggr) and vacuolated (vac+) compared with non-vacuolated (vac-) fibers, relative to healthy age- and sex-matched controls (male controls mean CSA: 3446±950 μm2; female controls mean CSA: 2419±786 μm2; dashed box: normal CSA range). The percentages of p62-positive, negative, vacuolated and non-vacuolated fibers are reported in the bars. **P<0.0001; *P<0.05; NS, not significant. n>200 fibers measured. (c) CSA ratio of p62-positive versus negative and vacuolated versus non-vacuolated fibers. When the size of fibers containing p62 aggregates (or vacuoles) is smaller than that of the negatives, it will result in a ratio below 1. (d) qRT-PCR analysis of the atrophy-related genes and of p62. The fold induction is compared with age-matched controls and normalized to GAPDH
Figure 3
Figure 3
VPS15 expression in DD and GSDII muscle. (a) Immunoblot analyses of muscle biopsies for VPS15, VPS34, BECN1, GAA (in DD) and the loading control GAPDH in DD and in GSDII (b) patients. Ctrl, healthy control; ERT, biopsy after ERT; numbers, patient identifiers; I, first biopsy; II: second biopsy. (c) Densitometric analysis (percentage compared with control) of proteins normalized to GAPDH for DD and GSDII (d) patients. (e) Densitometric analysis (percentage compared with control) of GAA. The different GAA forms are specified: the inactive (110+95 kDa) and the active ones (76 and 70 kDa)
Figure 4
Figure 4
VPS15 localization in DD muscle. Immunofluorescence analysis of muscle biopsies for VPS15 (red), CAV3 (green) and DAPI (blue). Ctrl, healthy control; numbers, patient identifiers. Bar=40 μm
Figure 5
Figure 5
VPS15 localization in GSDII muscle. Immunofluorescence analysis of muscle biopsies for VPS15 (red), CAV3 (green) and DAPI (blue). Ctrl, healthy control; numbers, patient identifiers; I, first biopsy; II, second biopsy; ERT, biopsy after ERT. Bar=40 μm
Figure 6
Figure 6
Analysis of TFEB and its regulation in DD and GSDII patients. (a) Immunoblot analysis of muscle biopsies for TFEB, P-TFEB, P-ERK1, P-S6, S6 and the loading control GAPDH in DD and in GSDII (b) patients. Ctrl, healthy control; ERT, biopsy after ERT; numbers, patient identifiers; I, first biopsy; II, second biopsy. (c) Densitometric analysis (percentage compared with control) of proteins normalized to GAPDH for DD and GSDII (d) patients
Figure 7
Figure 7
TFEB in nuclear and cytoplasmic protein fractions from muscle biopsies. (a) Immunoblot analysis of nuclear and cytoplasmic TFEB. GAPDH was used as loading control for the cytoplasmic protein fraction and LMNA for the nuclear protein lysate. Ctrl, healthy control; numbers, patient identifiers. C, cytoplasmic protein fraction; N, nuclear protein fraction. (b) Densitometric analysis (percentage compared with control) of nuclear TFEB normalized to LMNA
Figure 8
Figure 8
TFEB localization in DD. Immunofluorescence for TFEB (red) and DAPI (blue) show increased activation (nuclear translocation) of TFEB in male patients (pts. 1–3) compared with female (pt. 4) and healthy control (Ctrl). Bar=40 μm
Figure 9
Figure 9
TFEB localization in two untreated GSDII patients after 6 years of disease progression. The upper panel shows the first (I) and the second (II) biopsy of patient 6, the lower panel shows the first (I) and the second (II) biopsy of patient 7. Immunofluorescence for TFEB shows increased activation in atrophic/autophagy-incompetent fibers, which correlates with disease severity. Bar=40 μm
Figure 10
Figure 10
qPCR analysis of PGC1α and LAMP1 in DD and GSDII muscle biopsies. Ctrl, healthy control; numbers, patient identifiers; I, first biopsy; II, second biopsy; ERT, biopsy after ERT

References

    1. Bonaldo P, Sandri M. Cellular and molecular mechanisms of muscle atrophy. Dis Model Mech 2013; 6: 25–39. - PMC - PubMed
    1. Malicdan MC, Nishino I. Autophagy in lysosomal myopathies. Brain Pathol 2012; 22: 82–88. - PMC - PubMed
    1. Masiero E, Agatea L, Mammucari C, Blaauw B, Loro E, Komatsu M et al. Autophagy is required to maintain muscle mass. Cell Metab 2009; 10: 507–515. - PubMed
    1. Nishino I, Fu J, Tanji K, Yamada T, Shimojo S, Koori T et al. Primary LAMP-2 deficiency causes X-linked vacuolar cardiomyopathy and myopathy (Danon disease). Nature 2000; 406: 906–910. - PubMed
    1. Danon MJ, Oh SJ, DiMauro S, Manaligod JR, Eastwood A, Naidu S et al. Lysosomal glycogen storage disease with normal acid maltase. Neurology 1981; 31: 51–57. - PubMed

Publication types

MeSH terms

Substances

LinkOut - more resources