. 2017 Jan 19;13(1):e1006538.
doi: 10.1371/journal.pgen.1006538. eCollection 2017 Jan.

Rfx2 Stabilizes Foxj1 Binding at Chromatin Loops to Enable Multiciliated Cell Gene Expression

Affiliations

Rfx2 Stabilizes Foxj1 Binding at Chromatin Loops to Enable Multiciliated Cell Gene Expression

Ian K Quigley et al. PLoS Genet. .

Abstract

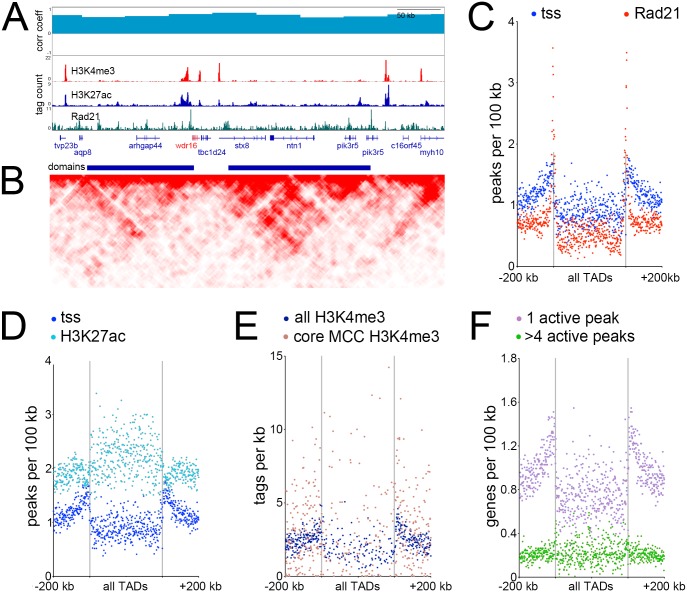
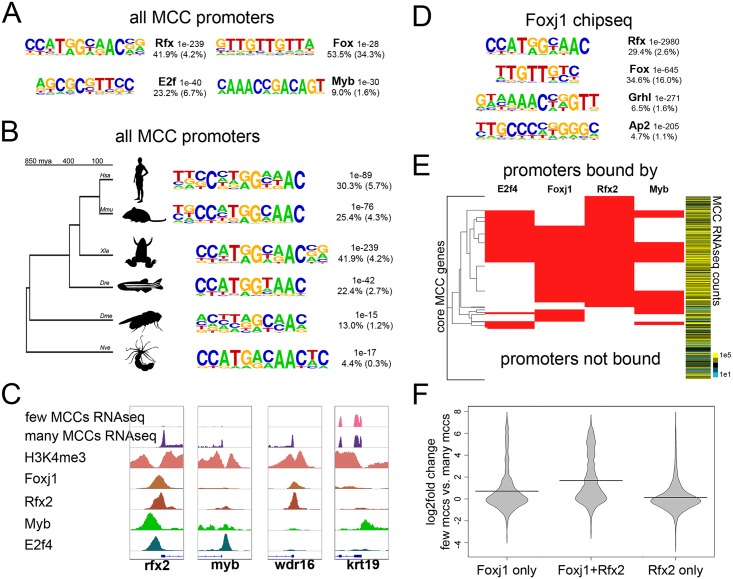
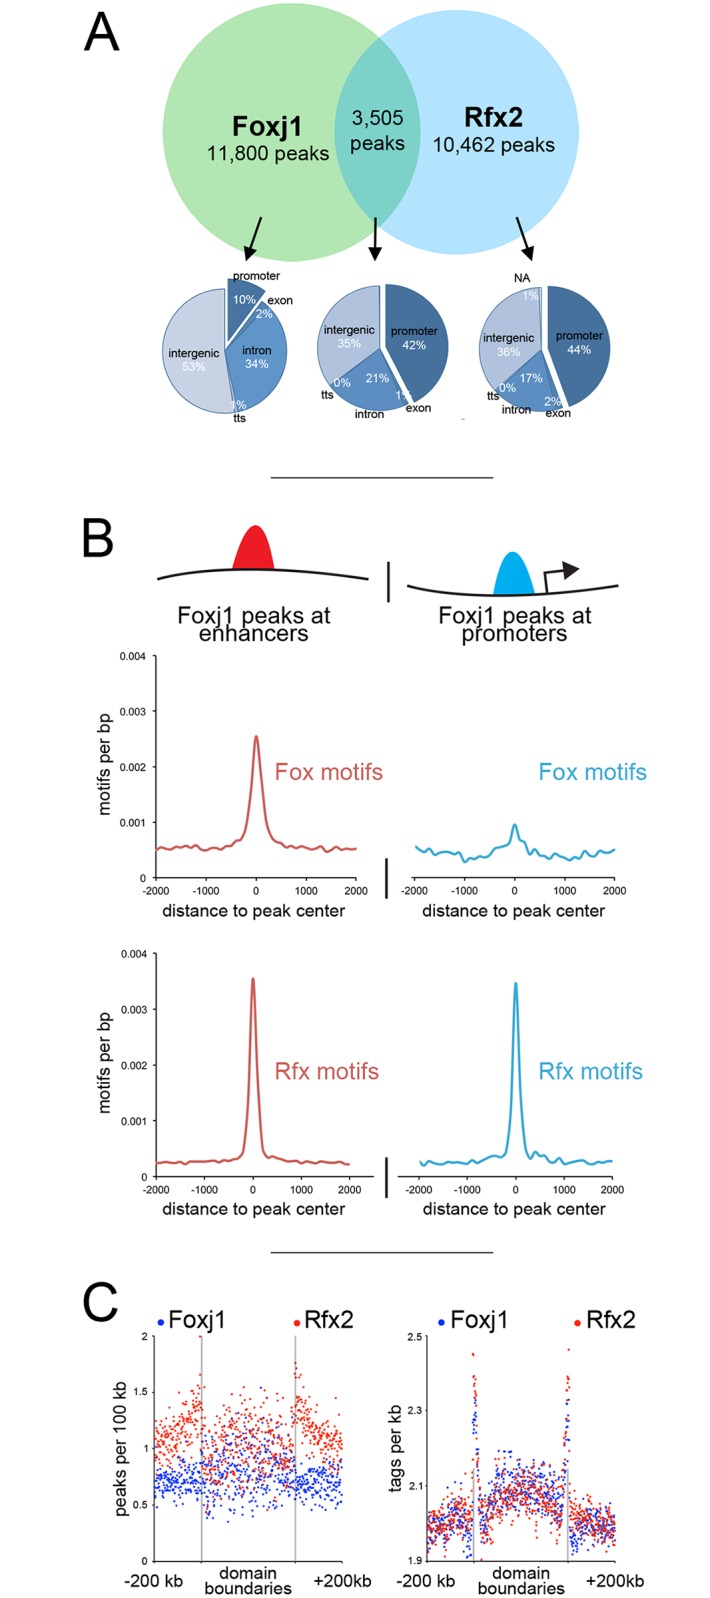
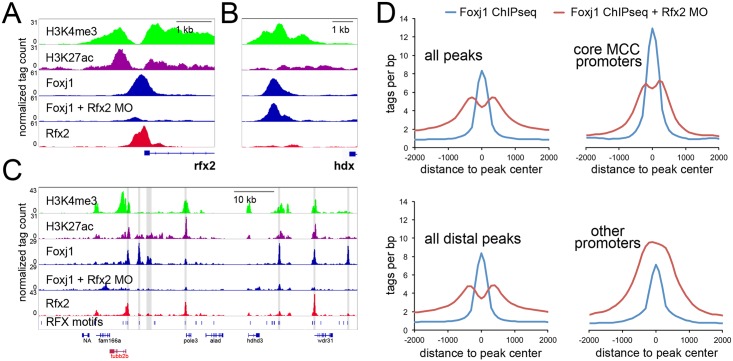
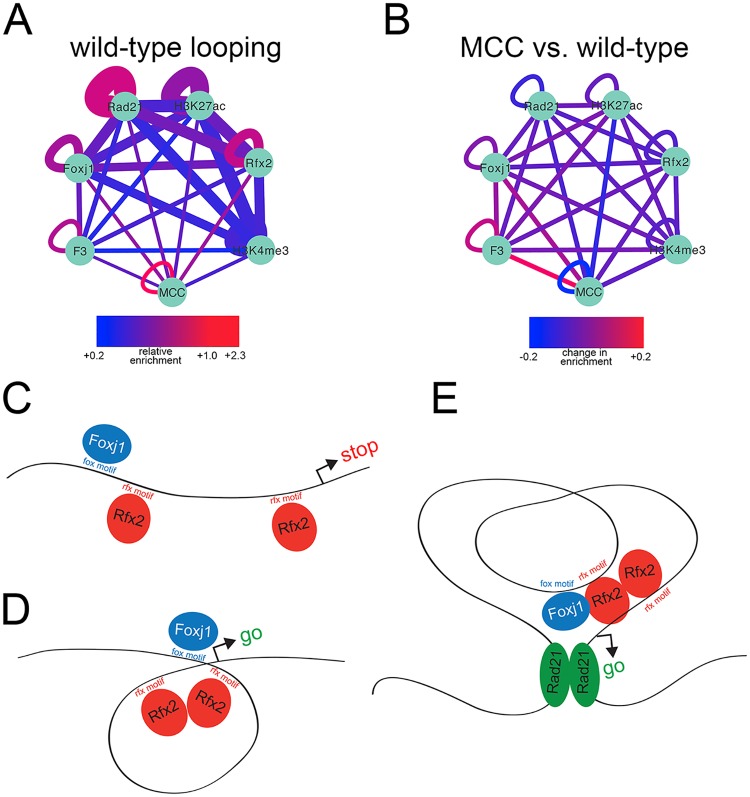
Cooperative transcription factor binding at cis-regulatory sites in the genome drives robust eukaryotic gene expression, and many such sites must be coordinated to produce coherent transcriptional programs. The transcriptional program leading to motile cilia formation requires members of the DNA-binding forkhead (Fox) and Rfx transcription factor families and these factors co-localize to cilia gene promoters, but it is not clear how many cilia genes are regulated by these two factors, whether these factors act directly or indirectly, or how these factors act with specificity in the context of a 3-dimensional genome. Here, we use genome-wide approaches to show that cilia genes reside at the boundaries of topological domains and that these areas have low enhancer density. We show that the transcription factors Foxj1 and Rfx2 binding occurs in the promoters of more cilia genes than other known cilia transcription factors and that while Rfx2 binds directly to promoters and enhancers equally, Foxj1 prefers direct binding to enhancers and is stabilized at promoters by Rfx2. Finally, we show that Rfx2 and Foxj1 lie at the anchor endpoints of chromatin loops, suggesting that target genes are activated when Foxj1 bound at distal sites is recruited via a loop created by Rfx2 binding at both sites. We speculate that the primary function of Rfx2 is to stabilize distal enhancers with proximal promoters by operating as a scaffolding factor, bringing key regulatory domains bound by Foxj1 into close physical proximity and enabling coordinated cilia gene expression.


Conflict of interest statement

The authors have declared that no competing interests exist.

Figures

Fig 1
Fig 1
Identification of a MCC transcriptome (A) Confocal image of X. laevis skin showing a multiciliated cell (MCC), ionocytes (IC), and outer cells (green cells, unlabeled). (B) Differentiation of X. laevis skin. Multipotent progenitors are specified to become MCCs or ionocytes in the inner layer (red cells) by Notch signaling; they then intercalate into the layer of outer cells (green cells). (C) Diagrams illustrating how the numbers of MCCs and ICs in the skin change when Notch, Multicilin and/or Foxi1 activity is manipulated. (D) Schematic of the general experimental strategy used to analyze X. laevis epidermal progenitors (“cap”), after manipulating gene expression using RNA injection. (E) Venn diagram using multiple RNAseq experiments to define a core list of genes expressed in MCCs based on an intersectional strategy. (F) Heatmap of transcriptional variation across all experimental conditions and timepoints subjected to RNAseq analysis (see Methods for more details). For clarity of display, sample names are omitted here but can be seen in S1 Fig.
Fig 2
Fig 2
TADs and their genomic features (A) Browser screenshot of the genomic region surrounding wdr16, a MCC expressed gene. Top track is correlation coefficient between 3D chromosome conformation data between wild-type ectoderm and ectoderm injected with Multicilin, middle tracks show ChIPseq results as labeled, bottom track is called topological domains. (B) Interaction matrix of tethered conformation capture of the same genomic region. High-throughput methods of determining 3-dimensional chromatin structure such as TCC or HiC involve isolating DNA-protein complexes either via dilution (classical HiC), by fixing the proteins to avidin beads (TCC) or in situ nuclear fixation (in situ HiC), cutting DNA in this folded state with a restriction enzyme at many positions, religating, and sequencing. Restriction sites near loops of DNA will ligate across the loops at some frequency, which can then be used to reconstruct the frequency of contact between two close or distant regions of the genome. Here, regions interacting across the genome more often than a linear model of DNA would predict are shown, with darker red indicating a higher frequency of interactions.[–9] (C-F) Metagene plots showing the distribution of various features relative to all TADs. All domains are normalized to the same size, the domain region is in the center of each plot, and the two vertical lines denote the domain boundaries. Areas in outer edges of the plot denote flanking genomic regions of some 200 kb. Each quartile of the plot (one quartile upstream, two quartiles inside the domain region itself, and one quartile downstream) is broken into 175 bins, and each dot denotes the measured values of one bin.
Fig 3
Fig 3
Transcription factor motifs and binding in MCCs (A) Top de novo motifs identified in all MCC promoters in X. laevis along with the transcription factor family that best matches the motif, a p-value determined by the cumulative hypergeometric distribution, the frequency of the motif in the promoters analyzed, and the background frequency of the motif in all promoters. (B) The top de novo motif as in (A) that were found in promoters of all MCC paralogs in the indicated species. Hsa, Homo sapiens; Mmu, Mus musculus; Xla, Xenopus laevis; Dre, Danio rerio; Dme, Drosophila melanogaster; Nve, Nematostella vectensis. (C) Example screenshots around the promoters of three genes that were upregulated during MCC differentiation and one that was not (krt19) indicating H3K4me3 or transcription factor binding by ChIPseq. These promoters were bound by various combinations of Foxj1, Rfx2, Myb, and E2f4 as shown. (D) Shown are the top de novo motifs that are associated with all called Foxj1 ChIPseq peaks. (E) Shown are all core 950 MCC promoters and the combinations of E2f4, Foxj1, Rfx2, and Myb bound to each. Heatmap to the right indicates normalized expression counts in manipulations producing many MCCs (epithelial progenitors injected with Notch-icd compared to those injected with Notch-icd and Multicilin). (F) Shown is the change in expression between epithelial progenitors with few MCCs (injected with Notch-icd) versus progenitors with many MCCs (injected with Notch-icd and Multicilin) driven by all promoters bound by the indicated factors.
Fig 4
Fig 4
Interactions between Foxj1 and Rfx2 (A) Venn diagram at the top represents all peaks (fixed width) bound by Foxj1 and Rfx2 identified with ChIPseq, in terms of their overlap. The pie charts shown below illustrate where Foxj1 and Rfx2 binding occurs in relation to annotated genomic features depending on whether they bind together or alone. (B) Foxj1 ChIPseq peaks were subdivided into those located near promoters (< 1 kb to the TSS) or at more distal sites (> 1 kb to the TSS) and then analyzed for the frequency of Rfx or Fox binding motifs. (C) Shown is the distribution of Rfx2 and Foxj1 peaks relative to TAD boundaries (left panel), and the distribution of Rfx2 and Foxj1 sequencing tags relative to TAD boundaries (right panel).
Fig 5
Fig 5
Binding of Foxj1 at promoters is dependent on Rfx2 (A-B) Screenshot around the promoter of X. laevis rfx2 (A) or hdx (B) along with the sequence tags obtained in ChIPseq of H3K4me3, H3K27ac, Foxj1, or Rfx2 in wildtype and Foxj1 in Rfx2 morphants (MO). (C) Shown is a screenshot of the X. laevis genomic region containing the tubb2b gene with ChIPseq tracks as in (A). The position of all Rfx motifs is denoted in the bottom track. Foxj1 peaks that are reduced >3-fold in the Rfx2 morphants compared to control are shaded. (D) Shown are sequencing tag histograms in peaks as labeled from ChIPseq of Foxj1 in wild-type progenitors or progenitors from Rfx2 morphants.
Fig 6
Fig 6
Chromatin loops connect MCC regulatory elements (A) The relative enrichment over expected of histone modifications or transcription factor binding sites at loop anchor points was calculated and visualized in Cytoscape. “Wild-type” tissue is unmanipulated progenitors containing a mixture of outer cells, ionocytes, and multiciliated cells. Expected overlap was determined by hypergeometric distribution; 3D interactions were obtained from wild-type progenitors, and line thickness is inversely proportional to p value (range: 1e-37 to 1e-611, thicker line is lower p value). Nodes are as labeled; “F3” represents the subset of Foxj1 ChIPseq peaks that are reduced 3-fold or greater in Rfx2 knockdowns and “MCC” represents MCC TSS’s. (B) 3D interactions were obtained for wild-type progenitors using progenitors injected with Multicilin to increase numbers of MCCs as background (to determine interactions stronger in wild-type tissue) and 3D interactions were also obtained using the reverse (to determine interactions stronger in multiciliated cells). Relative enrichments of histone modifications or transcription factor binding sites were determined for each as in (A) and then compared to one another. Thus, values here depicted by color represent changes in enrichment between the two conditions. (C,D) Model of recruitment of Foxj1-bound enhancers to MCC promoters via Rfx2 dimerization. (E) Model of how Rfx2-mediated enhancer recruitment operates in the context of TAD boundaries.

Similar articles

Cited by

References

    1. Cirillo LA, McPherson CE, Bossard P, Stevens K, Cherian S, Shim EY, et al. Binding of the winged-helix transcription factor HNF3 to a linker histone site on the nucleosome. EMBO J. 1998;17: 244–54. 10.1093/emboj/17.1.244 - DOI - PMC - PubMed
    1. Gualdi R, Bossard P, Zheng M, Hamada Y, Coleman JR, Zaret KS. Hepatic specification of the gut endoderm in vitro: cell signaling and transcriptional control. Genes Dev. 1996;10: 1670–82. Available: http://www.ncbi.nlm.nih.gov/pubmed/8682297 - PubMed
    1. Heinz S, Benner C, Spann N, Bertolino E, Lin YC, Laslo P, et al. Simple combinations of lineage-determining transcription factors prime cis-regulatory elements required for macrophage and B cell identities. Mol Cell. 2010;38: 576–89. 10.1016/j.molcel.2010.05.004 - DOI - PMC - PubMed
    1. Lupien M, Eeckhoute J, Meyer CA, Wang Q, Zhang Y, Li W, et al. FoxA1 Translates Epigenetic Signatures into Enhancer-Driven Lineage-Specific Transcription. Cell. 2008;132: 958–970. 10.1016/j.cell.2008.01.018 - DOI - PMC - PubMed
    1. Carter D, Chakalova L, Osborne CS, Dai Y, Fraser P. Long-range chromatin regulatory interactions in vivo. Nat Genet. 2002;32: 623–6. 10.1038/ng1051 - DOI - PubMed

Publication types