. 2017 Jan 19;12(1):e0169292.
doi: 10.1371/journal.pone.0169292. eCollection 2017.

Tumor Infiltration in Enhancing and Non-Enhancing Parts of Glioblastoma: A Correlation with Histopathology

Affiliations

Tumor Infiltration in Enhancing and Non-Enhancing Parts of Glioblastoma: A Correlation with Histopathology

Oliver Eidel et al. PLoS One. .

Abstract

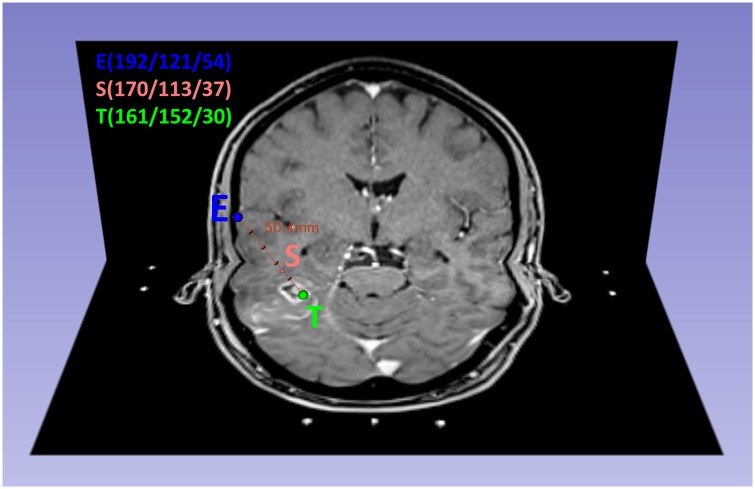
Purpose: To correlate histopathologic findings from biopsy specimens with their corresponding location within enhancing areas, non-enhancing areas and necrotic areas on contrast enhanced T1-weighted MRI scans (cT1).

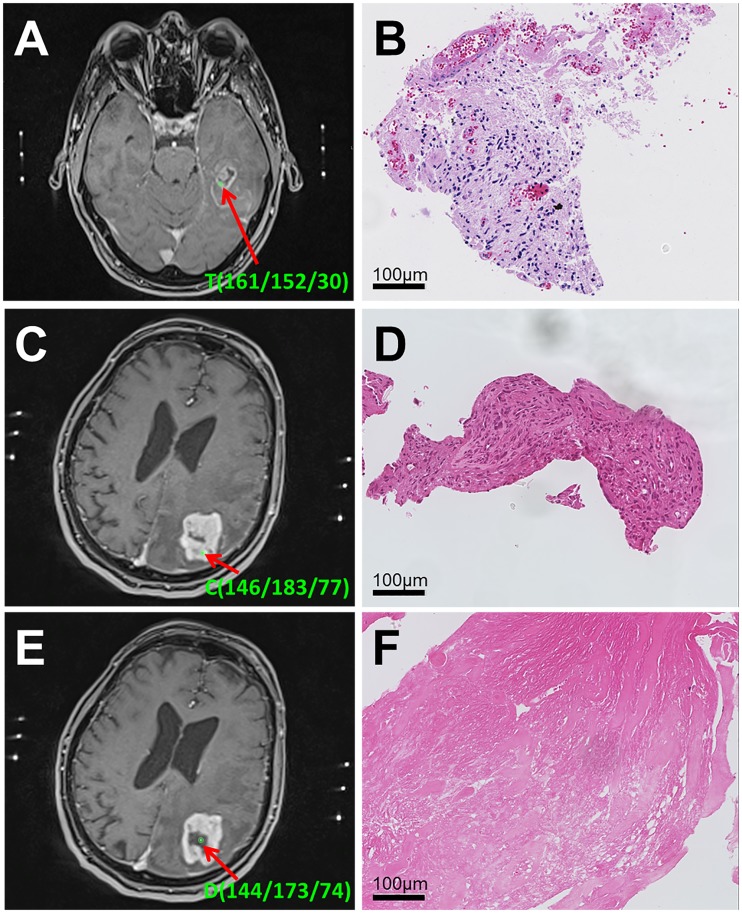
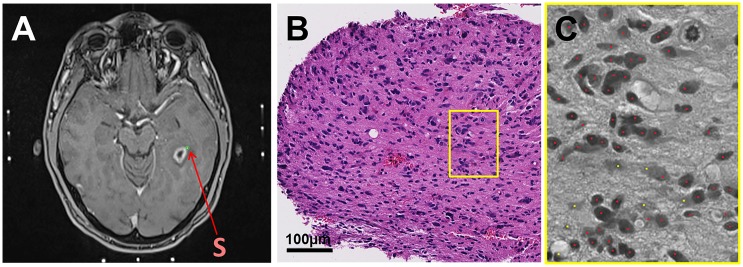
Materials and methods: In 37 patients with newly diagnosed glioblastoma who underwent stereotactic biopsy, we obtained a correlation of 561 1mm3 biopsy specimens with their corresponding position on the intraoperative cT1 image at 1.5 Tesla. Biopsy points were categorized as enhancing (CE), non-enhancing (NE) or necrotic (NEC) on cT1 and tissue samples were categorized as "viable tumor cells", "blood" or "necrotic tissue (with or without cellular component)". Cell counting was done semi-automatically.

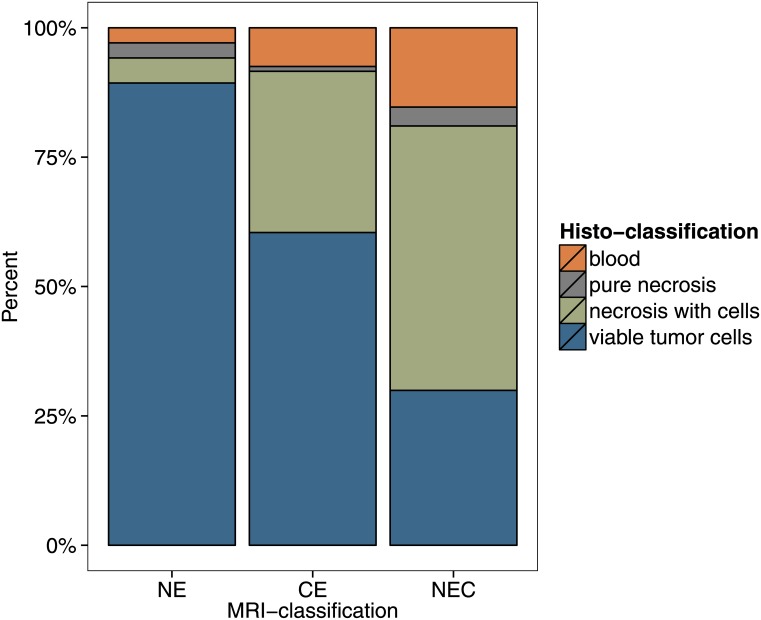
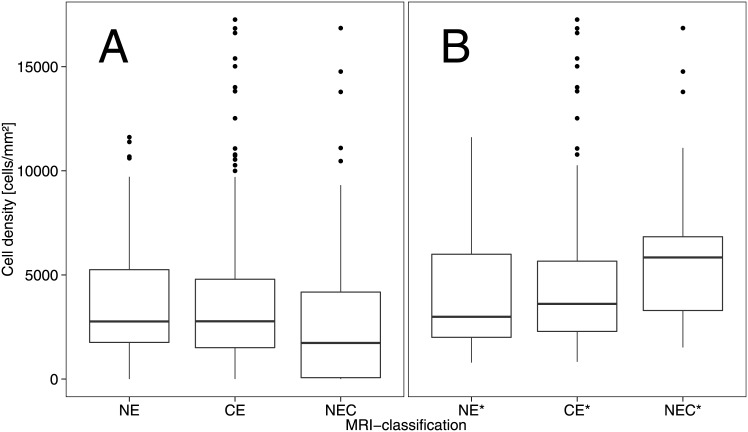
Results: NE had the highest content of tissue categorized as viable tumor cells (89% vs. 60% in CE and 30% NEC, respectively). Besides, the average cell density for NE (3764 ± 2893 cells/mm2) was comparable to CE (3506 ± 3116 cells/mm2), while NEC had a lower cell density with 2713 ± 3239 cells/mm2. If necrotic parts and bleeds were excluded, cell density in biopsies categorized as "viable tumor tissue" decreased from the center of the tumor (NEC, 5804 ± 3480 cells/mm2) to CE (4495 ± 3209 cells/mm2) and NE (4130 ± 2817 cells/mm2).

Discussion: The appearance of a glioblastoma on a cT1 image (circular enhancement, central necrosis, peritumoral edema) does not correspond to its diffuse histopathological composition. Cell density is elevated in both CE and NE parts. Hence, our study suggests that NE contains considerable amounts of infiltrative tumor with a high cellularity which might be considered in resection planning.


Conflict of interest statement

The authors have declared that no competing interests exist.

Figures

Fig 1
Fig 1. Calculation of the biopsy point S that is located in the enhancing tumor area (CE).
Combination of an axial and a coronal slide of intraoperative cT1 MRI in a 60-year-old patient with glioblastoma. Cranial view. The biopsy point S is marked within the NE-area of the tumor. The trajectory (red line, length: 50.4mm) and the biopsy point S (170/113/37) were calculated via vector analysis in MATLAB from the coordinates of the known entry point E (192/121/54) and the target point T (161/152/30). The distance between S and T was 15.0 mm.
Fig 2
Fig 2. Correlation of cT1 MRI and histology.
A) Target point T with its coordinates in an axial slide of the intraoperative cT1 MRI of the patient from Fig 1a. It lies in the CE area. B) Corresponding slice of the 1mm3 biopsy specimen (HE stain) in x20 magnification which was classified as “necrosis with cellular component”. This type of histology occurred in 31% of all biopsies originating from CE. C) Calculated biopsy point C with its coordinates in an axial slide of the intraoperative cT1 MRI of an 82-year-old patient with glioblastoma. It lies in the CE area. D) Corresponding slice of the 1mm3 biopsy specimen (HE stain) in x20 magnification which was classified as “viable tumor tissue”. This type of histology occurred in 60% of all biopsies originating from CE. E) Different biopsy point D with its coordinates along the trajectory in the same patient. It lies in the NEC area. F) Corresponding slice of the 1mm3 biopsy specimen (HE stain) in x20 magnification which was classified as “pure necrosis”. This type of histology occurred in 4% of all biopsies originating from NEC.
Fig 3
Fig 3. Correlation of biopsy point S with histology and semi-automatic cell counting.
A) Biopsy point S is located in the NE area on an axial slide of the intraoperative cT1 MRI. B) Corresponding slice of the 1mm3 biopsy specimen (HE stain) in x20 magnification which was classified as “viable tumor tissue”. This type of histology occurred in 89% of all biopsies originating from NE. C) Example of semi-automatic cell counting with the ImageJ plugin ITCN. Correctly recognized tumor cells are marked red. Yellow dots are falsely detected areas of apoptotic cells or intercellular space.
Fig 4
Fig 4. Histological composition of the different MRI classifications.
For all 561 biopsy samples, the relative frequency of the different histologic classifications within each MRI classification is displayed. NE = non-enhancing part on cT1; CE = contrast enhancement on cT1; NEC = Necrosis on cT1.
Fig 5
Fig 5. Boxplots of the cell densities in each MRI compartment.
A) Cell densities for all biopsies (“viable tumor cells”, “necrosis with cellular component”, “pure necrosis”, “blood cells”). B) Cell densities in biopsies with “viable tumor cells” only. NE = non-enhancing part on cT1; CE = contrast enhancement on cT1; NEC = Necrosis on cT1.

References

    1. DeAngelis LM. Brain tumors. The New England journal of medicine. 2001;344(2):114–23. 10.1056/NEJM200101113440207 - DOI - PubMed
    1. Wen PY, Kesari S. Malignant gliomas in adults. The New England journal of medicine. 2008;359(5):492–507. 10.1056/NEJMra0708126 - DOI - PubMed
    1. Wen PY, Norden AD, Drappatz J, Quant E. Response assessment challenges in clinical trials of gliomas. Curr Oncol Rep. 2010;12(1):68–75. 10.1007/s11912-009-0078-3 - DOI - PubMed
    1. Hardesty DA, Sanai N. The value of glioma extent of resection in the modern neurosurgical era. Frontiers in neurology. 2012;3:140 10.3389/fneur.2012.00140 - DOI - PMC - PubMed
    1. Sanai N, Berger MS. Glioma extent of resection and its impact on patient outcome. Neurosurgery. 2008;62(4):753–64; discussion 264–6. 10.1227/01.neu.0000318159.21731.cf - DOI - PubMed