Wildlife Population Dynamics in Human-Dominated Landscapes under Community-Based Conservation: The Example of Nakuru Wildlife Conservancy, Kenya
- PMID: 28103269
- PMCID: PMC5245813
- DOI: 10.1371/journal.pone.0169730
Wildlife Population Dynamics in Human-Dominated Landscapes under Community-Based Conservation: The Example of Nakuru Wildlife Conservancy, Kenya
Abstract
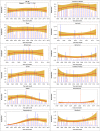
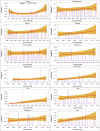
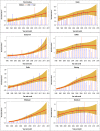
Wildlife conservation is facing numerous and mounting challenges on private and communal lands in Africa, including in Kenya. We analyze the population dynamics of 44 common wildlife species in relation to rainfall variation in the Nakuru Wildlife Conservancy (NWC), located in the Nakuru-Naivasha region of Kenya, based on ground total counts carried out twice each year from March 1996 to May 2015. Rainfall in the region was quasi-periodic with cycle periods dependent on the rainfall component and varying from 2.8 years for the dry season to 10.9 years for the wet season. These oscillations are associated with frequent severe droughts and food scarcity for herbivores. The trends for the 44 wildlife species showed five general patterns during 1996-2015. 1) Steinbuck, bushbuck, hartebeest and greater kudu numbers declined persistently and significantly throughout 1996-2015 and thus merit the greatest conservation attention. 2) Klipspringer, mongoose, oribi, porcupine, cheetah, leopard, ostrich and Sykes monkey numbers also decreased noticeably but not significantly between 1996 and 2015. 3) Dik dik, eland, African hare, Jackal, duiker, hippo and Thomson's gazelle numbers first increased and then declined between 1996 and 2015 but only significantly for duiker and hippo. 4) Aardvark, serval cat, colobus monkey, bat-eared fox, reedbuck, hyena and baboon numbers first declined and then increased but only the increases in reedbuck and baboon numbers were significant. 5) Grant's gazelle, Grevy's zebra, lion, spring hare, Burchell's zebra, bushpig, white rhino, rock hyrax, topi, oryx, vervet monkey, guinea fowl, giraffe, and wildebeest numbers increased consistently between 1996 and 2015. The increase was significant only for rock hyrax, topi, vervet monkey, guinea fowl, giraffe and wildebeest. 6) Impala, buffalo, warthog, and waterbuck, numbers increased significantly and then seemed to level off between 1996 and 2015. The aggregate biomass of primates and carnivores increased overall whereas that of herbivores first increased from 1996 to 2006 and then levelled off thereafter. Aggregate herbivore biomass increased linearly with increasing cumulative wet season rainfall. The densities of the 30 most abundant species were either strongly positively or negatively correlated with cumulative past rainfall, most commonly with the early wet season component. The collaborative wildlife conservation and management initiatives undertaken on the mosaic of private, communal and public lands were thus associated with increase or no decrease in numbers of 32 and decrease in numbers of 12 of the 44 species. Despite the decline by some species, effective community-based conservation is central to the future of wildlife in the NWC and other rangelands of Kenya and beyond and is crucially dependent on the good will, effective engagement and collective action of local communities, working in partnerships with various organizations, which, in NWC, operated under the umbrella of the Nakuru Wildlife Forum.
Conflict of interest statement
The authors have declared that no competing interests exist.
Figures


Similar articles
-
Extreme Wildlife Declines and Concurrent Increase in Livestock Numbers in Kenya: What Are the Causes?PLoS One. 2016 Sep 27;11(9):e0163249. doi: 10.1371/journal.pone.0163249. eCollection 2016. PLoS One. 2016. PMID: 27676077 Free PMC article.
-
Long-term historical and projected herbivore population dynamics in Ngorongoro crater, Tanzania.PLoS One. 2020 Mar 10;15(3):e0212530. doi: 10.1371/journal.pone.0212530. eCollection 2020. PLoS One. 2020. PMID: 32155150 Free PMC article.
-
Land use, REDD+ and the status of wildlife populations in Yaeda Valley, northern Tanzania.PLoS One. 2019 Apr 4;14(4):e0214823. doi: 10.1371/journal.pone.0214823. eCollection 2019. PLoS One. 2019. PMID: 30947305 Free PMC article.
-
Some avian and mammalian hosts of Amblyomma hebraeum and Amblyomma marmoreum (Acari: Ixodidae).Onderstepoort J Vet Res. 1987 Sep;54(3):397-403. Onderstepoort J Vet Res. 1987. PMID: 3329327 Review.
-
Conservation lessons from large-mammal manipulations in East African savannas: the KLEE, UHURU, and GLADE experiments.Ann N Y Acad Sci. 2018 Oct;1429(1):31-49. doi: 10.1111/nyas.13848. Epub 2018 May 11. Ann N Y Acad Sci. 2018. PMID: 29752729 Review.
Cited by
-
Hunter-Gatherers in context: Mammal community composition in a northern Tanzania landscape used by Hadza foragers and Datoga pastoralists.PLoS One. 2021 May 14;16(5):e0251076. doi: 10.1371/journal.pone.0251076. eCollection 2021. PLoS One. 2021. PMID: 33989291 Free PMC article.
-
Aedes vector-host olfactory interactions in sylvatic and domestic dengue transmission environments.Proc Biol Sci. 2019 Nov 6;286(1914):20192136. doi: 10.1098/rspb.2019.2136. Epub 2019 Nov 6. Proc Biol Sci. 2019. PMID: 31690238 Free PMC article.
-
Extreme Wildlife Declines and Concurrent Increase in Livestock Numbers in Kenya: What Are the Causes?PLoS One. 2016 Sep 27;11(9):e0163249. doi: 10.1371/journal.pone.0163249. eCollection 2016. PLoS One. 2016. PMID: 27676077 Free PMC article.
-
Genetic connectivity and population structure of African savanna elephants (Loxodonta africana) in Tanzania.Ecol Evol. 2020 Oct 9;10(20):11069-11089. doi: 10.1002/ece3.6728. eCollection 2020 Oct. Ecol Evol. 2020. PMID: 33144949 Free PMC article.
-
Long-term historical and projected herbivore population dynamics in Ngorongoro crater, Tanzania.PLoS One. 2020 Mar 10;15(3):e0212530. doi: 10.1371/journal.pone.0212530. eCollection 2020. PLoS One. 2020. PMID: 32155150 Free PMC article.
References
-
- Ottichilo WK, Grunblatt J, Said MY, Wargute PW (2000) Wildlife and livestock population trends in the Kenya rangeland In: Prins HHT, Grootenhuis JG, Dolan TT, editors. Wildlife conservation by sustainable use.Netherlands: Springer; pp. 203–218.
-
- Meinertzhagen R Kenya Diary (1902–1906) (1957, p. 82). Edinburgh: Oliver and Boyd.
-
- Percival AB (1928) A game Ranger on Safari. London: Nesbit & Co Ltd.
-
- Chapman A. (1908) On Safari, Edward Arnold, London.
MeSH terms
LinkOut - more resources
Full Text Sources
Other Literature Sources
Research Materials
Miscellaneous

