

Crude Extracts, Flavokawain B and Alpinetin Compounds from the Rhizome of Alpinia mutica Induce Cell Death via UCK2 Enzyme Inhibition and in Turn Reduce 18S rRNA Biosynthesis in HT-29 Cells
- PMID: 28103302
- PMCID: PMC5245823
- DOI: 10.1371/journal.pone.0170233
Crude Extracts, Flavokawain B and Alpinetin Compounds from the Rhizome of Alpinia mutica Induce Cell Death via UCK2 Enzyme Inhibition and in Turn Reduce 18S rRNA Biosynthesis in HT-29 Cells
Erratum in
-
Correction: Crude Extracts, Flavokawain B and Alpinetin Compounds from the Rhizome of Alpinia mutica Induce Cell Death via UCK2 Enzyme Inhibition and in Turn Reduce 18S rRNA Biosynthesis in HT-29 Cells.PLoS One. 2017 Mar 7;12(3):e0173651. doi: 10.1371/journal.pone.0173651. eCollection 2017. PLoS One. 2017. PMID: 28267789 Free PMC article.
Abstract
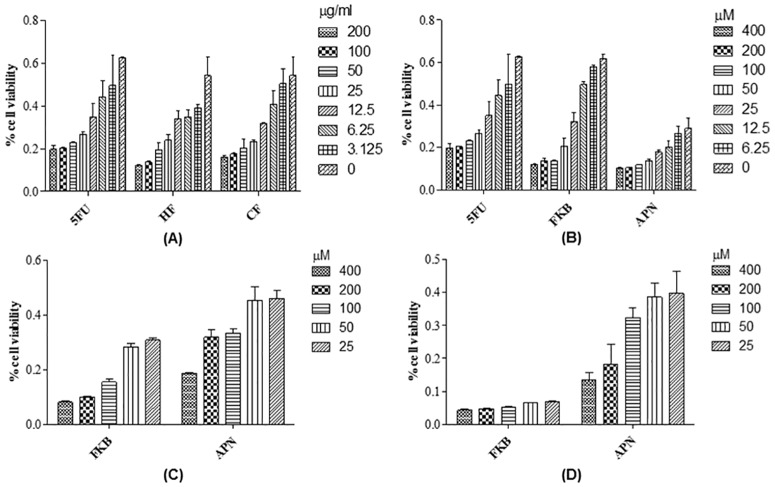
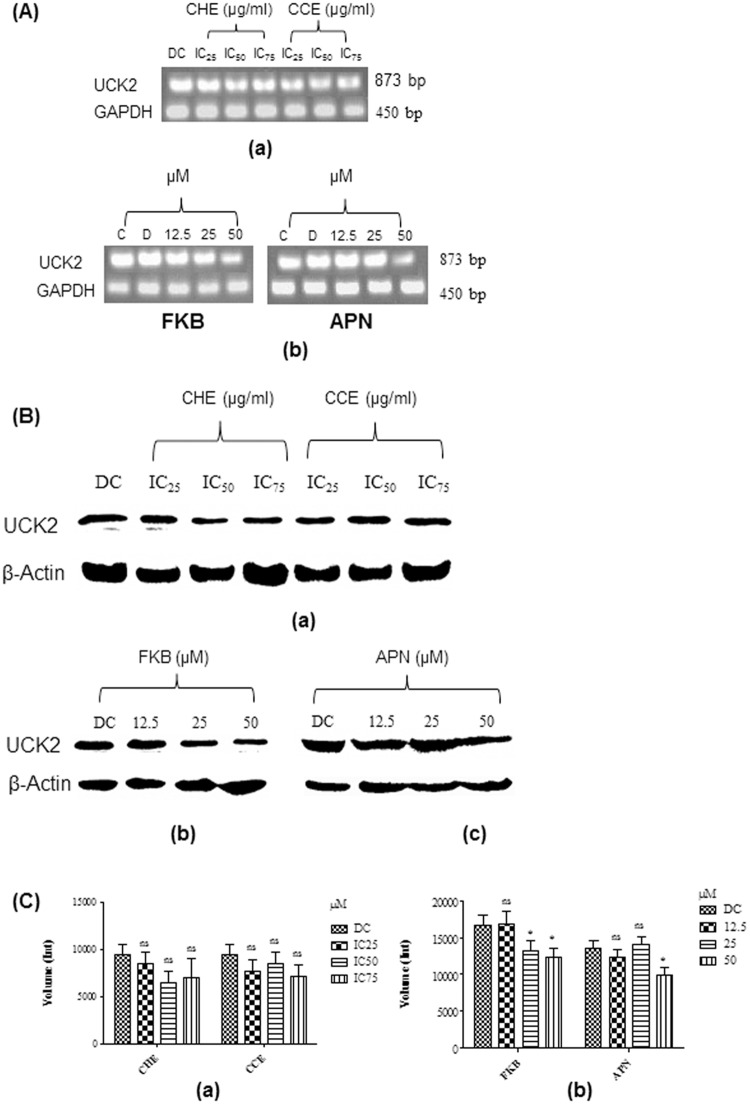
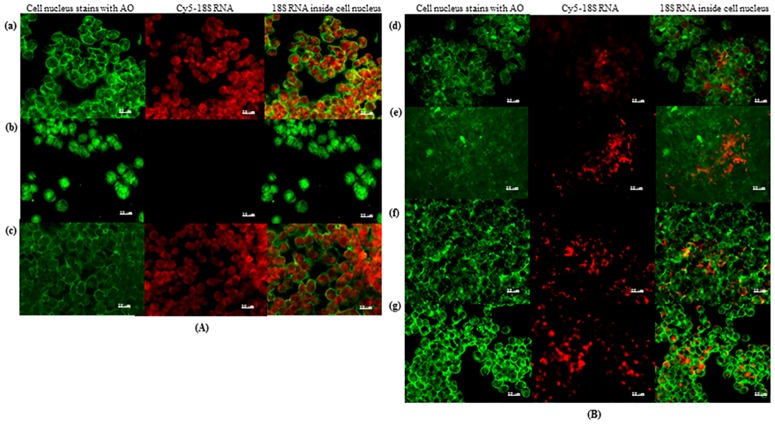
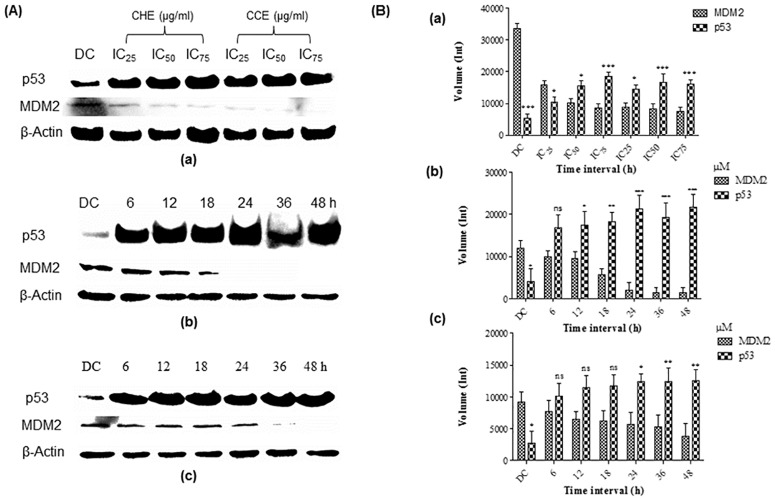
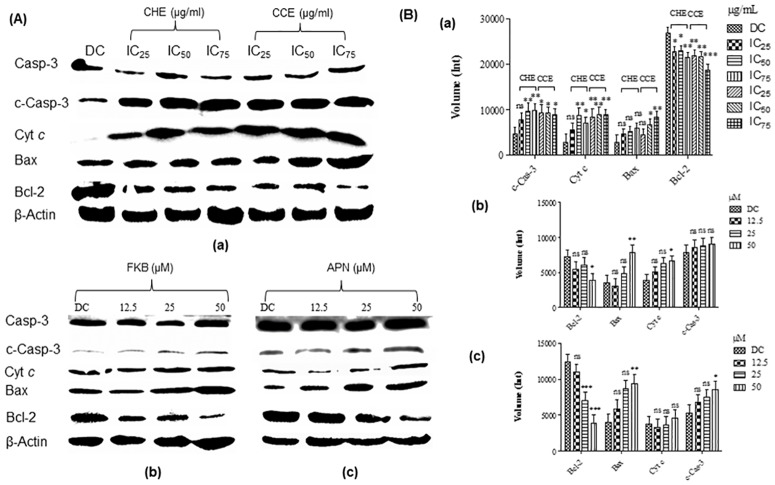
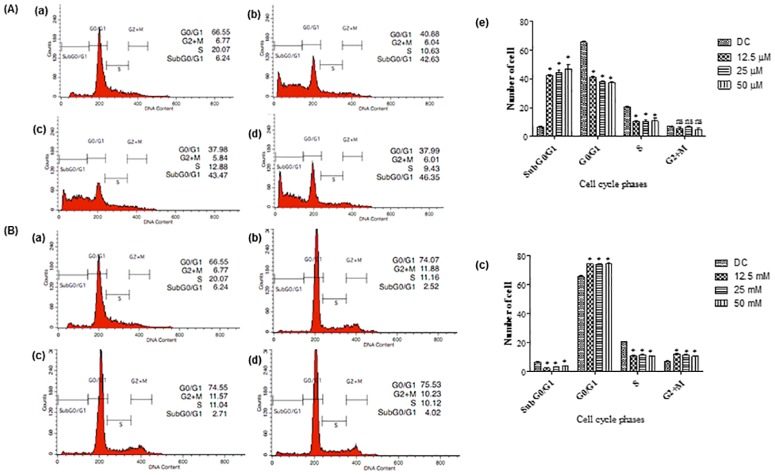
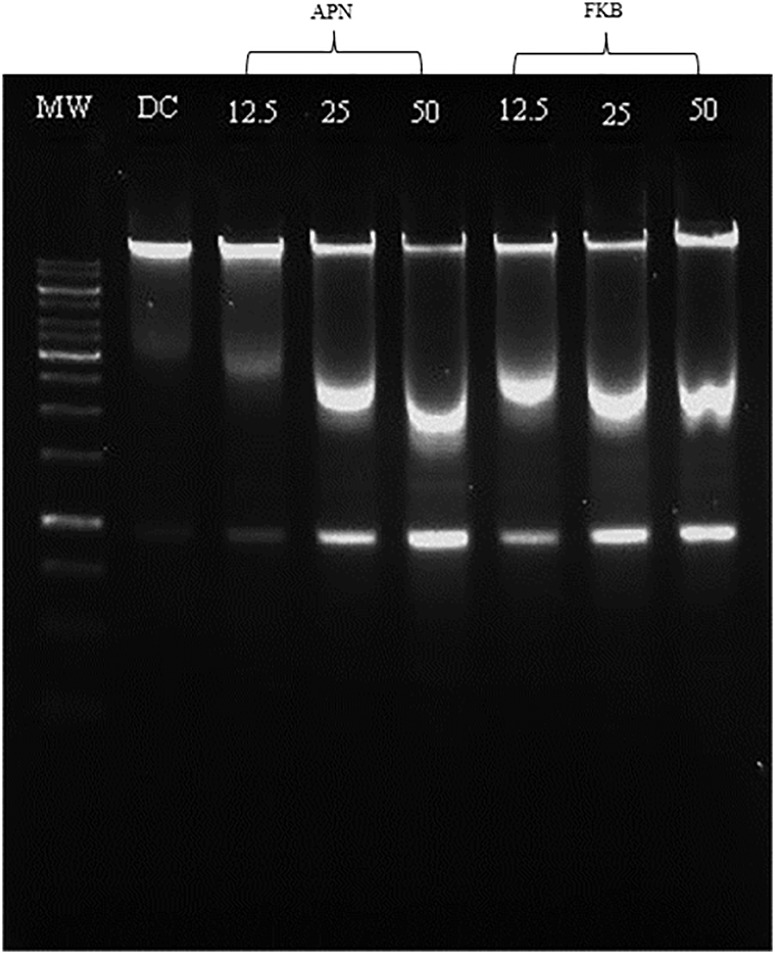
Uridine-cytidine kinase 2 is an enzyme that is overexpressed in abnormal cell growth and its implication is considered a hallmark of cancer. Due to the selective expression of UCK2 in cancer cells, a selective inhibition of this key enzyme necessitates the discovery of its potential inhibitors for cancer chemotherapy. The present study was carried out to demonstrate the potentials of natural phytochemicals from the rhizome of Alpinia mutica to inhibit UCK2 useful for colorectal cancer. Here, we employed the used of in vitro to investigate the effectiveness of natural UCK2 inhibitors to cause HT-29 cell death. Extracts, flavokawain B, and alpinetin compound from the rhizome of Alpinia mutica was used in the study. The study demonstrated that the expression of UCK2 mRNA were substantially reduced in treated HT-29 cells. In addition, downregulation in expression of 18S ribosomal RNA was also observed in all treated HT-29 cells. This was confirmed by fluorescence imaging to measure the level of expression of 18S ribosomal RNA in live cell images. The study suggests the possibility of MDM2 protein was downregulated and its suppression subsequently activates the expression of p53 during inhibition of UCK2 enzyme. The expression of p53 is directly linked to a blockage of cell cycle progression at G0/G1 phase and upregulates Bax, cytochrome c, and caspase 3 while Bcl2 was deregulated. In this respect, apoptosis induction and DNA fragmentation were observed in treated HT-29 cells. Initial results from in vitro studies have shown the ability of the bioactive compounds of flavokawain B and alpinetin to target UCK2 enzyme specifically, inducing cell cycle arrest and subsequently leading to cancer cell death, possibly through interfering the MDM2-p53 signalling pathway. These phenomena have proven that the bioactive compounds could be useful for future therapeutic use in colon cancer.
Conflict of interest statement
The authors have declared that no competing interests exist.
Figures
Similar articles
-
Correction: Crude Extracts, Flavokawain B and Alpinetin Compounds from the Rhizome of Alpinia mutica Induce Cell Death via UCK2 Enzyme Inhibition and in Turn Reduce 18S rRNA Biosynthesis in HT-29 Cells.PLoS One. 2017 Mar 7;12(3):e0173651. doi: 10.1371/journal.pone.0173651. eCollection 2017. PLoS One. 2017. PMID: 28267789 Free PMC article.
-
In Silico Discovery of Potential Uridine-Cytidine Kinase 2 Inhibitors from the Rhizome of Alpinia mutica.Molecules. 2016 Apr 8;21(4):417. doi: 10.3390/molecules21040417. Molecules. 2016. PMID: 27070566 Free PMC article.
-
Flavokawain B inhibits growth of human squamous carcinoma cells: Involvement of apoptosis and cell cycle dysregulation in vitro and in vivo.J Nutr Biochem. 2012 Apr;23(4):368-78. doi: 10.1016/j.jnutbio.2011.01.002. Epub 2011 May 2. J Nutr Biochem. 2012. PMID: 21543203
-
Involvement of the uridine cytidine kinase 2 enzyme in cancer cell death: A molecular crosstalk between the enzyme and cellular apoptosis induction.Biomed Pharmacother. 2019 Jan;109:1506-1510. doi: 10.1016/j.biopha.2018.10.200. Epub 2018 Nov 14. Biomed Pharmacother. 2019. PMID: 30551402 Review.
-
Current pharmacological and phytochemical studies of the plant Alpinia galanga.Zhong Xi Yi Jie He Xue Bao. 2011 Oct;9(10):1061-5. doi: 10.3736/jcim20111004. Zhong Xi Yi Jie He Xue Bao. 2011. PMID: 22015185 Review.
Cited by
-
Discovery of small molecule inhibitors of human uridine-cytidine kinase 2 by high-throughput screening.Bioorg Med Chem Lett. 2019 Sep 15;29(18):2559-2564. doi: 10.1016/j.bmcl.2019.08.010. Epub 2019 Aug 7. Bioorg Med Chem Lett. 2019. PMID: 31420268 Free PMC article.
-
The Metabolic and Non-Metabolic Roles of UCK2 in Tumor Progression.Front Oncol. 2022 May 20;12:904887. doi: 10.3389/fonc.2022.904887. eCollection 2022. Front Oncol. 2022. PMID: 35669416 Free PMC article. Review.
-
Correction: Crude Extracts, Flavokawain B and Alpinetin Compounds from the Rhizome of Alpinia mutica Induce Cell Death via UCK2 Enzyme Inhibition and in Turn Reduce 18S rRNA Biosynthesis in HT-29 Cells.PLoS One. 2017 Mar 7;12(3):e0173651. doi: 10.1371/journal.pone.0173651. eCollection 2017. PLoS One. 2017. PMID: 28267789 Free PMC article.
-
Comprehensive multi-omics analysis of nucleotide metabolism: elucidating the role and prognostic significance of UCK2 in bladder cancer.Funct Integr Genomics. 2025 Jun 21;25(1):133. doi: 10.1007/s10142-025-01642-w. Funct Integr Genomics. 2025. PMID: 40542213
-
UCK2 promotes intrahepatic cholangiocarcinoma progression and desensitizes cisplatin treatment by PI3K/AKT/mTOR/autophagic axis.Cell Death Discov. 2024 Aug 23;10(1):375. doi: 10.1038/s41420-024-02140-x. Cell Death Discov. 2024. PMID: 39179560 Free PMC article.
References
MeSH terms
Substances
LinkOut - more resources
Full Text Sources
Other Literature Sources
Research Materials
Miscellaneous
