. 2017 Jan 19;13(1):e1006095.
doi: 10.1371/journal.ppat.1006095. eCollection 2017 Jan.

Mycobacterium marinum Degrades Both Triacylglycerols and Phospholipids from Its Dictyostelium Host to Synthesise Its Own Triacylglycerols and Generate Lipid Inclusions

Affiliations

Mycobacterium marinum Degrades Both Triacylglycerols and Phospholipids from Its Dictyostelium Host to Synthesise Its Own Triacylglycerols and Generate Lipid Inclusions

Caroline Barisch et al. PLoS Pathog. .

Abstract

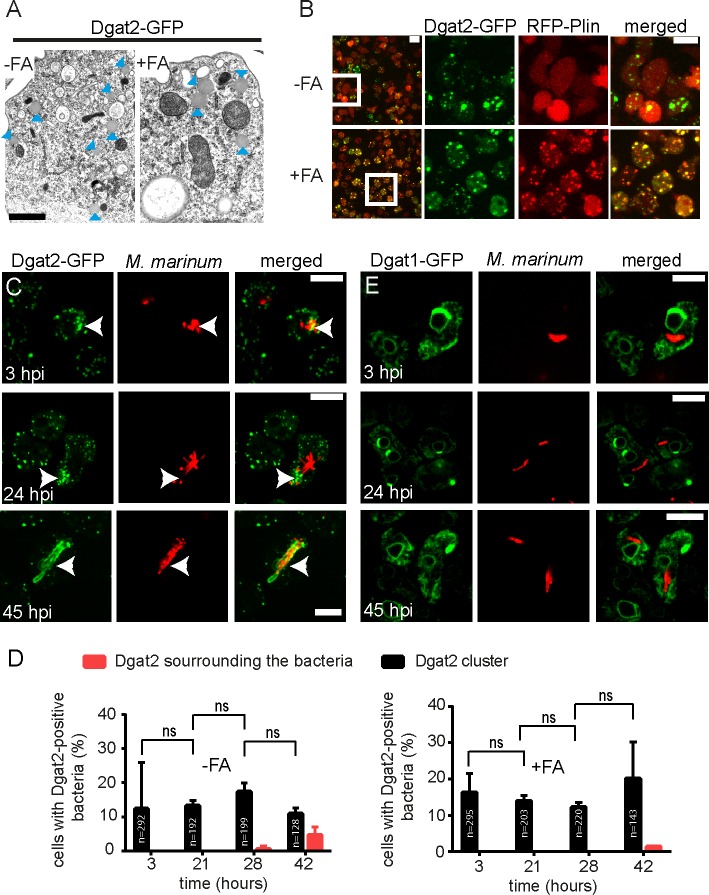
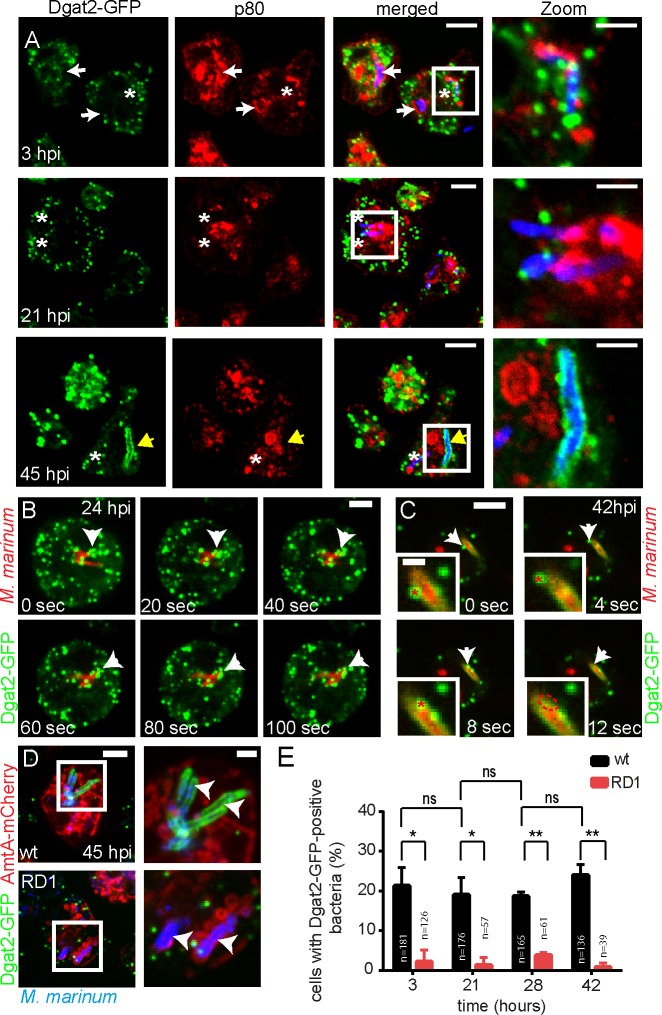
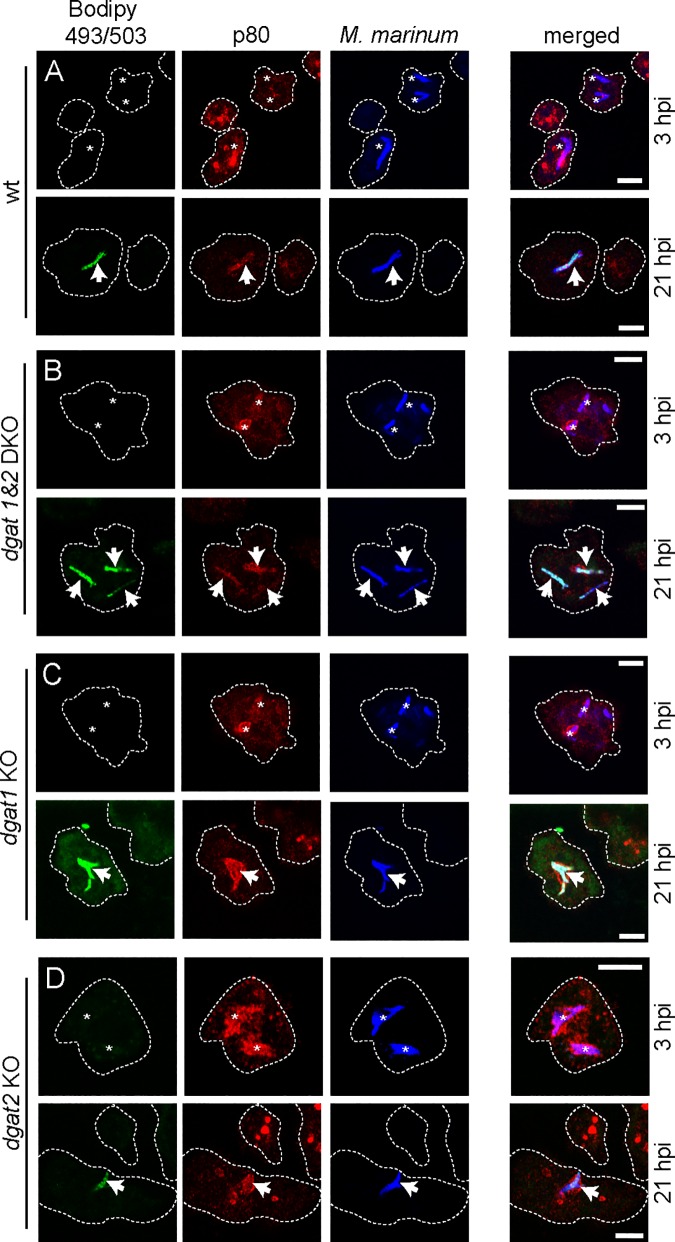
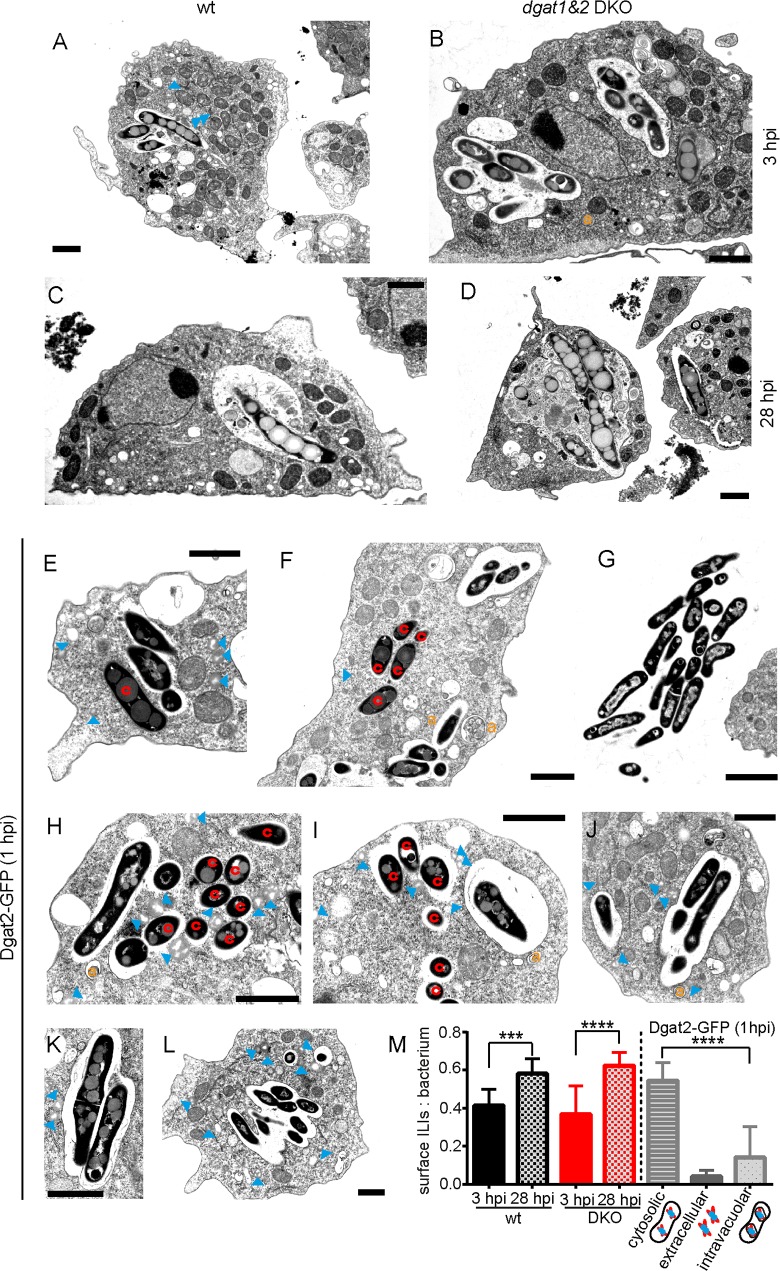
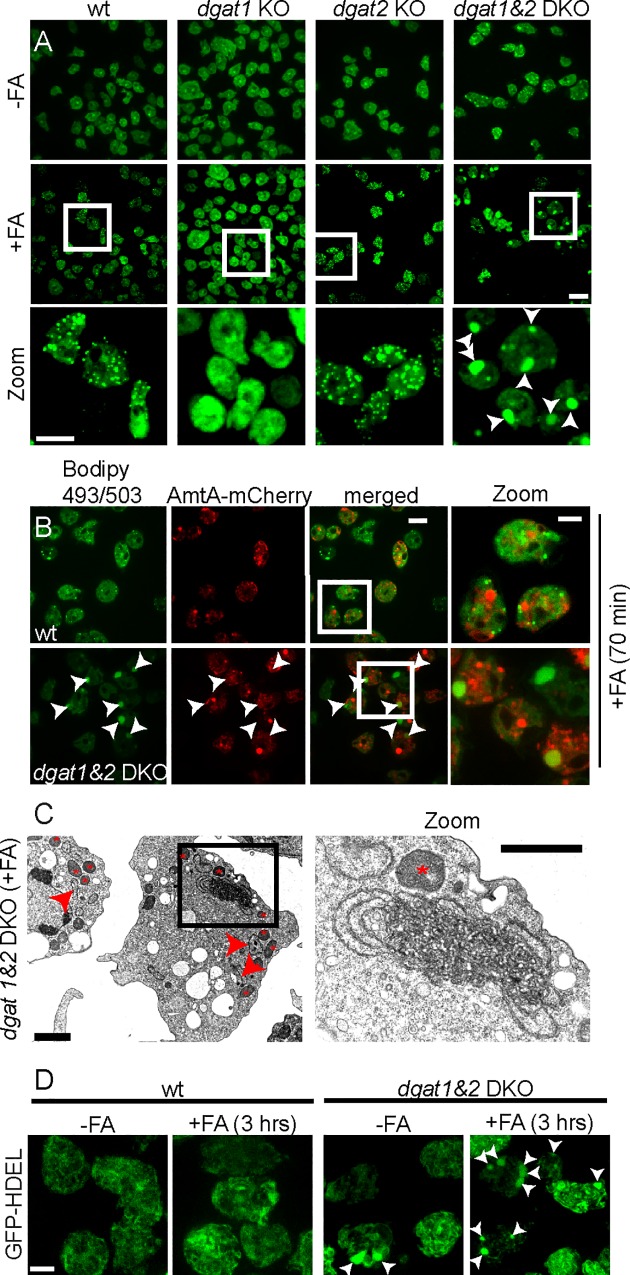
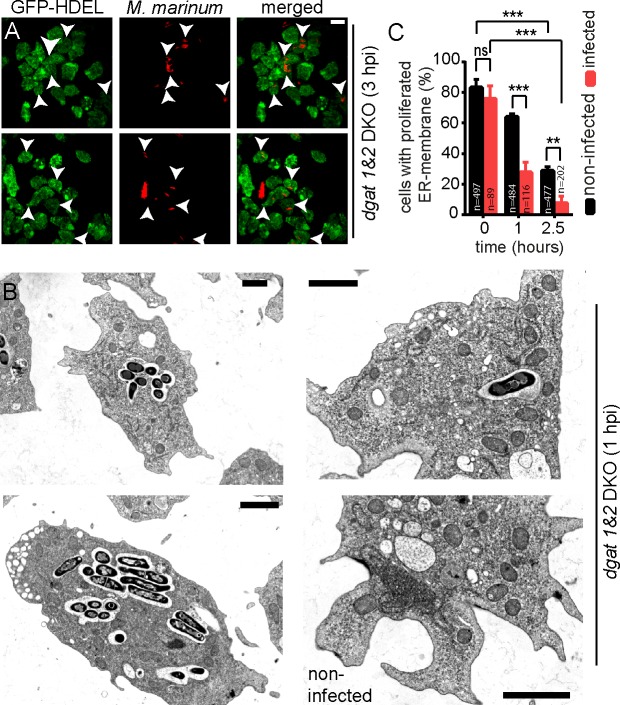
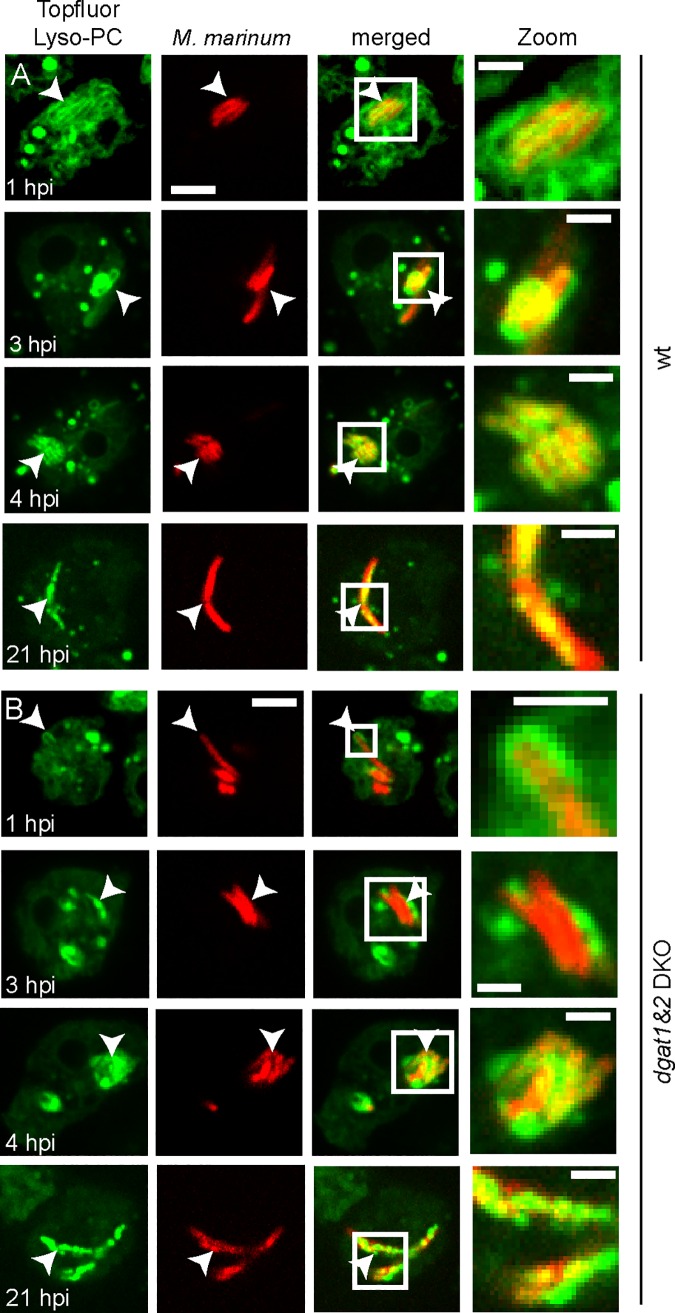
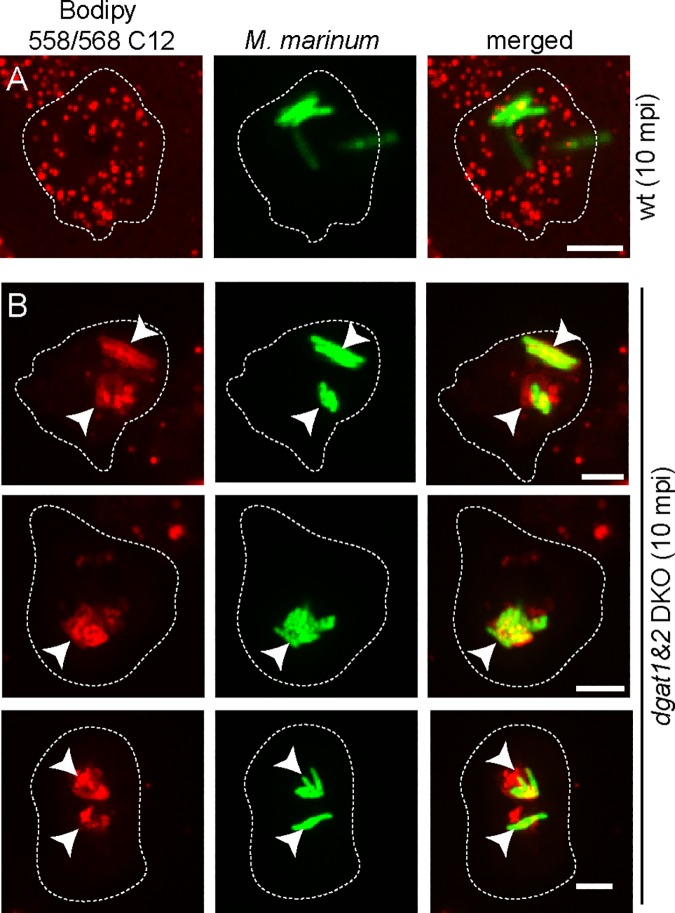
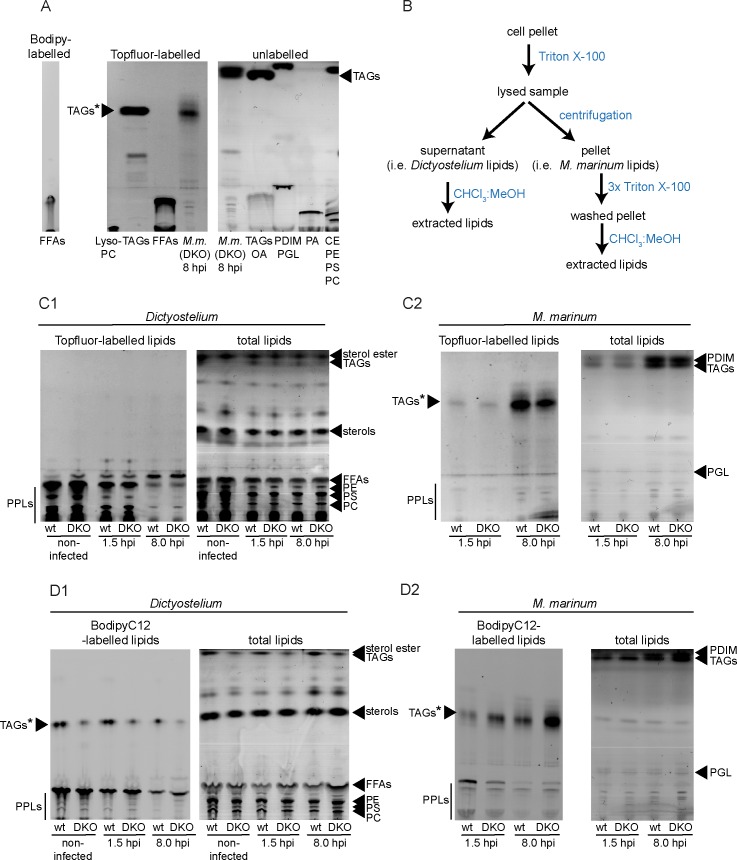
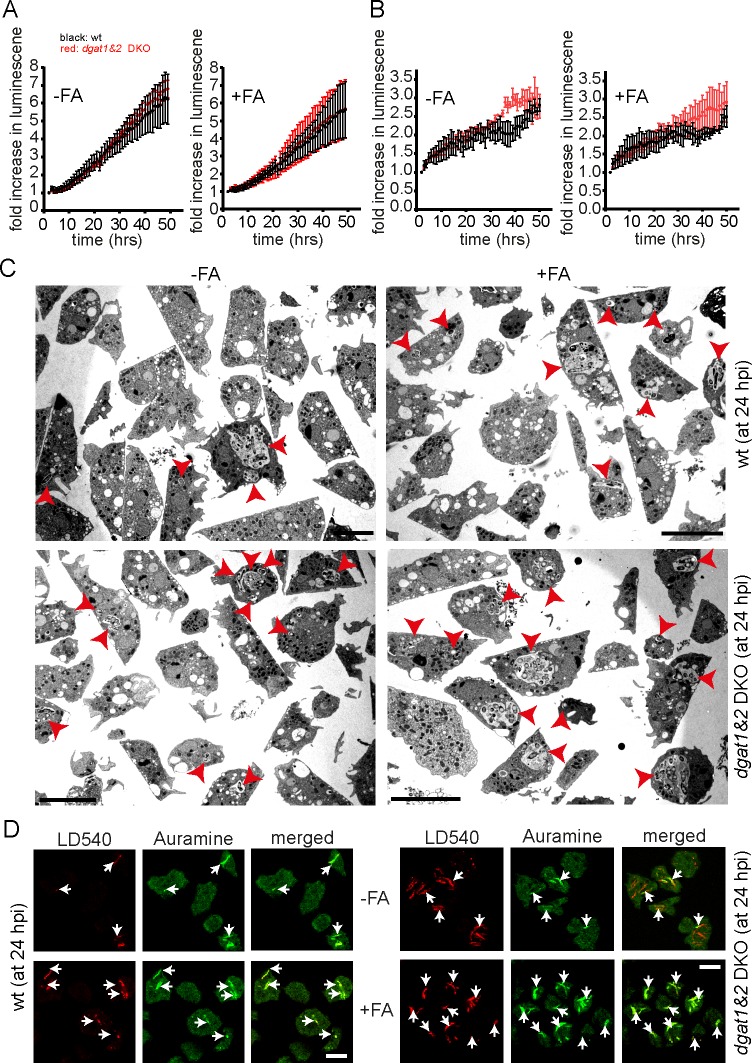
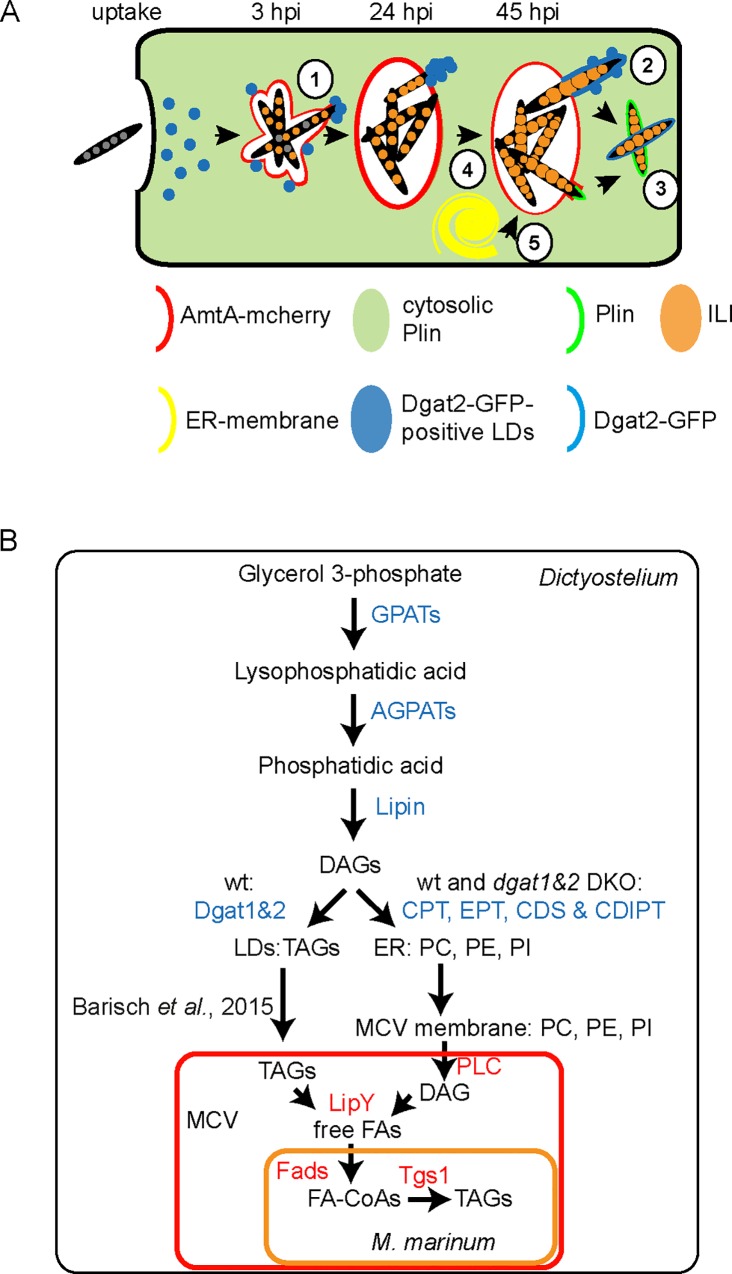
During a tuberculosis infection and inside lipid-laden foamy macrophages, fatty acids (FAs) and sterols are the major energy and carbon source for Mycobacterium tuberculosis. Mycobacteria can be found both inside a vacuole and the cytosol, but how this impacts their access to lipids is not well appreciated. Lipid droplets (LDs) store FAs in form of triacylglycerols (TAGs) and are energy reservoirs of prokaryotes and eukaryotes. Using the Dictyostelium discoideum/Mycobacterium marinum infection model we showed that M. marinum accesses host LDs to build up its own intracytosolic lipid inclusions (ILIs). Here, we show that host LDs aggregate at regions of the bacteria that become exposed to the cytosol, and appear to coalesce on their hydrophobic surface leading to a transfer of diacylglycerol O-acyltransferase 2 (Dgat2)-GFP onto the bacteria. Dictyostelium knockout mutants for both Dgat enzymes are unable to generate LDs. Instead, the excess of exogenous FAs is esterified predominantly into phospholipids, inducing uncontrolled proliferation of the endoplasmic reticulum (ER). Strikingly, in absence of host LDs, M. marinum alternatively exploits these phospholipids, resulting in rapid reversal of ER-proliferation. In addition, the bacteria are unable to restrict their acquisition of lipids from the dgat1&2 double knockout leading to vast accumulation of ILIs. Recent data indicate that the presence of ILIs is one of the characteristics of dormant mycobacteria. During Dictyostelium infection, ILI formation in M. marinum is not accompanied by a significant change in intracellular growth and a reduction in metabolic activity, thus providing evidence that storage of neutral lipids does not necessarily induce dormancy.


Conflict of interest statement

The authors have declared that no competing interests exist.

Figures

Fig 1
Fig 1. Localization of Dgat1- and Dgat2-GFP during infection of Dictyostelium with M. marinum.
A. LDs with their typical morphology are formed in cells overexpressing Dgat2-GFP even without FA supplementation. Cells that were treated with and without FAs were fixed and processed for EM. Arrowheads label LDs. Scale bar, 1 μm. B.Dynamics of RFP-Plin and Dgat2-GFP in Dictyostelium treated with exogenous FAs. In axenic medium without FA supplementation, RFP-Plin is cytosolic whereas Dgat2-GFP is located on LDs. Upon treatment with exogenous FAs, RFP-Plin translocates to the surface of LDs where it co-localizes with Dgat2-GFP. Dictyostelium expressing both RFP-Plin and Dgat2-GFP was cultured in medium supplemented with FAs and a time-lapse movie was recorded with 5 min frame intervals. Shown is the maximum z-projection of 6 sections spaced 1.5 μm apart. Scale bars, 10 μm. C. Dgat2-GFP-positive LDs cluster at bacterial poles. Dictyostelium expressing Dgat2-GFP was infected with mCherry-expressing mycobacteria. Samples for live imaging were taken at 3, 24 and 45 hpi. Dictyostelium was fed with FA prior to infection. Arrows point to LD clusters. Scale bars, 10 μm. D. Quantification of C. The number of Dictyostelium cells harbouring bacteria that co-localize with LDs aggregates was stable over the time course of infection. Bacteria surrounded by Dgat2-GFP were only observed at late stages, as judged by quantification using z-projections. The statistical significance was calculated with an unpaired t-test (* p<0.05, ** p<0.01). Bars represent the mean and SD of two independent experiments. E. Dgat1-GFP is enriched at the ER and at the perinuclear ER during infection of Dictyostelium with mCherry-expressing M. marinum. Samples for live imaging were taken at 3, 24 and 45 hpi. Dictyostelium was fed with FA prior to infection. Scale bars, 10 μm.
Fig 2
Fig 2. Dynamics of Dgat2-GFP-LDs during infection.
A. Dgat2-GFP-positive LDs attach to the bacteria when they are exposed to the cytosol (3 and 21 hpi). At a later infection stage, Dgat2-GFP completely surrounds a cytosolic bacterium (45 hpi). White arrows point to bacteria that are inside the p80-positive MCV. Asterisks label bacteria that are partially exposed to the cytosol. The yellow arrow points to a cytosolic bacterium that is completely surrounded by Dgat2-GFP. Scale bars, 10 μm; Zoom, 2 μm. B. Dgat2-GFP-labelled LDs stick to an intracellular mCherry-expressing mycobacterium. A time-lapse movie was recorded at 24 hpi with 5 sec frame intervals. Arrows point to LDs aggregated at the surface of the bacterium. Scale bar, 3 μm. C. Coalescence of a Dgat2-GFP-positive LD with an mCherry-expressing mycobacterium surrounded by Dgat2-GFP (arrows). A time-lapse movie was recorded at 42 hpi with 2 sec frame intervals. Arrows point to an LD that coalescences onto the bacterium. Asterisks label the same LD in the Zoom. Scale bar, 5 μm; Zoom, 2μm. D. Dgat2-GFP surrounds a cytosolic wild type M. marinum negative for AmtA-mCherry. No co-localization was observed with M. marinum ΔRD1. Arrows label intracellular bacteria. Samples were taken at 45 hpi and bacteria stained with Vybrant Ruby. Scale bars, 5 μm. E. Quantification of D. While clusters of Dgat2-GFP-labelled LDs were frequently observed close to wild type M. marinum, only a few LDs associated with the RD1 mutant. Dgat2-GFP-positive bacteria were counted in maximum z-projections. Statistical significance was calculated with an unpaired t-test (* p<0.05, ** p<0.01). Bars represent the mean and SD of two independent experiments. For all the experiments presented in Fig 2 Dictyostelium was fed with FA prior to infection.
Fig 3
Fig 3. Bacteria accumulate ILIs in the dgat KO mutants.
Cells of (A) wild type, (B) dgat1&2 DKO, (C) dgat1 KO and (D) dgat2 KO and were infected with mCherry-expressing M. marinum. At 3 hpi bacteria are lean (asterisks) whereas at 21 hpi bacteria harbour many ILIs in all cell types (arrows). Cells were fed with FAs prior to infection. At the indicated time points samples were fixed with PFA/picric acid, and MCVs visualized by staining for p80. Bacterial ILIs were stained with Bodipy 493/503. Scale bar, 5 μm.
Fig 4
Fig 4. LD and ILI dynamics during infection.
A.—D. Bacteria accumulate ILIs in the wild type and the dgat1&2 DKO. E. and F. Cytosolic bacteria harbour more ILIs than bacteria inside an MCV. G. Extracellular bacteria are lean. H. and I. LDs translocate to cytosolic bacteria J.—L. LDs are recruited to the vicinity of the MCV early in infection. Dictyostelium wild type (A and C) and dgat1&2 DKO cells (B and D) or cells expressing Dgat2-GFP (E-L) were infected with unlabelled M. marinum wild type. At the indicated time points, samples were fixed and further processed for EM. Arrowheads label LDs. a: autophagosomes, c: cytosolic bacteria. Scale bars, 1 μm. M. Quantification of the ILI surface per bacterium as a fraction of the total bacterium surface. For each condition ILIs of 10 to 13 bacteria were quantified using FIJI. The statistical significance was calculated with an unpaired t-test (*** p<0.001, **** p<0.0001). For all the experiments presented in Fig 4 Dictyostelium was fed with FA prior to infection.
Fig 5
Fig 5. Excess FAs leads to ER-membrane proliferation in dgat1&2 DKO cells.
A. LDs are formed in wild type and dgat2, but not in dgat1 KO cells. Instead of LDs, massive Bodipy-positive structures were observed in the dgat1&2 DKO (arrowheads). FAs were added to the culture medium and a time-lapse movie was recorded with 10 minute frame intervals. Shown are maximum z-projections of 6 sections 1.5 μm apart taken after 180 min. Scale bars, 10 μm. B. The neutral lipid structures in the dgat1&2 DKO (arrowheads) are not of endosomal nature. Wild type or dgat1&2 DKO cells expressing AmtA-mCherry were incubated with FAs and a time-lapse movie with 5 min frame intervals was recorded. Shown is a representative image taken after 70 min. Scale bar, 10 μm; Zoom 5 μm. C. The neutral lipid structures in the dgat1&2 DKO are formed by ER-membranes. Dictyostelium was fed 3 hours with FAs before fixation with glutaraldehyde. Asterisks label mitochondria that have been seen close to the ER-membrane-proliferations. Arrowheads point to long ER-strands. D. GFP-HDEL accumulates in the ER-membrane proliferations in the dgat1&2 DKO. Images of Dictyostelium expressing GFP-HDEL were taken under normal conditions (-FAs) and after 3 hrs incubation with FAs (+FAs). Shown are maximum z-projections. Arrowheads point to ER-membrane proliferations. Scale bar, 5 μm.
Fig 6
Fig 6. ER-membrane proliferations are depleted in infected cells.
A. Dgat1&2 DKO cells expressing GFP-HDEL were infected with mCherry-expressing mycobacteria. Shown are two maximum z-projections taken at 3 hpi. Scale bar, 10 μm. B. The dgat1&2 DKO was infected with unlabelled M. marinum. Cells were fixed at 1 hpi and further processed for EM. Shown are three examples of infected cells, and one of an uninfected Dictyostelium cell. Scale bars, 2 μm. C. The percentage of cells showing proliferation of ER membranes as a function of time. Dgat1&2 DKO cells expressing GFP-HDEL were either infected with mCherry-expressing M. marinum or left non-infected. The statistical significance was calculated with an unpaired t-test (** p<0.01, *** p<0.001). Bars represent the mean and SD of three independent experiments. At the indicated time points, images were taken for manual quantification. For all the experiments presented in Fig 6 Dictyostelium was fed with FA prior to infection.
Fig 7
Fig 7. Lipids derived from host phospholipids are transferred to the MCV.
A. and B. Topfluor-LysoPC-tagged host lipids first label the membrane of the MCV, accumulate inside the compartment and are finally found inside the bacteria. Phospholipids of wild type (A) and dgat1&2 DKO (B) were labelled with Topfluor-LysoPC as described in materials and methods. Cells were infected with mCherry-expressing mycobacteria. Images were taken at the indicated time points. Scale bar, 5 μm; Zoom, 2μm.
Fig 8
Fig 8. Fate of BodipyC12 –labelled host lipids early during infection of wild type and dgat1&2 DKO.
A. and B. In contrast to the wild type cells in which BodipyC12 labels host LDs (A), the fluorescent FA becomes integrated into the membrane of the MCV in dgat1&2 DKO cells (B). Dictyostelium cells were labelled with BodipyC12 as described previously [12]. Wild type and dgat1&2 DKO were infected with GFP-expressing M. marinum. Arrows point to bacteria that are in BodipyC12-labelled compartments. Images were taken 10 minutes post infection (mpi). Scale bars, 2 μm.
Fig 9
Fig 9. M. marinum uses host phospholipids to build up TAGs.
A. Topfluor- and Bodipy-labelled lipid standards show a different migration behaviour than unlabelled standards. The migration of BodipyC12, Topfluor-FFAs (C11), Topfluor-TAGs (TAGs*; 18:1, 18:1, C11) and Topfluor-LysoPC was compared to unlabelled standards for TAGs (Triolein) and FAs (oleic acid (OA)). Additionally, the migration of PDIM, phenolic glycolipids (PGL), phosphatidic acid (PA), cholesterol esters (CE), PE, PS and PC was monitored by using the respective standards. B. Scheme showing how lipids of host and pathogen were separated prior to extraction with chloroform/methanol. C. and D. M. marinum incorporates host-derived lipids into TAGs. Wild type and dgat1&2 DKO cells were labelled with Topfluor-LysoPC (C) and BodipyC12 (D) as described in materials and methods. Cells were infected with unlabelled M. marinum. At the indicated time points samples were taken for lipid extraction. To separate host (C1 and D1) and bacterial lipids (C2 and D2), cells were lysed with 0.05% TritonX-100 and the lipids of the pellet (bacterial lipids) were extracted with chloroform:methanol (1:2) for 24 hrs. The lipids of the supernatant (host lipids) were directly extracted with chloroform:methanol (1:2). Bands were identified by comparison with lipid standards. PPLs: phospholipids.
Fig 10
Fig 10. Bacteria are metabolically active and remain acid-fast positive in the dgat1&2 DKO cells.
A. Metabolic activity of M. marinum is unaltered in the dgat1&2 DKO. Wild type and dgat1&2 DKO cells were infected with bacteria expressing bacterial luciferase. Luminescence was recorded every hour with a microplate reader. Shown is the fold increase in luminescence over time. Symbols and error bars indicate the mean and SEM of three independent experiments. A two-way ANOVA test indicated no statistical difference between the curves. B. The number of intracellular bacteria is comparable between wild type and dgat1&2 DKO cells. Dictyostelium cells were infected with mCherry-expressing M. marinum, stained with Bodipy493/503 and plated on 96-well plates. Images were recorded every hour with a high content microscope. After imaging, Dictyostelium cells and bacteria were segmented and analysed. Symbols and error bars indicate the mean and SEM of three independent experiments. A two-way ANOVA test indicated no statistical difference between the curves. C. Dgat1&2 DKO cells harbour more bacteria compared to wild type cells. Wild type and the dgat1&2 DKO cells were infected with unlabelled M. marinum wild type. At 24 hpi, cells were fixed with glutaraldehyde, stained with osmium and further processed for EM. Dictyostelium was fed with FAs prior to infection. Scale bars, 10 μm. D. Bacteria remain acid-fast positive in the dgat1&2 DKO. Cells of wild type Dictyostelium and the dgat1&2 DKO were infected with unlabelled M. marinum. At 24 hpi cells were fixed and subsequently stained with AuramineO and LD540. Cells were fed with FAs prior to infection where indicated. Arrows point to intracellular bacteria. Scale bars, 10 μm.
Fig 11
Fig 11. Schematic summary.
A. Fate of LDs and phospholipids during infection of the Dictyostelium with M. marinum. 1. Dgat2-GFP-positive LDs that are usually dispersed, cluster around bacterial poles that became exposed to the cytosol. 2. At very late infection stages (around 45 hpi), Dgat2-GFP-positive LDs coalesce with the surface of cytosolic bacteria leading to bacteria labelling. 3. Plin restricts Dgat2-binding to the surface of bacteria. Because Plin is recruited to LDs from a cytosolic pool, in absence of FAs it relocates faster to the cytosolic bacteria surface than Dgat2 that is always bound to LDs. 4. Bacteria are able to accumulate numerous and large ILIs inside the dgat1&2 DKO that is devoid of LDs. 5. In the dgat1&2 DKO, excess FAs is shuttled into phospholipids leading to proliferations of the ER-membrane. These phospholipids then serve as carbon source for M. marinum. B. Overview of de novo lipid synthesis in Dictyostelium wild type and dgat1&2 DKO and lipid transfer to M. marinum. TAGs in Dictyostelium are mainly synthesised from glycerol-3-phosphate. The key enzymes (GPATs, AGPATs, Lipin and DGATs) are conserved between Dictyostelium and mammalian cells. Under normal, wild type-like conditions, TAG-filled LDs first translocate to the MCV leading to the accumulation of neutral lipids inside the compartment [12]. The delivered lipids are then used by the bacteria to build up their own TAGs and ILIs [12]. In the dgat1&2 DKO the situation is different, since exogenous FAs are not utilized for LD biogenesis, but are shuttled into phospholipids. We propose that these phospholipids are cleaved at the membrane of the MCV by PLCs that are secreted by M. marinum. This results in the formation of DAG, which is finally hydrolysed by the secreted TAG-lipase of M. marinum (LipY (MMAR_1547)) leading to free FAs. Finally, the released free FAs are re-esterfied to bacterial TAGs probably by the activity of various Fads and Tgs1 (MMAR_1519) [13]).

Similar articles

Cited by

References

    1. Dutta NK, Karakousis PC. Latent tuberculosis infection: myths, models, and molecular mechanisms. Microbiol Mol Biol Rev. 2014;78: 343–71. 10.1128/MMBR.00010-14 - DOI - PMC - PubMed
    1. Guirado E, Schlesinger LS. Modeling the Mycobacterium tuberculosis Granuloma—the Critical Battlefield in Host Immunity and Disease. Front Immunol. 2013;4: 98 10.3389/fimmu.2013.00098 - DOI - PMC - PubMed
    1. Peyron P, Vaubourgeix J, Poquet Y, Levillain F, Botanch C, Bardou F, et al. Foamy macrophages from tuberculous patients' granulomas constitute a nutrient-rich reservoir for M. tuberculosis persistence. PLoS Pathog. 2008;4: e1000204 10.1371/journal.ppat.1000204 - DOI - PMC - PubMed
    1. D'Avila H, Melo RC, Parreira GG, Werneck-Barroso E, Castro-Faria-Neto HC, Bozza PT. Mycobacterium bovis bacillus Calmette-Guerin induces TLR2-mediated formation of lipid bodies: intracellular domains for eicosanoid synthesis in vivo. J Immunol. 2006;176: 3087–97. - PubMed
    1. de Mattos KA, Sarno EN, Pessolani MC, Bozza PT. Deciphering the contribution of lipid droplets in leprosy: multifunctional organelles with roles in Mycobacterium leprae pathogenesis. Mem Inst Oswaldo Cruz. 2012;107 Suppl 1: 156–66. - PubMed

Publication types

MeSH terms

Supplementary concepts