. 2017 Jan 18;93(2):409-424.
doi: 10.1016/j.neuron.2016.11.046.

Motor Learning Requires Purkinje Cell Synaptic Potentiation through Activation of AMPA-Receptor Subunit GluA3

Affiliations

Motor Learning Requires Purkinje Cell Synaptic Potentiation through Activation of AMPA-Receptor Subunit GluA3

Nicolas Gutierrez-Castellanos et al. Neuron. .

Abstract

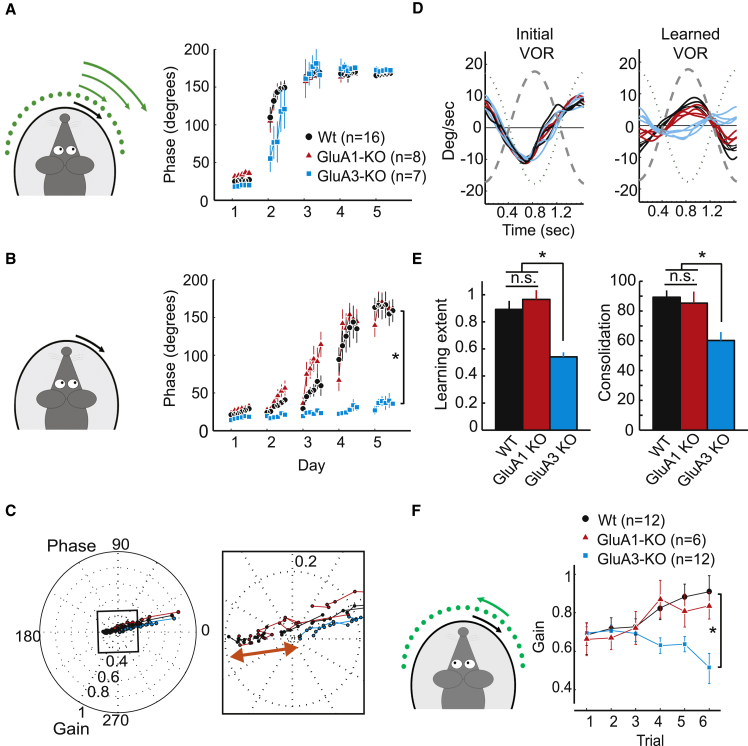
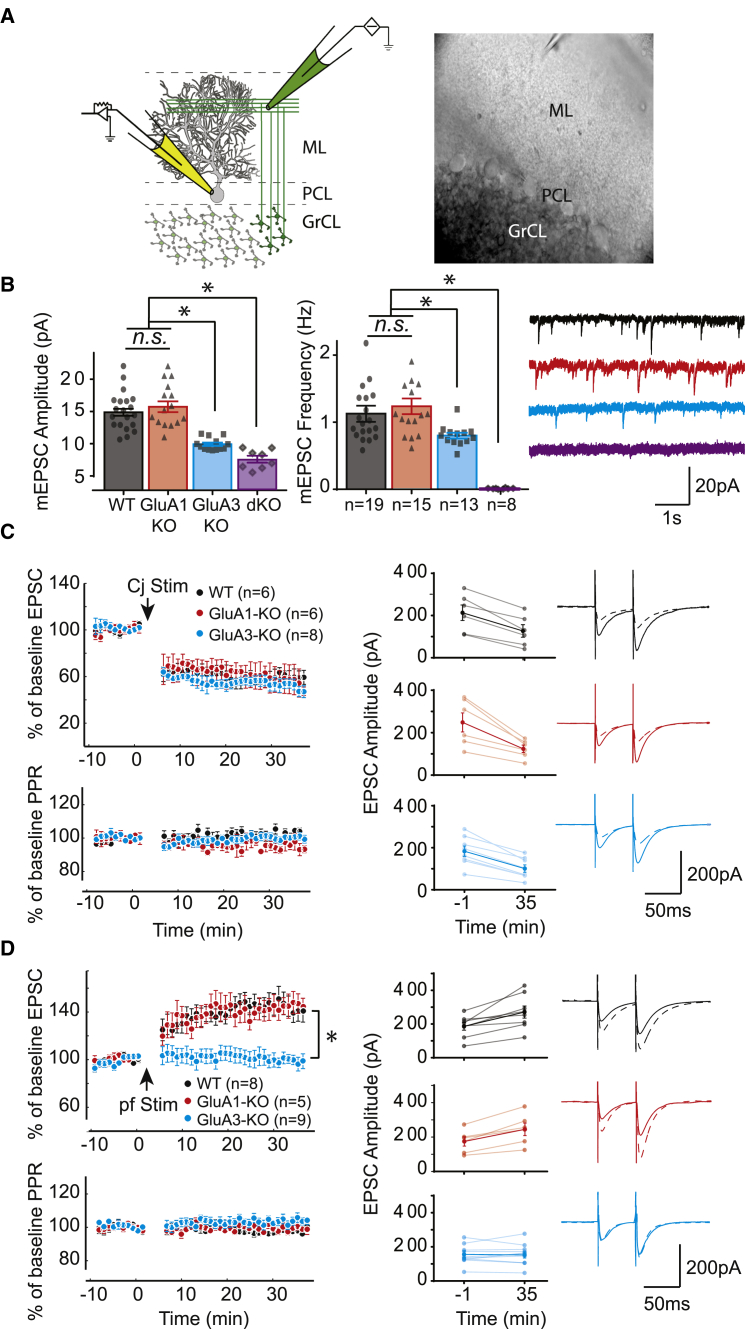
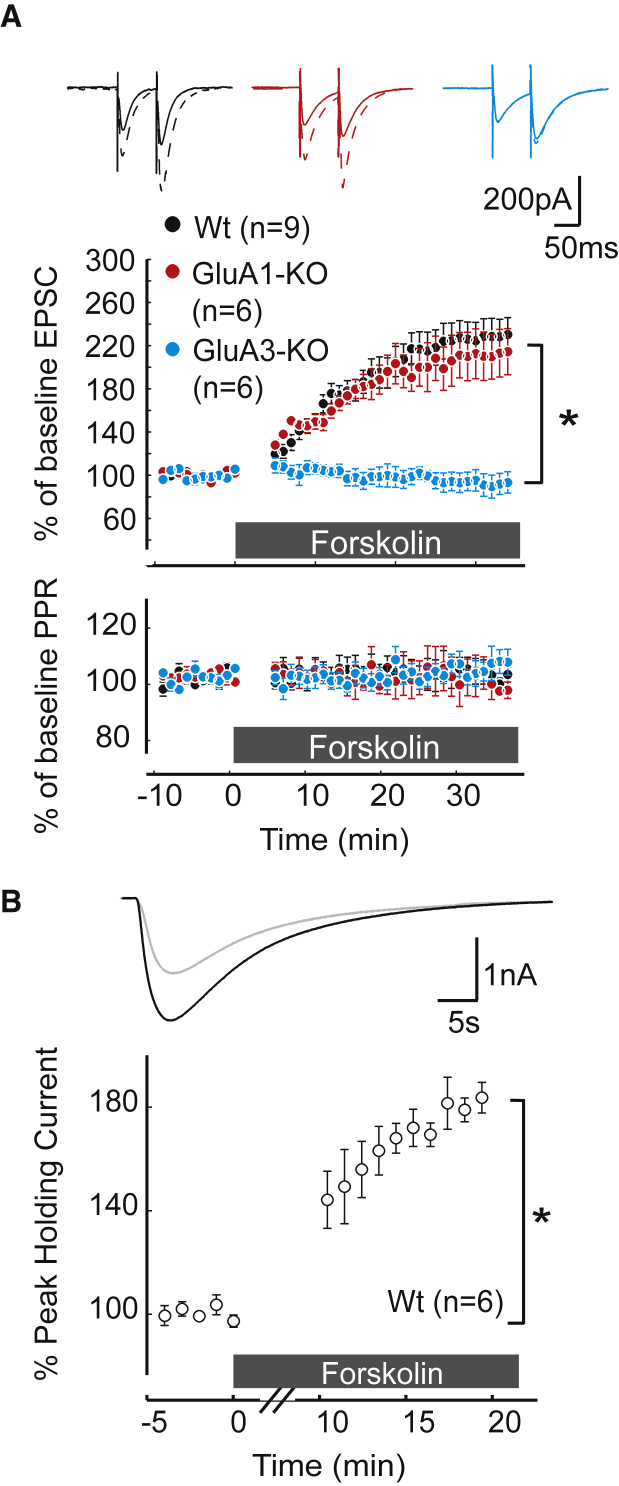
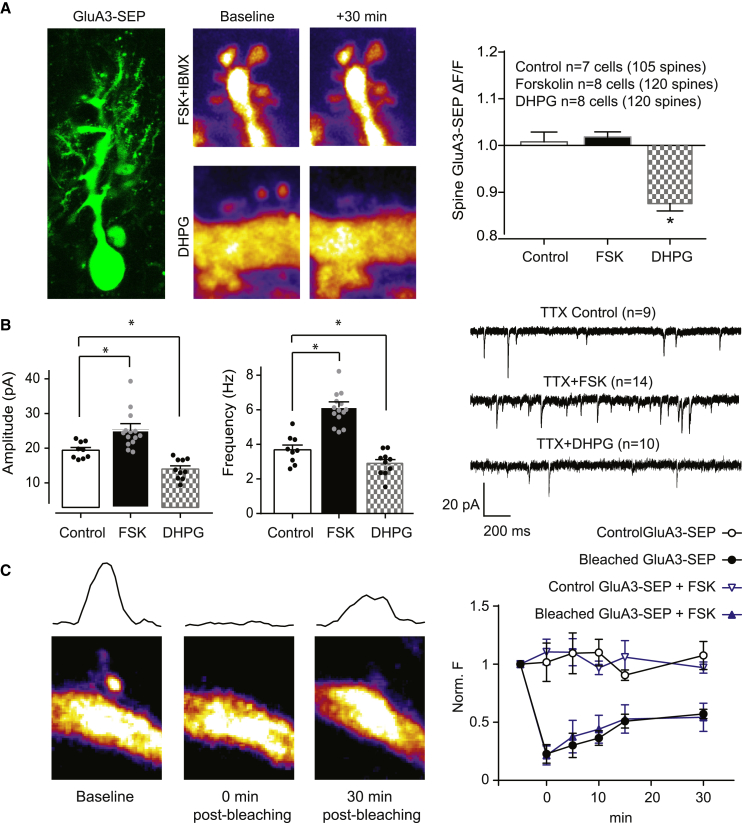
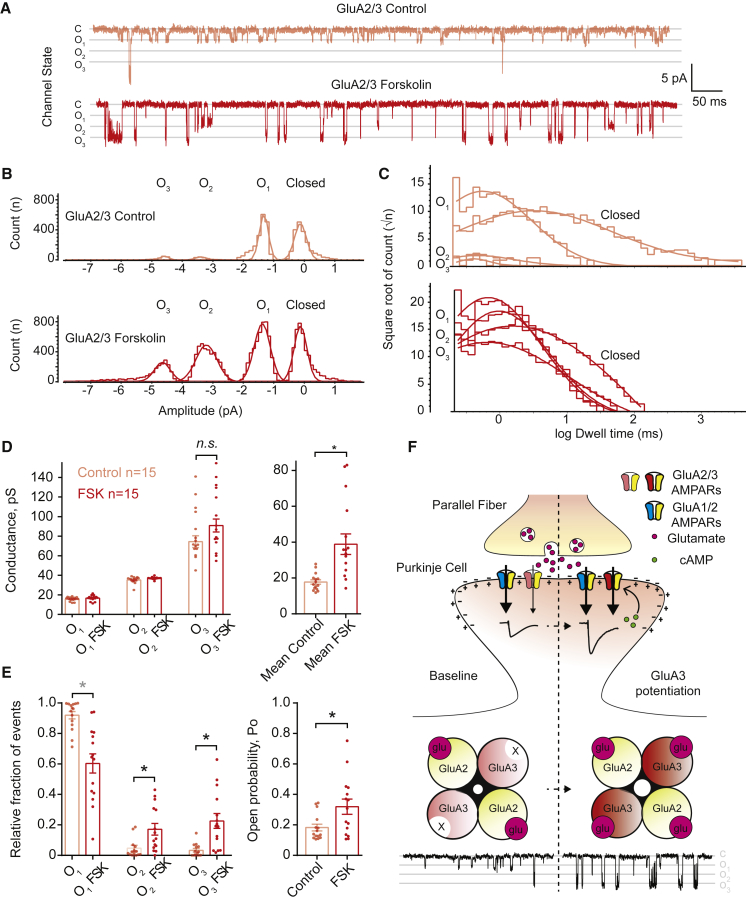
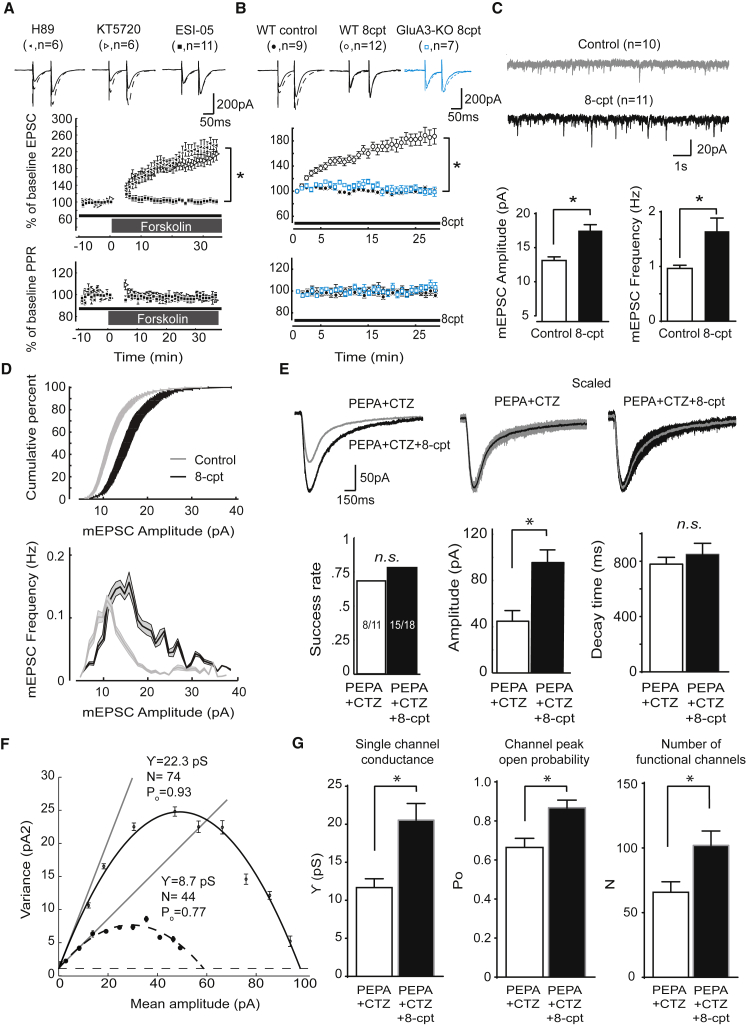
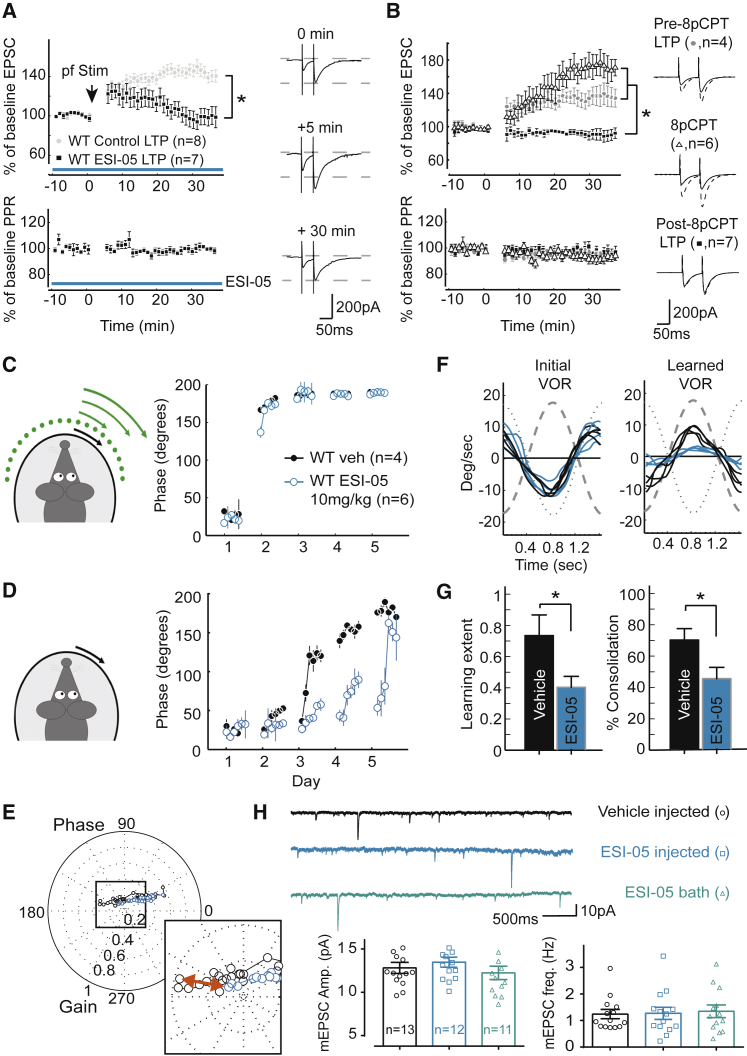
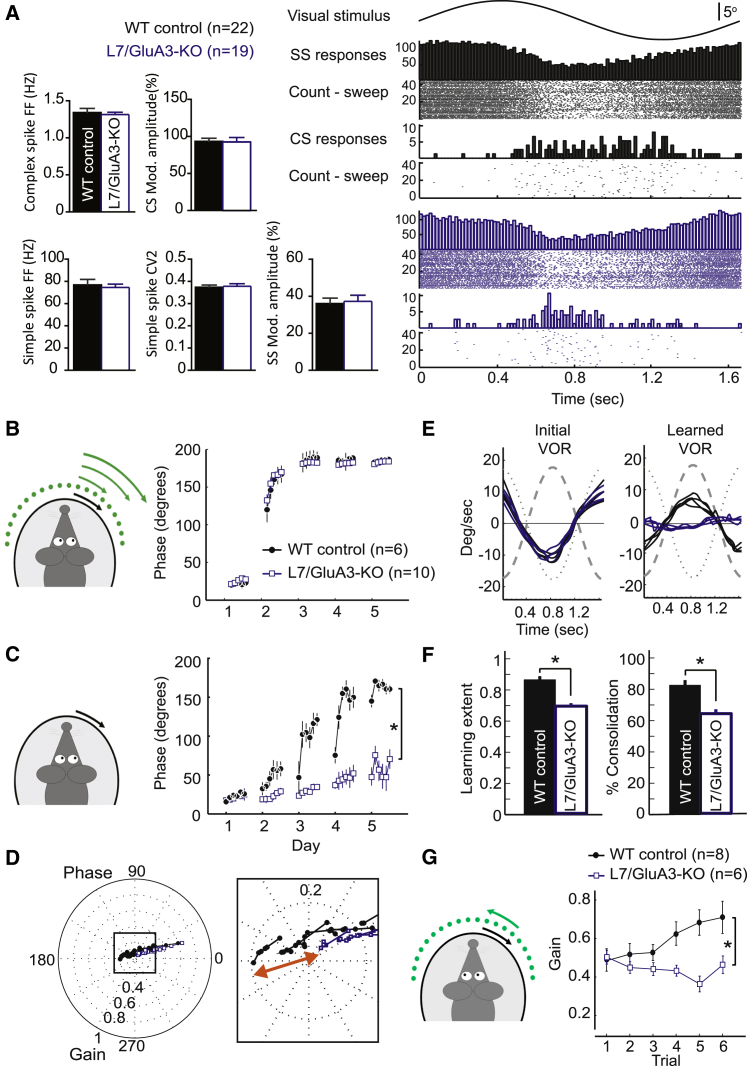
Accumulating evidence indicates that cerebellar long-term potentiation (LTP) is necessary for procedural learning. However, little is known about its underlying molecular mechanisms. Whereas AMPA receptor (AMPAR) subunit rules for synaptic plasticity have been extensively studied in relation to declarative learning, it is unclear whether these rules apply to cerebellum-dependent motor learning. Here we show that LTP at the parallel-fiber-to-Purkinje-cell synapse and adaptation of the vestibulo-ocular reflex depend not on GluA1- but on GluA3-containing AMPARs. In contrast to the classic form of LTP implicated in declarative memory formation, this form of LTP does not require GluA1-AMPAR trafficking but rather requires changes in open-channel probability of GluA3-AMPARs mediated by cAMP signaling and activation of the protein directly activated by cAMP (Epac). We conclude that vestibulo-cerebellar motor learning is the first form of memory acquisition shown to depend on GluA3-dependent synaptic potentiation by increasing single-channel conductance.

Keywords: AMPA receptor; Epac; GluA3; LTP; Purkinje cell; cerebellum; learning; synapse.


Figures

Figure 1
Figure 1
GluA3 Is Required for Oculomotor Learning (A) When adult (3–5 months of age) wild-type (WT) (black), GluA1-KO (red), and GluA3-KO (blue) mice are subjected to a visuovestibular mismatch training paradigm in which the visual screen rotates sinusoidally in the same direction as the turntable but at an increasingly greater amplitude (also referred to as a phase-reversal task), they show a similar ability to follow the training signal over time as long as the light is on. Eye movement signals are expressed as phase values (in degrees) with respect to those of the turntable, which also rotates in a sinusoidal fashion (i.e., 360° represents one sinusoidal cycle). (B) However, when the light is turned off but the turntable stimulus continues (i.e., the VOR-adaptation catch trials of the phase-reversal task), the phase values of the GluA3-KO mice show significantly impaired motor learning compared to those of GluA1-KO and WT mice. (C) Polar plot showing the trajectory of VOR gain and phase change during adaptation for WT (black line), GluA3-KO (blue), and GluA1-KO (red) mice. Gain (i.e., amplitude of the eye movement divided by that of the stimulus) is represented as distance from the center, and phase is represented as the angle relative to perfect compensation at 0°. The data reveal a common learning trajectory and comparable initial gain but a difference in learning extent between the groups. Inset shows the final VOR reached after 5 days of training, amplified to visualize the magnitude of the gain difference (red arrow) between the groups tested. (D) GluA3-KO mice (blue line) were unable to reverse their VOR phase, unlike WT (black) and GluA1-KO (red) mice. Four representative eye-velocity traces per group compare the initial VOR before (left) and after (right) the mismatch training (left). (E) Both learning extent and consolidation during the phase-reversal task are significantly smaller in GluA3-KO mice than in WT and GluA1-KO mice (T2 test p < 0.05). (F) Gain-increase learning also reveals deficits in GluA3-KO mice, but not in GluA1-KO mice, as compared to WT mice. Error bars indicate SEM; indicates p < 0.05.
Figure 2
Figure 2
GluA3 Is Required for PF-PC LTP, but Not LTD (A) Scheme of cerebellar cortical circuitry (left) and representative picture of the in vitro preparation (right) showing positions of recording electrode (yellow) at PC soma and stimulus electrode (green) at parallel fiber beam. ML, PCL, and GrCL indicate molecular layer, PC layer, and granule cell layer, respectively. (B) mEPSC amplitude (left) and frequency (middle) of both single GluA3-KO PCs (blue bar) and double GluA1/GluA3-KO PCs (purple bar) were significantly reduced compared to those in WT PCs (black bar) (for amplitude and frequency, WT versus GluA3-KO, p = 0.0003 and p = 0.023, respectively; for WT versus GluA1&3-dKO, p < 0.0001 and p < 0.0001, respectively) and single GluA1-KO PCs (red bar) (for amplitude and frequency, GluA1-KO versus GluA3-KO, p < 0.0001 and p = 0.0032, respectively). In contrast, GluA1-KO and WT PCs presented comparable basal transmission (for amplitude and frequency, WT versus GluA1-KO, p = 0.37 and p = 0.16, respectively). Right panel shows corresponding raw traces of mEPSCs. (C) Both GluA1-KO (red) and GluA3-KO (blue) mice show similar cerebellar synaptic weakening after LTD induction compared to WT littermates (black) (top left) with unchanged PPR over time (bottom left). EPSC magnitude was held in a comparable range for all cases to prevent potential bias due to differential basal synaptic strength (middle). Representative traces are of paired EPSCs before (solid lines) and after (dashed lines) LTD induction (right, matched genotype color code). Cj Stim indicates conjunctive stimulation (so as to induce LTD). (D) GluA3-KO PCs show severe deficits in PF-PC LTP compared with WT and GluA1-KO PCs with no changes in PPR or baseline EPSC magnitude. Representative traces of paired EPSCs before (solid lines) and after (dashed lines) LTP induction (same configuration as in B). pf Stim indicates parallel-fiber-only stimulation (so as to induce LTP). Error bars indicate SEM; indicates p < 0.05.
Figure 3
Figure 3
Rising cAMP Levels Produce GluA3-Dependent Postsynaptic Potentiation (A) Wash-in of 50 μM FSK causes synaptic potentiation at WT PCs (black) and GluA1-KO PCs (red), but not at GluA3-KO PCs (blue). Top, middle, and bottom show example traces, normalized EPSC amplitude, and paired pulsed ratio (PPR), respectively. (B) Enhancement of currents evoked by local puffs of 1 μM AMPA at the molecular layer following FSK application can also occur in the presence of TTX-blocking PF input. Error bars indicate SEM; indicates p < 0.05.
Figure 4
Figure 4
Rising cAMP Levels Produce GluA3-Dependent Synaptic Potentiation without AMPAR Trafficking (A) Left column is a Zmax projection of a stack of pictures showing a representative GluA3-SEP-transfected PC. In the top row, example pictures of a PC dendrite expressing GluA3-SEP before (middle) and after (right) FSK application were color-coded according to the fluorescence intensity to improve the visualization of, in this case, the absence of changes of surface GluA3-SEP over time. In the bottom row, example pictures of a PC dendrite expressing GluA3-SEP before (middle) and after (right) DHPG application reveal a significant reduction in synaptic GluA3-SEP over time. The right column shows that fluorescence intensity after FSK application, normalized by the fluorescence before application (FSK, middle bar), showed no significant increase of GuA3-SEP compared to the spines in which the drug was not applied (control, left bar). However, DHPG application significantly reduced GluA3-SEP in PC spines in accordance with the observed synaptic depression. (B) Despite the lack of a detectable increase in surface GluA3-SEP, FSK produced a significant increase in mEPSC amplitude and frequency in GluA3-SEP-transfected PCs in organotypic slices. DHPG induced a significant decrease in mEPSC amplitude and frequency in these neurons. (C) On the left is an example baseline maximum intensity projection z stack (3 μM, six optical planes) of a dendrite transfected with GluA3-SEP obtained with two-photon microscopy before, immediately after, and 30 min after photobleaching of the spine. The black traces above the pictures represent quantifications of SEP fluorescence across the spine and parallel to the dendrite. On the right is an overall quantification of spine FRAP dynamics over time for PCs transfected with GluA3-SEP, either with (n = 5) or without (n = 4) 50 μM FSK added after the moment of bleaching (0 min). SEP fluorescence intensity is normalized to baseline intensity (−5 min). No changes in SEP intensity were observed over time in spines neighboring the bleached spines.
Figure 5
Figure 5
GluA3 Plasticity Occurs through cAMP-Dependent Changes of Single-Channel Conductance and Open Probability (A) Example traces of cell-attached, single-channel recordings of GluA2/GluA3 AMPARs in PCs of GluA1-KO mice. Under basal conditions (light red), the vast majority of the openings of GluA2/GluA3 AMPARs occur at the low conductance level (O1), but in the presence of FSK, the amount of openings in the higher conductance levels (O2-3) increases (red). (B) Count-versus-amplitude histograms of the events detected in the representative recordings shown in (A) illustrate the uneven distribution of events across the different conductance levels in the absence (light red) or presence (red) of FSK. (C) The opening durations (dwell time) of the same events shown in (A) and (B) were unchanged after FSK application. However, the duration of the closed-state times was reduced, suggesting a net increase in the total number of openings produced by GluA2/GluA3 channels in the presence of FSK. (D) Overall quantification of GluA2/GluA3 single-channel recordings shows that the conductance significantly increased in the presence of FSK, yet the conductance per open state remained unchanged. (E) FSK significantly changed the distribution of GluA2/GluA3 AMPAR events, as revealed by a significant decrease of events at O1 state and a significant increase in events at O2 and O3 states. The reduction of the closed-state time shown in (C) was translated into a significant increase of the open-channel probability. (F) The classical model of GluA1-subunit-dependent LTP in pyramidal cells (see Introduction) does not prove valid at PF-PC synapses. Note that the absolute numbers of subsets of both GluA1/GluA2 and GluA2/GluA3 AMPARs are unchanged upon LTP induction, whereas the GluA2/GluA3 AMPARs are activated by cAMP signaling, enhancing their channel conductance and thereby increasing the current generated in potentiated synapses. This model describes for the first time a form of GluA3-dependent LTP. Error bars indicate SEM; indicates p < 0.05.
Figure 6
Figure 6
GluA3 Plasticity Requires cAMP-Dependent Postsynaptic Activation of Epac (A) Epac2 antagonist ESI-05 blocks FSK-driven synaptic potentiation, whereas PKA antagonists H89 and KT5720 do not. (B) Intracellular application of membrane-impermeable Epac agonist 8CPT caused significant synaptic potentiation in WT PCs (open circles) compared with GluA3-KO PCs (blue boxes) or the no-drug condition in WT PCs (closed circles). (C) Intracellular application of 8CPT caused an increase in both mEPSC amplitude (left) and frequency (right). (D) A shift toward higher mEPSC amplitudes was visualized both in the cumulative distribution and in the mEPSC frequency-versus-amplitude distribution plots, once again suggesting postsynaptic effects of EPAC activation. (E) Outside-out patches excised from PC somata recorded in the presence of AMPAR desensitization blockers (PEPA and CTZ) had a similar success rate of containing AMPA events (left), but generated significantly larger currents (middle) with similar decay time kinetics (right) when 8CPT was present in the internal solution. (F) Example parabolic distribution of the variance-versus-amplitude relationship obtained from bins of the current decay profile. Nonstationary noise analysis (NSNA) was done by fitting a parabolic equation to this distribution in order to estimate conductance, open probability, and number of active receptors. (G) NSNA performed on the PC recordings in (E) revealed significantly increased single-channel conductance (left) and peak open-channel probability upon 8CPT application (middle), which in turn led to an increased number of functional channels responding to the local AMPA application (right). Error bars indicate SEM; indicates p < 0.05.
Figure 7
Figure 7
Pharmacological Manipulation of Epac Activity Impairs LTP In Vitro and Motor Learning In Vivo without Affecting Synaptic Transmission (A) Epac antagonist ESI-05 prevents PF-PC LTP induced by tetanic PF stimuli. (B) Epac activation through incubation with 8pCPT potentiates AMPAR currents (open triangles). As a consequence, a minimal 30 min incubation with 8cCPT fully occludes LTP induction (black squares) compared with LTP induction in the absence of 8cCPT (gray circles). (C) Eye-movement phase values in WT mice that are injected with 10 mg/kg ESI-05 (open blue circles) or with vehicle only (black circles) are virtually identical during visuovestibular mismatch training when the light is on. (D) During the catch trials in the dark, the phase shift of VOR adaptation in the mice injected with 10 mg/kg ESI-05 is significantly delayed compared with the phase shift in their littermates injected with vehicle only. (E) Polar plot of the combined gain and phase data shows a common learning trajectory and comparable initial gain, yet a different final outcome, for both groups. In the inset, the final VOR reached after 5 days of training is amplified to visualize the magnitude of the gain difference (red arrow) between ESI-05-injected and vehicle-injected mice. (F) Four representative eye-velocity traces of the VOR before (left) and after (right) phase-reversal training show that, whereas both ESI-05 and vehicle-injected mice show equal baseline performance and both are able to flip the phase of the VOR, the magnitude of the VOR reached after the training is substantially different. (G) Both learning extent and consolidation during the phase-reversal task are significantly smaller in the mice injected with ESI-05 than in those injected with vehicle only (T2 test p < 0.05). (H) Impaired motor learning after ESI-05 injections does not correlate with decreased transmission at PF-PC synapses. The PC mEPSC amplitude and frequency did not change upon injection of WT mice with ESI-05 or upon incubation of WT slices with ESI-05. Error bars indicate SEM; indicates p < 0.05.
Figure 8
Figure 8
Lack of GluA3 in PCs Causes Motor Learning Deficits (A) Representative activity of vertical-axis PCs recorded in the flocculus of WT and L7/GluA3-KO mice during visual stimulation (5°, 0.6 Hz). Bar graphs show that the averages of firing frequency (FF), the coefficient of variation in adjacent intervals (CV2), the modulation amplitude of simple spikes, and the frequency and modulation amplitude of complex spikes during OKR stimulation were similar in control (n = 22) and L7/GluA3-KO mice (n = 19). The visual stimulus is shown together with histograms of simple spike and complex spike frequencies and corresponding raster plots on the right. (B) Eye-movement phase values in L7/GluA3-KO mice (open square) and WT mice (closed circle) during visuovestibular mismatch training are comparable, highlighting that the strength of the visual signals was in principle sufficient to induce learning. (C) Phase values of VOR-adaptation catch trials in L7/GluA3-KO mice show a significantly impaired shift over 5 days compared with trials in their WT littermates, illustrating that motor learning is affected despite normal visual signaling as demonstrated in (A) and (B). (D) Polar plot of the gain and phase data shows a common learning trajectory and comparable initial gain for both groups. In the inset, the final VOR reached after 5 days of training is amplified to visualize the magnitude (red arrow) of the gain difference between L7/GluA3 KO and WT mice. (E) L7/GluA3-KO mice (blue line) show equal baseline performance to WT mice (black line), but are unable to reverse the phase of their VOR. Data show four representative eye-velocity traces of the VOR before (left) and after (right) phase-reversal training. (F) Both learning extent and consolidation during the phase-reversal task are significantly smaller in L7-GluA3 KO mice than those in WT littermates (T2 test, p < 0.05). (G) Gain-increase learning reveals deficits for L7/GluA3-KO mice compared to WT mice. Error bars indicate SEM; indicates p < 0.05.

Similar articles

Cited by

References

    1. Adamczyk A., Mejias R., Takamiya K., Yocum J., Krasnova I.N., Calderon J., Cadet J.L., Huganir R.L., Pletnikov M.V., Wang T. GluA3-deficiency in mice is associated with increased social and aggressive behavior and elevated dopamine in striatum. Behav. Brain Res. 2012;229:265–272. - PMC - PubMed
    1. Andreescu C.E., Milojkovic B.A., Haasdijk E.D., Kramer P., De Jong F.H., Krust A., De Zeeuw C.I., De Jeu M.T. Estradiol improves cerebellar memory formation by activating estrogen receptor beta. J. Neurosci. 2007;27:10832–10839. - PMC - PubMed
    1. Anzai M., Kitazawa H., Nagao S. Effects of reversible pharmacological shutdown of cerebellar flocculus on the memory of long-term horizontal vestibulo-ocular reflex adaptation in monkeys. Neurosci. Res. 2010;68:191–198. - PubMed
    1. Barski J.J., Dethleffsen K., Meyer M. Cre recombinase expression in cerebellar Purkinje cells. Genesis. 2000;28:93–98. - PubMed
    1. Bats C., Farrant M., Cull-Candy S.G. A role of TARPs in the expression and plasticity of calcium-permeable AMPARs: evidence from cerebellar neurons and glia. Neuropharmacology. 2013;74:76–85. - PMC - PubMed

Substances