. 2017 Jan 24;69(3):303-321.
doi: 10.1016/j.jacc.2016.10.065.

AF Ablation Guided by Spatiotemporal Electrogram Dispersion Without Pulmonary Vein Isolation: A Wholly Patient-Tailored Approach

Affiliations

AF Ablation Guided by Spatiotemporal Electrogram Dispersion Without Pulmonary Vein Isolation: A Wholly Patient-Tailored Approach

Julien Seitz et al. J Am Coll Cardiol. .

Abstract

Background: The use of intracardiac electrograms to guide atrial fibrillation (AF) ablation has yielded conflicting results.

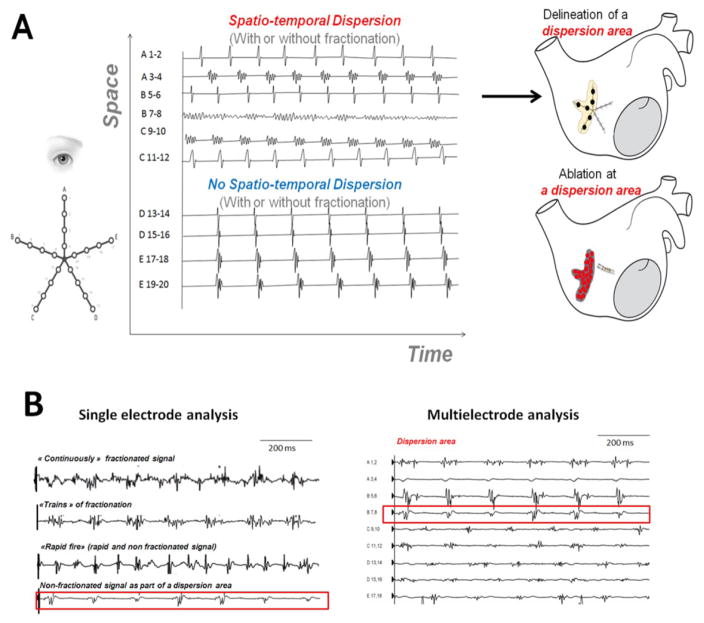
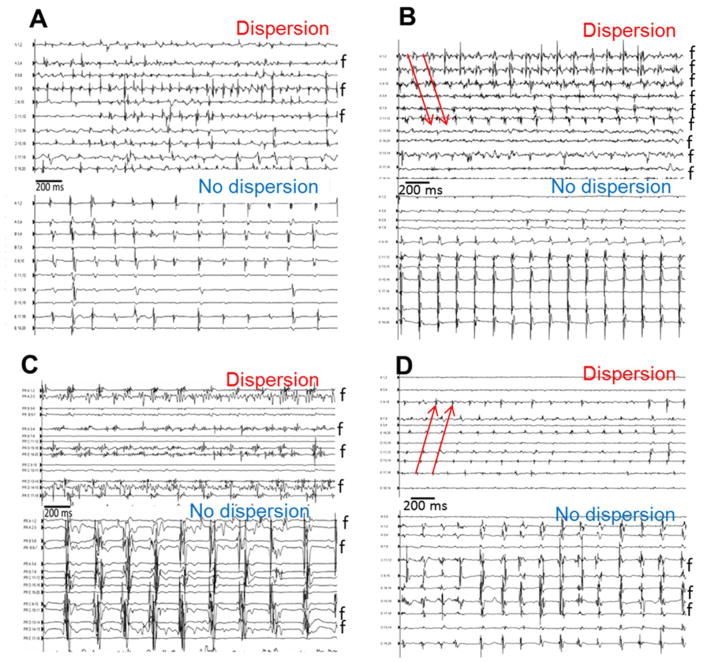
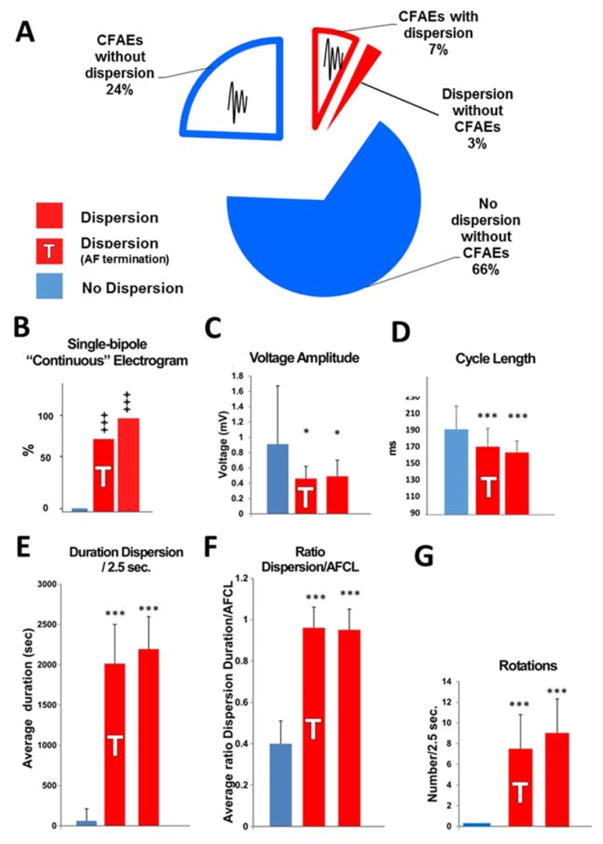
Objectives: The authors evaluated the usefulness of spatiotemporal dispersion, a visually recognizable electric footprint of AF drivers, for the ablation of all forms of AF.

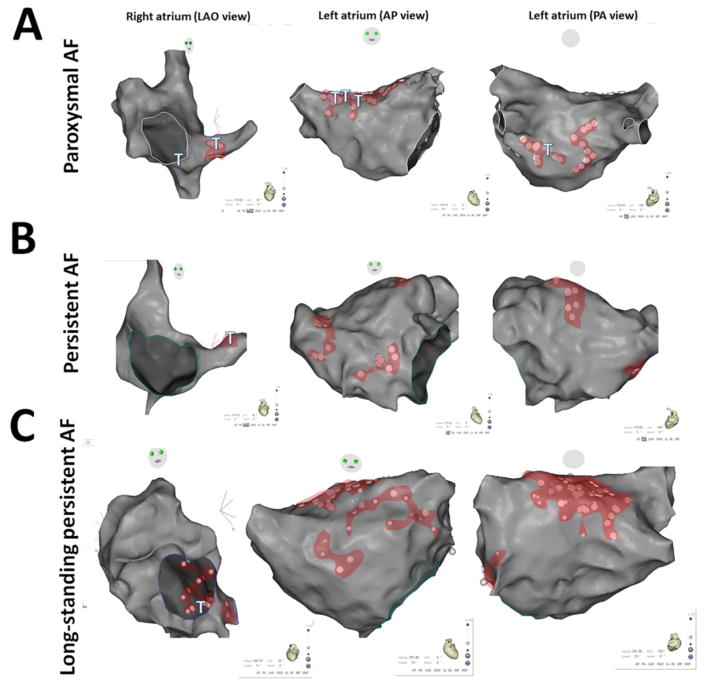
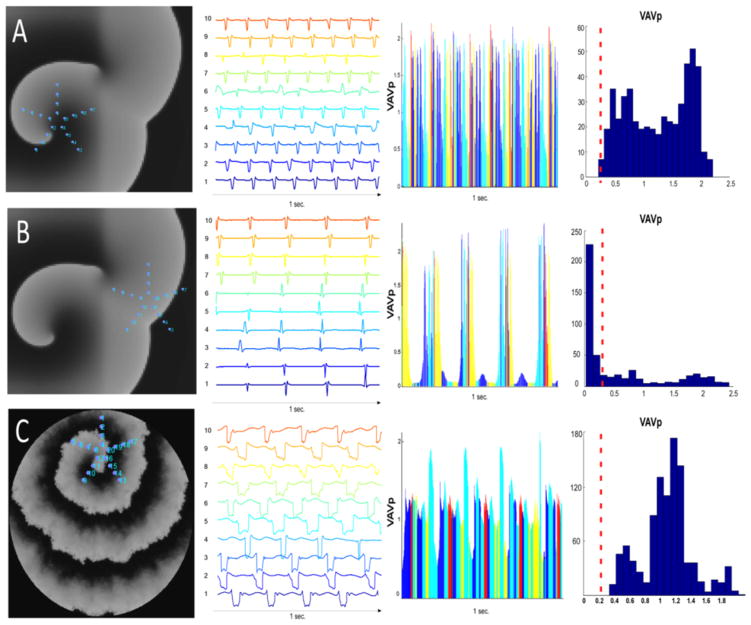
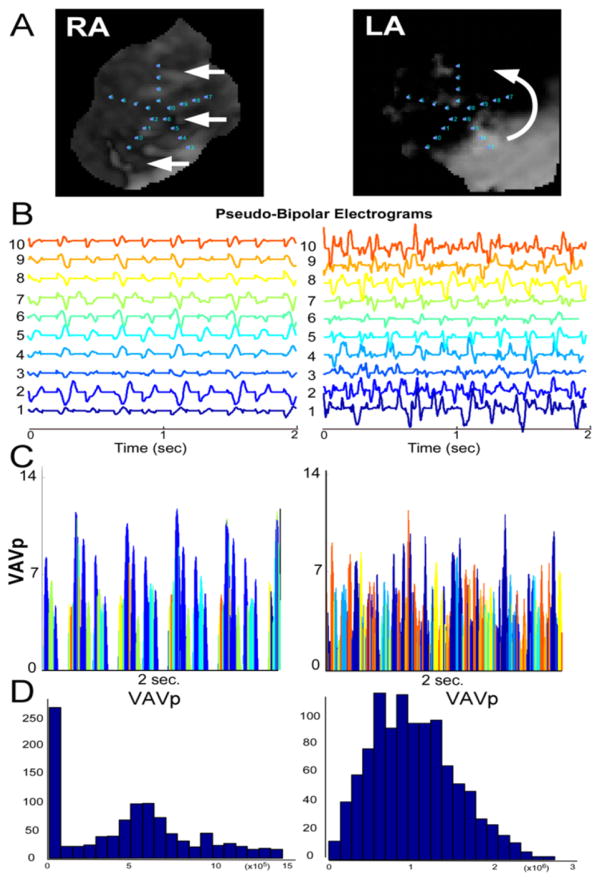
Methods: The authors prospectively enrolled 105 patients admitted for AF ablation. AF was sequentially mapped in both atria with a 20-pole PentaRay catheter. The authors tagged and ablated only regions displaying electrogram dispersion during AF. Results were compared to a validation set in which a conventional ablation approach was used (pulmonary vein isolation/stepwise approach). To establish the mechanism underlying spatiotemporal dispersion of AF electrograms, the authors conducted realistic numerical simulations of AF drivers in a 2-dimensional model and optical mapping of ovine atrial scar-related AF.

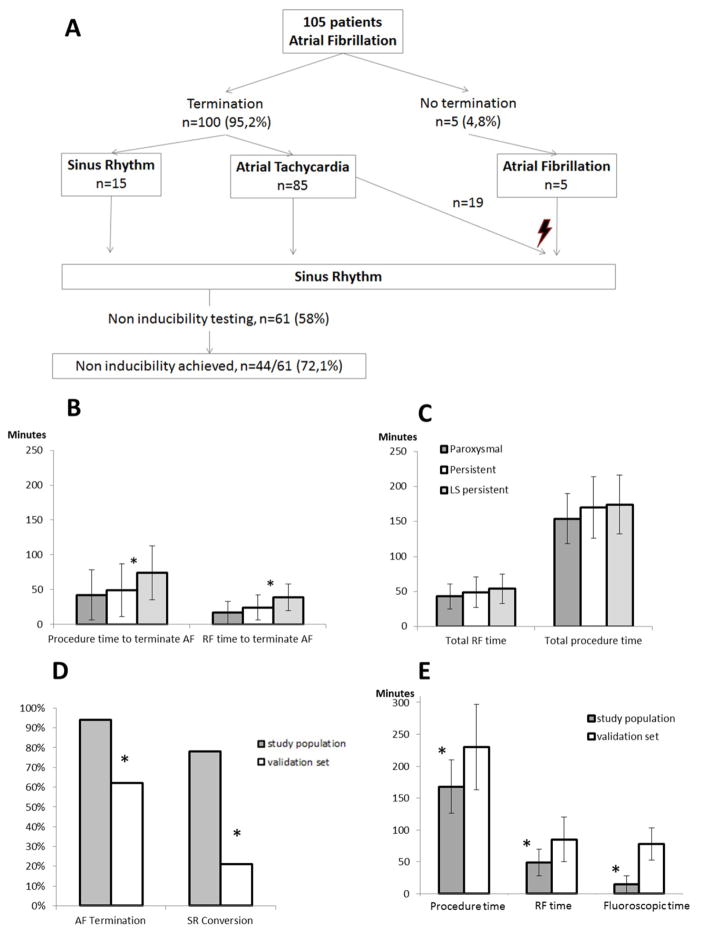
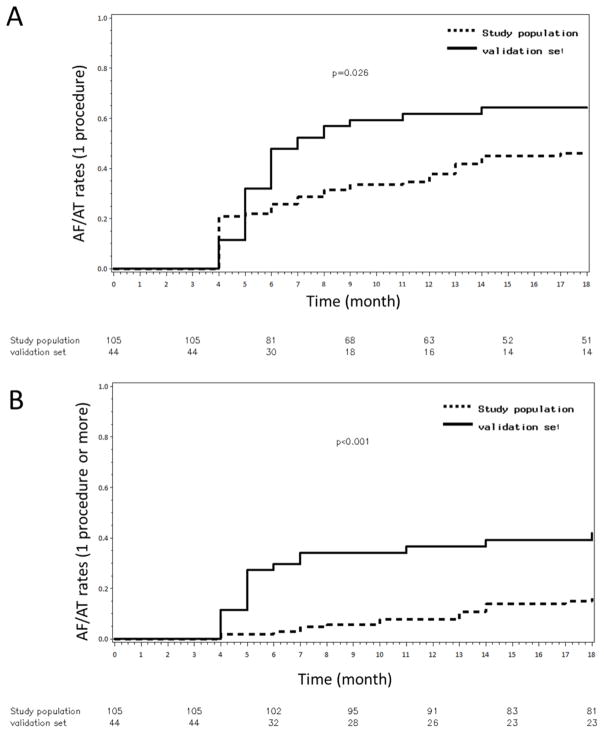
Results: Ablation at dispersion areas terminated AF in 95% of the 105 patients. After ablation of 17 ± 10% of the left atrial surface and 18 months of follow-up, the atrial arrhythmia recurrence rate was 15% after 1.4 ± 0.5 procedures per patient versus 41% in the validation set after 1.5 ± 0.5 procedures per patient (arrhythmia free-survival: 85% vs. 59%; log-rank p < 0.001). Compared with the validation set, radiofrequency times (49 ± 21 min vs. 85 ± 34.5 min; p = 0.001) and procedure times (168 ± 42 min vs. 230 ± 67 min; p < 0.0001) were shorter. In simulations and optical mapping experiments, virtual PentaRay recordings demonstrated that electrogram dispersion is mostly recorded in the vicinity of a driver.

Conclusions: The clustering of intracardiac electrograms exhibiting spatiotemporal dispersion is indicative of AF drivers. Their ablation allows for a nonextensive and patient-tailored approach to AF ablation. (Substrate Ablation Guided by High Density Mapping in Atrial Fibrillation [SUBSTRATE HD]; NCT02093949).

Keywords: cycle length; dispersion driver; fractionated; mapping; sinus rhythm.


Figures

Figure 1
Figure 1. Spatio-temporal Dispersion of Multipolar Electrograms
Panel A: Dispersion areas: definition, mapping approach and delineation. Panel B, Left: Examples of single-bipole signals from dispersion regions. Upper: Continuously fractionated and low-voltage signals. Upper Middle: “Trains of Fractionation” are periodic fractionated electrograms. Lower Middle: “Rapid Fires” are short-cycle-length non-fractionated electrograms. Lower: Non-fractionated (>120 ms) electrograms may be one or several of the electrograms within a dispersion region (Panel B, right). Collectively, the bipolar electrograms span most of the AFCL recorded in the region.
Figure 2
Figure 2. Examples of Spatio-temporal Dispersion
panels A–D: Representative examples of the multipolar electrograms (clusters of electrograms) recorded in dispersion and in non-dispersion regions in four patients. Fractionated electrograms are marked by an “f”. In the dispersion regions, it was common to find bipoles exhibiting continuously fractionated signal as shown in panels B and C. Red arrows show the sequential activation of consecutive bipoles of multielectrode catheter spanning 100% of the AF cycle length.
Figure 3
Figure 3. Examples of Dispersion Maps
Panels A, B, C: Dispersion regions delineated by clusters of electrograms (white dots): localization and extent. CARTO renderings of dispersion regions in representative patients with paroxysmal (panel A), persistent (panel B) and long-standing persistent (panel C) AF. Left: left anterior oblique (LAO) view; middle: antero-posterior (AP) view; right: postero-anterior (PA,) view. Dispersion regions are shaded in red. Sites at which point ablation led to AF termination are depicted with a T. (AP): antero-posterior (LAO): left anterior oblique (PA): postero-anterior
Figure 4
Figure 4. Procedural Outcomes
Panel A: Flow-chart depicting the per-procedural outcome. Panel B: Procedure (left) and radiofrequency (right, RF) time to terminate AF. *: p<0.01. Panel C: Procedure (left) and radiofrequency (right, RF) time. P>0.05 between all AF types. Panel D: AF termination and sinus rhythm (SR) conversion by ablation in the study population compared to the validation set (left, persistent and long-standing persistent lumped together). *: p<0.01. Panel E: Procedure, radiofrequency (RF) and fluoroscopic times in the study in the study population compared to the validation set. *: p<0.01. (RF): radiofrequency
Figure 5
Figure 5. Eighteen-month Outcome
Panels A–B: Kaplan-Meier curves illustrating AF/AT recurrence rates after a single procedure (A) and after multiple procedures (B) in the study population and the validation set.
Figure 6
Figure 6. Signal Analysis
Panel A: Pie chart of the surface area of fractionated electrograms tagged with the CARTO algorithm (auto-CFAEs) in dispersion (red) and non-dispersion (blue) regions. CFAEs: complex fractionated atrial electrograms. Panels B–G: Off-line analysis of electrograms from dispersion areas and from non-dispersed regions; comparison between dispersion areas (red), dispersion areas at which AF terminated (red, shaded T) and non-dispersed regions (blue). Panel E: Cycle length. Panel F: Voltage amplitude Panel G: Rotations. Panel H: Presence of continuous CFAEs. Panel I: Duration spatio-temporal dispersion/2.5 sec. Panel J: Ratio spatio-temporal dispersion/AFCL. Mean + SE; *: p<0.05; ***: P<0.01; +++ p: <0.05 (Kruskal-Wallis), n = 20 patients; n = 68 and n = 35 dispersion areas and non-dispersed regions, respectively.
Figure 7
Figure 7. Numerical Simulations
Panel A: Human atrial model, homogeneous substrate: the virtual PentaRay is positioned at the center of the driver. The aspect of the pseudo-multipolar electrograms is one of spatio-temporal dispersion, reminiscent of patients’ dispersion areas. Panel B: Human atrial model, homogeneous substrate: The virtual PentaRay is positioned at the periphery of the driver in a region activated at a slow frequency of excitation. Panel C: Interstitial fibrosis condition (myocyte-myofibroblast ratio: 0.5). The pseudo-multipolar electrograms exhibit a large spatio-temporal dispersion. See also supplemental movies 1 and 2. The VAVmax amongst the 10 pseudo-bipoles of the virtual Pentarray was collected at each time point to form a new time-series VAVp. Histograms of the distribution of VAVp values are presented in bins of 0.1 mV. Low VaVp values are underrepresented in the driver regions while they are predominant in bystander regions (red dashed line).
Figure 8
Figure 8. Optical Mapping
Pseudo-multipolar single-pixel time series obtained from an optical mapping experiment in a left--atrial-scar heart. In the RA, planar-like waves yield little tempo-spatial dispersion (RA, left panels). In regards of a LA driver (right panels), however, aspects reminiscent of patients’ spatio-temporal dispersion are seen (see also supplemental movie 2). Panel A: Optical movie snapshots during AF. Panel B: Pseudo-bipolar electrograms. Panel C: VAVp time series. Panel D: Histograms of the distribution of VAVp values. VAVp: see legend of Figure 7. Low VaVp values are underrepresented in the driver region (LA) while they are predominant in the RA bystander region.

Comment in

References

    1. Verma A, Jiang C, Betts TR, et al. Approaches to catheter ablation for persistent atrial fibrillation. N Engl J Med. 2015;372:1812–1822. - PubMed
    1. Wong KCK, Paisey JR, Sopher M, et al. No Benefit OF Complex Fractionated Atrial Electrogram (CFAE) Ablation in Addition to Circumferential Pulmonary Vein Ablation and Linear Ablation: BOCA Study. Circ Arrhythm Electrophysiol. 2015 CIRCEP.114.002504. - PubMed
    1. Oral H, Chugh A, Good E, et al. Radiofrequency catheter ablation of chronic atrial fibrillation guided by complex electrograms. Circulation. 2007;115:2606–2612. - PubMed
    1. Providência R, Lambiase PD, Srinivasan N, et al. Is There Still a Role for Complex Fractionated Atrial Electrogram Ablation in Addition to Pulmonary Vein Isolation in Patients With Paroxysmal and Persistent Atrial Fibrillation?: Meta-Analysis of 1415 Patients. Circ Arrhythm Electrophysiol. 2015;8:1017–1029. - PubMed
    1. Vogler J, Willems S, Sultan A, et al. Pulmonary Vein Isolation Versus Defragmentation: The CHASE-AF Clinical Trial. J Am Coll Cardiol. 2015;66:2743–2752. - PubMed

Associated data