. 2017 Apr;102(4):755-764.
doi: 10.3324/haematol.2016.159160. Epub 2017 Jan 19.

Inhibition of 4EBP phosphorylation mediates the cytotoxic effect of mechanistic target of rapamycin kinase inhibitors in aggressive B-cell lymphomas

Affiliations

Inhibition of 4EBP phosphorylation mediates the cytotoxic effect of mechanistic target of rapamycin kinase inhibitors in aggressive B-cell lymphomas

Chengfeng Bi et al. Haematologica. 2017 Apr.

Abstract

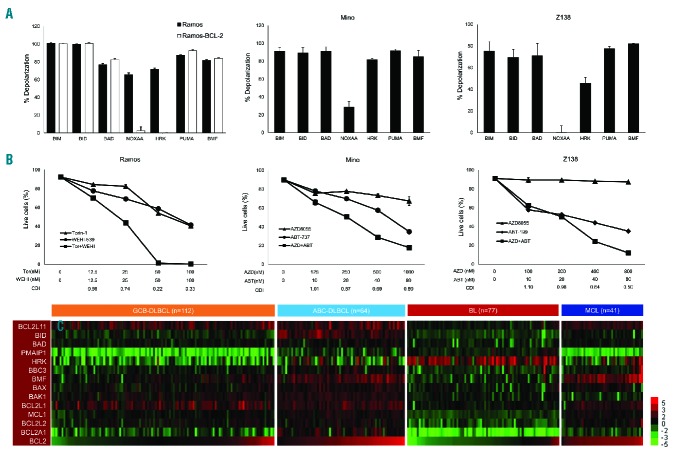
Mechanistic target of rapamycin (mTOR) complex 1 is a central integrator of nutrient and growth factor inputs that controls cell growth in eukaryotes. The second generation of mTOR kinase inhibitors (TORKi), directly targeting the mTOR catalytic site, are more effective than rapamycin and its analogs in cancer treatment, particularly in inducing apoptosis. However, the mechanism underlying the cytotoxic effect of TORKi remains elusive. Herein, we demonstrate that TORKi-induced apoptosis is predominantly dependent on the loss of mTOR complex 1-mediated 4EBP activation. Knocking out RICTOR, a key component of mTOR complex 2, or inhibiting p70S6K has little effect on TORKi-induced apoptosis. Conversely, increasing the eIF4E:4EBP ratio by either overexpressing eIF4E or knocking out 4EBP1/2 protects lymphoma cells from TORKi-induced cytotoxicity. Furthermore, downregulation of MCL1 expression plays an important role in TORKi-induced apoptosis, whereas BCL-2 overexpression confers resistance to TORKi treatment. We further show that the therapeutic effect of TORKi in aggressive B-cell lymphomas can be predicted by BH3 profiling, and improved by combining it with pro-apoptotic drugs, especially BCL-2 inhibitors, both in vitro and in vivo Taken together, the study herein provides mechanistic insight into TORKi cytotoxicity and identified a potential way to optimize its efficacy in the clinical treatment of aggressive B-cell lymphoma.


Figures

Figure 1.
Figure 1.
TORKi inhibits cell proliferation and, to a varying extent, induces apoptosis in aggressive B-lymphoma cells. (A) Aggressive B-lymphoma cell lines were treated with TORKi Torin1 (upper panel) and AZD8055 (lower panel) at different doses. Viable cells were determined by MTS assay after 72 h of treatment with each drug. Data shown are the average of three experiments and are presented as mean ± SEM. (B) Apoptosis was quantified by flow cytometry with Annexin V and PI double staining after 48 h of treatment with 250 nM of Torin1 or 5 μM of AZD8055. Relative apoptosis was measured by calculating the fold change to apoptotic fractions of control cells. Data shown are the average of three experiments and are presented as mean ± SEM. MCL: mantle cell lymphoma; DLBCL: diffuse large B-cell lymphoma; DHL: double hit lymphoma; BL: burkitt lymphoma; GCB: germinal center B cell; ABC: activated B cell; Ctr: control.
Figure 2.
Figure 2.
Knocking out Rictor has little effect on TORKi-induced apoptosis in aggressive B-lymphoma cells. (A) Mino cells were transduced with retroviral vectors expressing GFP and AKT. After puromycin selection, cells were treated with AZD8055 for 24 h. AKT and mTORC1 signaling were evaluated. (B) Ramos and Mino cells were transduced with a CRISPR-CAS9 vector that expresses a sgRNA targeting Rictor. After selection for 3 weeks, Rictor protein levels were examined by immunoblotting. (C and D) Cells transduced with Rictor-sgRNA1 were treated with AZD8055 (AZD) or Torin1 (Tor) for 48h. Apoptosis was quantified by flow cytometry with Annexin V and PI double staining. Shown is an average (± SEM) of two independent experiments. Ctr: control.
Figure 3.
Figure 3.
Knocking out of 4EBPs induces resistance to TORKi treatment. (A) Ramos and Mino cells were transduced with CRISPR-CAS9 vectors targeting 4EBP1 and immunoblotted with the indicated antibodies. (B and C) Ramos and Mino cells transduced with 4EBP1-sgRNA1 were treated with AZD8055 (AZD) or Torin1 (Tor) for 48 h, and apoptosis was evaluated using flow cytometry with Annexin V and PI double staining. (D) Cells were transduced with CRISPR-CAS9 vectors targeting 4EBP2 and immunoblotted with the indicated antibodies. (E and F) Ramos and Mino cells transduced with 4EBP2-sgRNA2 were treated with AZD or Tor for 48 h, and apoptosis was evaluated using flow cytometry with Annexin V and PI double staining. (G) Ramos was transduced with CRISPR-CAS9 vectors targeting both 4EPB1 and 4EBP2 and immunoblotted with the indicated antibodies. 48 h after treatment with AZD or Tor, 4EBP1/2 double knockout (Ramos-DKO) and control (Ramos-C) Ramos cells were (H) immunoblotted with antibodies against MCL1 and BCL-XL, and (I) analyzed by flow cytometry with Annexin V and PI double staining to evaluate apoptosis. All data (mean ± SEM) shown are the average of two experiments. *P<0.05; **P<0.01; ***P≤0.001; ****P<0.0001. Ctr: control.
Figure 4.
Figure 4.
Overexpression of eIF4E rescues lymphoma cells, at least partially, from TORKi-induced apoptosis. (A) Ramos, Mino and Dohh2 cells were transduced with a retroviral vector expressing eIF4E or GFP and immunoblotted by the indicated antibodies. Relative MCL1 expressions were calculated by normalizing individual levels with that of control cells (vector only). (B) Transduced cells were treated with various doses of AZD8055 (AZD) or Torin1 (Tor), and apoptosis was evaluated by Annexin V and PI double staining 48 h after the treatment. Data shown are the average of two experiments and are presented as mean ± SEM. **P≤0.01; ***P<0.001. Ctr: control.
Figure 5.
Figure 5.
Overexpression of MCL1 and BCL-XL protects lymphoma cells from TORKi-induced apoptosis. (A–D) Exogenous GFP, BCL-2, MCL1 or BCL-XL was overexpressed in lymphoma cells by retrovirus transduction, and the cells were then treated with various doses of AZD8055 for 24 hr. Corresponding protein levels as well as Caspase-3 and PARP were evaluated by immunoblotting. (E–G) Transduced cells were treated with various doses of AZD8055 for 48 h, and apoptosis was evaluated using flow cytometry with Annexin V and PI double staining. Data shown are the average of two experiments and are presented as mean ± SEM. *P<0.05; **P<0.01; ***P<0.001. AZD: AZD8055; Tor: Torin1; Ctr: control.
Figure 6.
Figure 6.
BH3 profiling predicts sensitivity to TORKi treatment. (A) Lymphoma cells were treated with various peptides as indicated in Ramos, Ramos with BCL-2 overexpression, Mino and Z138. Mitochondrial depolarization was determined by JC-1 staining. Results are shown as mean (n =3), compared to solvent control DMSO values; error bar represents standard deviation. (B) Cells were treated with the combination of TORKi with BCL-XL selective inhibitor WEHI-539 or BCL-2/BCL-XL inhibitor ABT-737 or BCL-2 inhibitor ABT-199 for 48 h, and then apoptosis was quantified by flow cytometry. Coefficients of drug interaction (CDI) were calculated based on the inhibitory effect of the individual drugs and combined treatment. Data shown are the average of two experiments and are presented as mean ± SEM. (C) The heatmap illustrates the relative mRNA level (log2 fold change) of BCL-2 family genes with DLBCL and BL compared to that of normal centrocytes and MCL compared to that of normal naïve B cells. GCB-DLBCL: diffuse large B-cell lymphoma germinal center B-cell subtype; ABC DLBCL: diffuse large B-cell lymphoma activated B-cell subtype: BL: burkitt lymphoma; MCL: mantle cell lymphoma; AZD: AZD8055; Tor: Torin1.
Figure 7.
Figure 7.
Animals with xenograft lymphomas were treated with Torin1 and/or BCL-2 inhibitor, ABT-199. Ramos and Mino xenografts were established in NOD/SCID mice, and the mice were treated with the indicated drugs. (A and E) Tumor growth was evaluated by the ratio of tumor volume at the indicated time to that at the initiation of drug treatment, results are shown as mean ± SEM (n =6 in each group). (B and F) Tumor weights were obtained at autopsy and compared across different groups of treatment at 11 and 14 days after the initiation of treatment for Ramos and Mino models, respectively. (C and D) H&E staining of the Ramos xenograft tumors. Markedly increased apoptosis was observed in mice treated with Torin1. (G–J) Immunohistochemical staining using antibody against cleaved caspase-3 in Mino xenograft tumors treated with Torin1 (Tor) and ABT-199 (ABT), individually or in combination. ****P<0.0001. Ctr: control.

References

    1. Tarella C, Passera R, Magni M, et al. Risk factors for the development of secondary malignancy after high-dose chemotherapy and autograft, with or without rituximab: a 20-year retrospective follow-up study in patients with lymphoma. J Clin Oncol. 2011;29(7):814–824. - PubMed
    1. Ng AK, LaCasce A, Travis LB. Long-term complications of lymphoma and its treatment. J Clin Oncol. 2011;29(14):1885–1892. - PubMed
    1. Laplante M, Sabatini DM. mTOR signaling in growth control and disease. Cell. 2012; 149(2):274–293. - PMC - PubMed
    1. Hay N, Sonenberg N. Upstream and down stream of mTOR. Genes Dev. 2004;18(16): 1926–1945. - PubMed
    1. Larsson O, Morita M, Topisirovic I, et al. Distinct perturbation of the translatome by the antidiabetic drug metformin. Proc Natl Acad Sci USA. 2012;109(23):8977–8982. - PMC - PubMed

MeSH terms

Substances