. 2017 Jan 20;355(6322):eaaf8399.
doi: 10.1126/science.aaf8399.

Tumor aneuploidy correlates with markers of immune evasion and with reduced response to immunotherapy

Affiliations

Tumor aneuploidy correlates with markers of immune evasion and with reduced response to immunotherapy

Teresa Davoli et al. Science. .

Abstract

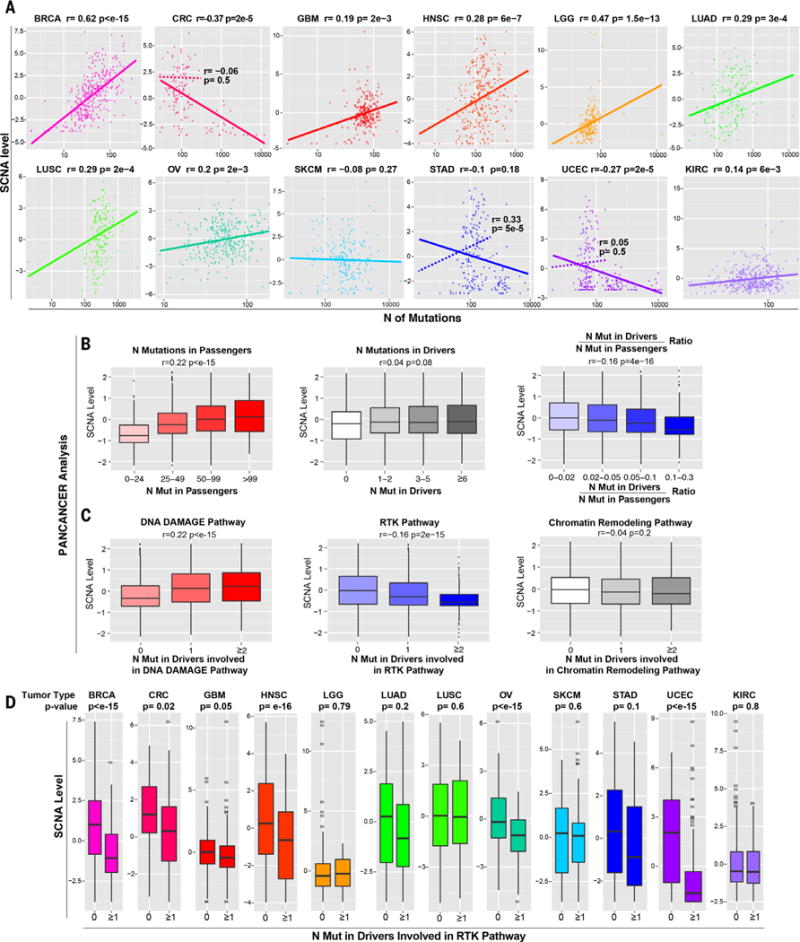
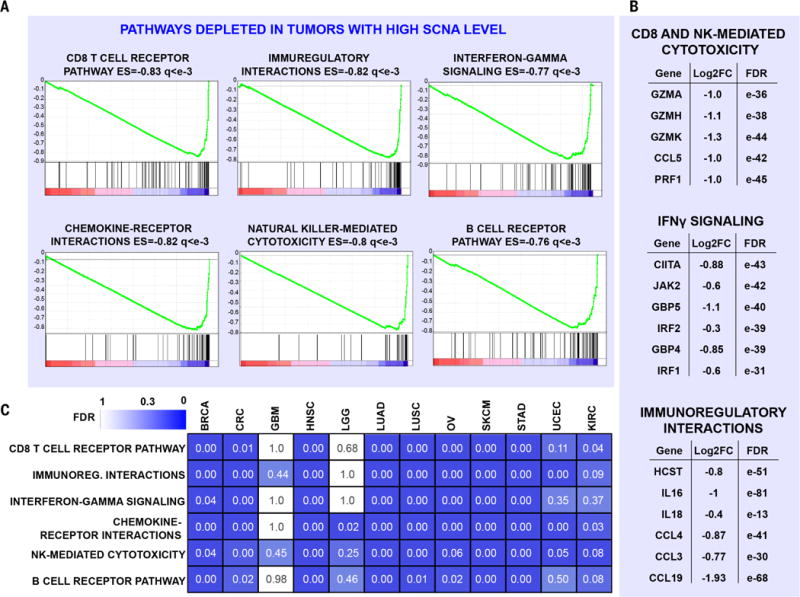
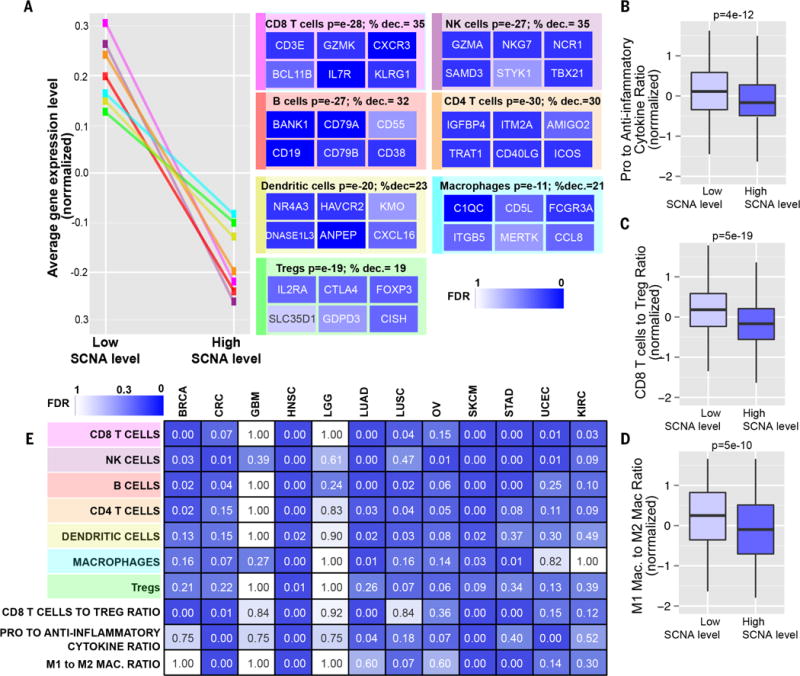
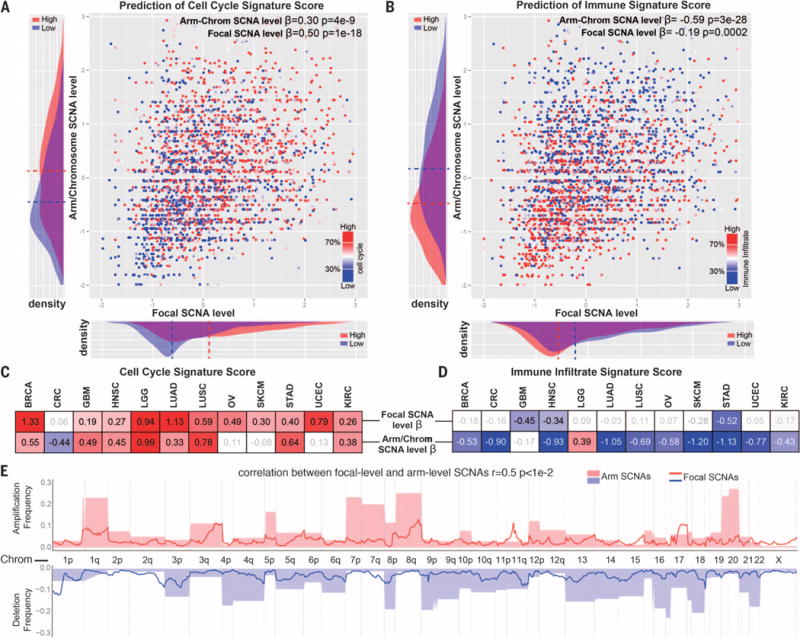
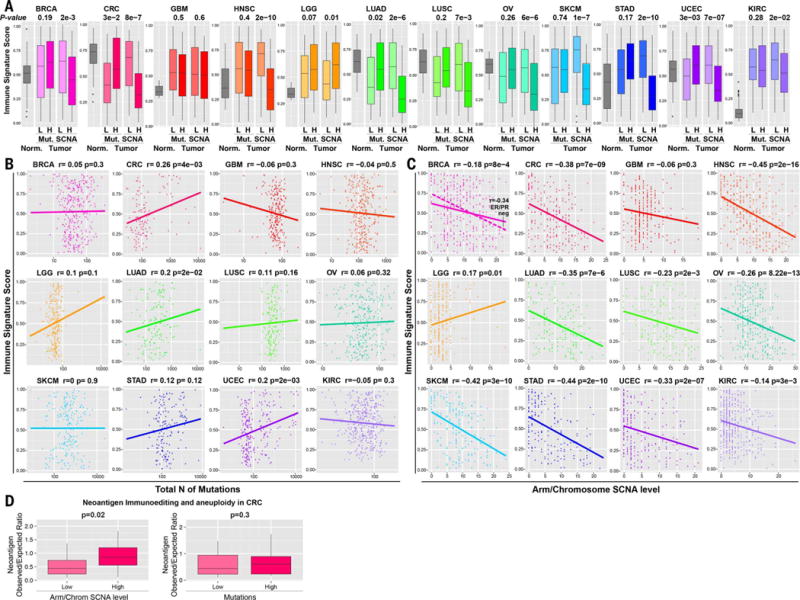
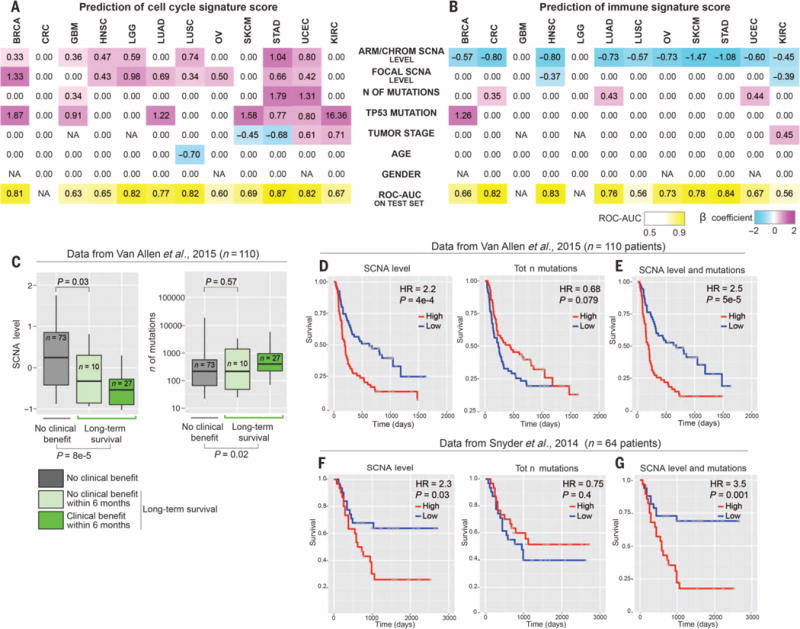
Immunotherapies based on immune checkpoint blockade are highly effective in a subset of patients. An ongoing challenge is the identification of biomarkers that predict which patients will benefit from these therapies. Aneuploidy, also known as somatic copy number alterations (SCNAs), is widespread in cancer and is posited to drive tumorigenesis. Analyzing 12 human cancer types, we find that, for most, highly aneuploid tumors show reduced expression of markers of cytotoxic infiltrating immune cells, especially CD8+ T cells, and increased expression of cell proliferation markers. Different types of SCNAs predict the proliferation and immune signatures, implying distinct underlying mechanisms. Using published data from two clinical trials of immune checkpoint blockade therapy for metastatic melanoma, we found that tumor aneuploidy inversely correlates with patient survival. Together with other tumor characteristics such as tumor mutational load, aneuploidy may thus help identify patients most likely to respond to immunotherapy.


Figures

Fig. 1
Fig. 1. Relationship between SCNA level and point mutations
(A) For each tumor type, a plot is shown containing the calculated SCNA level (see Materials and methods) versus the total number of mutations in exons. The Spearman correlation coefficient and P value are shown. For CRC, STAD, and UCEC, two plots are shown, based either on all tumors (solid line) or after excluding hypermutated samples (dashed line; see also fig. S1A, table S1, and Materials and methods). (B and C) Pan-cancer analysis showing the relationship between the SCNA level and the number of mutations in passenger genes, functionally relevant mutations in OG and TSG drivers predicted by TUSON (11) or the ratio between the number of mutations in these drivers and passengers (B), and the number of drivers involved in the indicated pathways (C) (table S2B). Only tumor samples with a total number of exonic mutations lower than 400 were considered to exclude hypermutated samples. The Spearman correlation coefficient and P value are shown (see table S2 for the same analysis including hypermutated samples). (D) The relationship between the SCNA level and the presence of at least one functionally relevant mutation in TSGs or OGs involved in the RTK pathway [as in (C); see table S2, B and D] is shown as a box plot (P values refer to Wilcoxon test). The hypermutated samples were excluded (see Materials and methods).
Fig. 2
Fig. 2. Depletion of cytotoxic immune infiltrates in high versus low SCNA level tumors
(A and B) RNA sequencing (RNA-seq) analysis was performed comparing high (higher than 70th percentile) versus low (lower than 30th percentile) SCNA level tumors (pan-cancer analysis), considering tumor type as a covariate. GSEA plots, ES, and FDR (q) are shown for representative gene sets depleted in high versus low SCNA level tumors (A). In (B), the log2FC values between high versus low SCNA level tumors and corresponding FDR are shown for representative genes. See also table S3, A and C. (C) For each tumor type, RNA-seq analysis and GSEA were performed as in (A), and the FDR values for the indicated tumor types and pathways are shown as a heat map. 0.00 indicates an FDR of <10−2. See also table S4B.
Fig. 3
Fig. 3. Markers of specific immune cells in high versus low SCNA level tumors
(A) Sets of genes specific for different types of immune cells (see table S4D) were analyzed for their expression in tumors with low or high SCNA levels in the pan-cancer analysis. Representative genes characterizing each immune cell type are shown with a heat map representing the corresponding FDR derived from the RNA-seq analysis (% dec., percent decrease). (B to D) Box plots of the gene expression ratios (normalized, presented as Z score) of (B) proinflammatory (IFN-γ, IL-1A, IL-1B, and IL-2) versus anti-inflammatory genes (TGFB1, IL-10, IL-4, and IL-11), (C) CD8+ Tcell–specific versus Treg-specific genes (table S4D), and (D) M1 macrophage–specific versus M2 macrophage–specific genes (see Materials and methods and table S4D). (E) RNA-seq analysis was performed comparing tumors with high versus low SCNA level for the indicated cancer types. Gene sets representing markers specific for the indicated immune cell types were used to perform a GSEA analysis as in (A). For the signatures “CD8+ T cell to Treg ratio,” “pro- to anti-inflammatory cytokines ratio,” and “M1 to M2 macrophage ratio,” a similar analysis to the one shown in (B) to (D) was performed. The FDR is shown using a heat map.
Fig. 4
Fig. 4. Relationship between arm/chromosome and focal SCNAs and the immune or cell cycle signature scores
(A and B) Logistic regression was performed by comparing the tumor samples with high versus low cell cycle (A) or immune (B) signature scores and considering the arm/chromosome SCNA level and the focal SCNA level as predictors (both after standardization). The β coefficient and P value are indicated for each of the predictors. In addition, next to each of the axes on the graphs, the distribution of the corresponding parameter among tumors with high or low cell cycle (A) or immune infiltrate (B) signature is shown (dashed line indicates average value). (C and D) Logistic regression was performed as in (A) and (B) for individual tumor types. The β coefficient is indicated for each of the predictors for the indicated tumor type. A heat map is used to show the value of the β coefficients (for the coefficients with a P value of <0.1; see also table S5C). (E) Relationship between the focal and arm-level SCNAs. For each genome segment (807 genomic regions corresponding to cytogenetic bands), the frequency of amplification or deletion, for both focal and arm-level events in the pan-cancer data set, is shown (see Materials and methods and table S5D).
Fig. 5
Fig. 5. Comparison between the number of mutations and SCNA level in the prediction of the immune signature
(A) Box plots illustrating the distribution of the immune signature among the normal tissue samples and the tumors with a low (L) or with a high (H) number of mutations or arm/chromosome SCNAs, as indicated. The P value from Wilcoxon test is shown. (B and C) For each tumor type, a plot is shown containing the immune signature score (y axis) versus the total number of (B) mutations (x axis) or (C) the arm/chromosome SCNA level in each tumor sample. The Spearman correlation coefficient and P value are shown. For BRCA, the relationship within the ER/PR-negative tumors only is shown separately as a dashed line. (D) The ratio between the number (n) of neoepitopes observed versus expected is shown in CRC for tumors with low and high SCNA level or mutations as indicated. The t test P value and percent increase in the observed versus expected neoepitope ratio are shown.
Fig. 6
Fig. 6. Prediction of the cell cycle and immune signature score and survival analysis of melanoma patients after immunotherapy
(A and B) For each tumor type, lasso was used to identify the best parameters predicting the cell cycle signature (A) or the immune signature score (B) on the training set. The selected parameters were used to refit a logistic regression model on the training set, and the corresponding β coefficients are shown for each indicated parameter and tumor type. A coefficient of 0.00 refers to parameters that were not selected. The resulting model was applied to the test set, and ROC-AUC is shown for each tumor type. The number of mutations was considered as log-transformed and standardized. TP53 mutation and gender were considered as binary parameters, and all the other parameters were standardized. NAs indicate that the corresponding parameters were not applicable (see also table S5, E and F). (C) Relationship between the SCNA level and the number of mutations with the response to anti–CTLA-4 immunotherapy. Data from the anti–CTLA-4 trial in melanoma patients described by Van Allen et al. (27) were used as described in Materials and methods. In the box plots, patients were divided into those who did achieve long-term survival (Long-term survival; different shades of green) and those who did not (No clinical benefit; gray). In addition, among the first group, a subset of 10 patients was further identified as patients with no clinical benefit within 6 months, as previously described (27). P values are shown for the comparison of the distribution of the number of mutations or the SCNA level between the indicated groups of patients (Wilcoxon test). (D and E) Survival analysis for the SCNA level, the number of mutations, and a combination of the two parameters. The number of mutations and the SCNA level were derived as in (C). In (D), the SCNA level (left) and the number of mutations (right) were used as individual predictors of survival in a univariate Cox proportional hazards models. In both cases, patients were stratified in two groups using the median value as a cutoff. HR and Wald test P values from the Cox proportional hazards model comparing the two groups of patients are shown. Kaplan-Meier survival curves are shown. In (E), multivariate Cox proportional hazards model was used including both the SCNA level and the number of mutations as predictors. On the basis of this multivariate model (table S6A), we derived a risk score for each patient and we stratified the patients in two groups using the median as a cutoff. HR and Wald test P values from the Cox proportional hazards model comparing the two groups of patients are shown. Kaplan-Meier survival curves for patients stratified in the two groups are also shown (table S6A). (F and G) The survival analyses presented were generated as in (D) and (E) with the indicated data set (table S6B).

Comment in

References

    1. Holland AJ, Cleveland DW. Boveri revisited: Chromosomal instability, aneuploidy and tumorigenesis. Nat Rev Mol Cell Biol. 2009;10:478–487. doi: 10.1038/nrm2718. - DOI - PMC - PubMed
    1. Beroukhim R, et al. The landscape of somatic copy-number alteration across human cancers. Nature. 2010;463:899–905. doi: 10.1038/nature08822. - DOI - PMC - PubMed
    1. Zack TI, et al. Pan-cancer patterns of somatic copy number alteration. Nat Genet. 2013;45:1134–1140. doi: 10.1038/ng.2760. - DOI - PMC - PubMed
    1. Lengauer C, Kinzler KW, Vogelstein B. Genetic instability in colorectal cancers. Nature. 1997;386:623–627. doi: 10.1038/386623a0. - DOI - PubMed
    1. Cahill DP, Kinzler KW, Vogelstein B, Lengauer C. Genetic instability and darwinian selection in tumours. Trends Cell Biol. 1999;9:M57–M60. doi: 10.1016/S0962-89249901661-X. - DOI - PubMed

Publication types