Review
. 2017 Jan 20;18(2):101-113.
doi: 10.1038/nrn.2016.178.

Selective neuronal vulnerability in Parkinson disease

Affiliations
Review

Selective neuronal vulnerability in Parkinson disease

D James Surmeier et al. Nat Rev Neurosci. .

Abstract

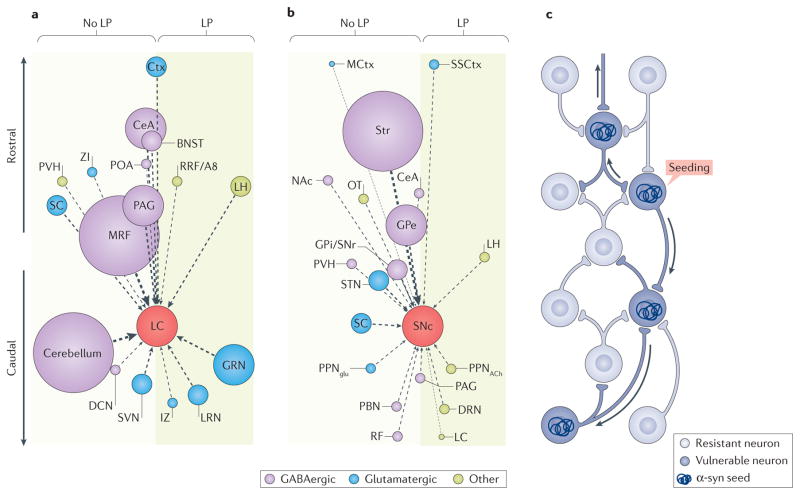
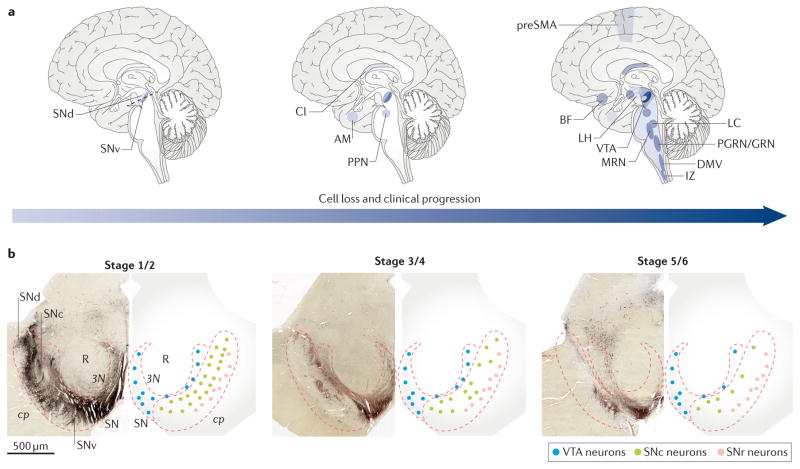
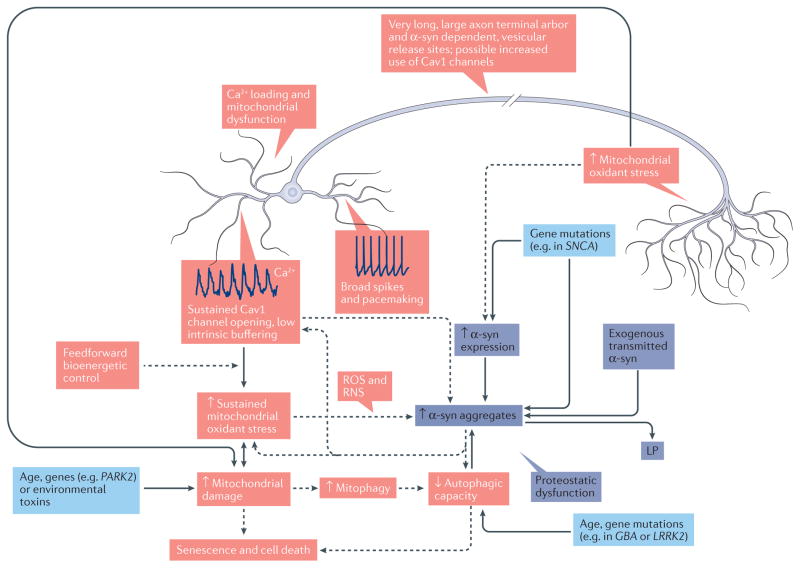
Intracellular α-synuclein (α-syn)-rich protein aggregates called Lewy pathology (LP) and neuronal death are commonly found in the brains of patients with clinical Parkinson disease (cPD). It is widely believed that LP appears early in the disease and spreads in synaptically coupled brain networks, driving neuronal dysfunction and death. However, post-mortem analysis of human brains and connectome-mapping studies show that the pattern of LP in cPD is not consistent with this simple model, arguing that, if LP propagates in cPD, it must be gated by cell- or region-autonomous mechanisms. Moreover, the correlation between LP and neuronal death is weak. In this Review, we briefly discuss the evidence for and against the spreading LP model, as well as evidence that cell-autonomous factors govern both α-syn pathology and neuronal death.


Conflict of interest statement

Competing interests statement:

The authors declare no competing interests.

Figures

Figure 1
Figure 1. Staging of Lewy pathology in clinical Parkinson disease
a | A schematic representation of the spread of Lewy pathology (LP) within different brain structures, based on the study of Braak et al., is shown. The anatomical progression of disease through the brain increases over time (from left to right), and the darker the colour the more LP is present in each region at a given stage. b | A lateral external surface of a representative brain identifies the levels of each cross-sectional brain slice (in the figure, i–v). Regions (which are not to scale) that contain LP at any stage are represented in red, whereas those that only rarely show LP, or that only show mild LP, are indicated in blue. ac, anterior commissure; aq, aqueduct; AM, amygdala; BF, magnocellular nuclei of the basal forebrain; BNST, bed nucleus of the stria terminalis; Cl, claustrum; cp, cerebral peduncle; DMV, dorsal motor nucleus of the vagus; DRN, dorsal raphe nucleus; FCtx, frontal cortex; GP, globus pallidus; GPe, GP externa; GPi, GP interna; HN, hypoglossal nucleus; ic, internal capsule; icp, inferior cerebellar peduncle; IL, intralaminar nuclei of the thalamus; ion, inferior olivary nucleus; IZ, intermediate reticular zone; LC, locus coeruleus and subcoeruleus; LCtx, limbic cortex; LH, lateral hypothalamus; mcp, middle cerebellar peduncle; MRN, median raphe nucleus; OB, olfactory bulb; opt, optic tract; OT, olfactory tubercle; PAG, periaqueductal grey; PBN, parabrachial nucleus; PGRN/GRN, paragigantocellular and gigantocellular reticular nucleus; PPN, pedunculopontine nucleus; PRN, pontine reticular nucleus; pt, pyramidal tract; RM, raphe magnus; RRF/A8, retrorubral fields/A8 dopaminergic cell group; SC, superior colliculus; Se, septum; SNc, substantia nigra pars compacta; SNr, substantia nigra pars reticulata; SO, solitary tract nuclei; STN, subthalamic nucleus; Str, striatum; SVN, spinal vestibular nucleus; T, thalamus; VTA, ventral tegmental area; ZI, zona incerta.
Figure 2
Figure 2. Does connectivity predict Lewy pathology in clinical Parkinson disease?
The connectomes of the mouse locus coeruleus (LC) (part a) and substantia nigra pars compacta (SNc) (part b) do not predict the pattern of postsynaptic, intraneuronal Lewy pathology (LP) that is observed in clinical Parkinson disease (cPD). Because data on the human connectome are not available and because there have been no direct comparisons between the mouse connectome and the spread of LP, a thought experiment was conducted. This thought experiment, as depicted in the figure, assumes that the mouse and human connectomes are largely similar and that retrograde spread of α-synuclein (α-syn) is dictated by the number or strength of synaptic connections. a | A plot of the afferent connectome of mouse LC adrenergic neurons, based on data presented by Schwarz et al., is shown. Nuclei projecting to the LC are represented as circles distributed along a rostrocaudal vertical axis. The diameter of the circle represents the strength of the projection as estimated by the number of retrogradely labelled neurons; the dominant transmitter (GABA, glutamate or other) in each nucleus is coded by a given colour. Nuclei with postsynaptic, intraneuronal LP in late-stage cPD are positioned in the shaded box on the right; nuclei with little or no LP are on the left. The plot reveals that the strength of the synaptic connection to the LC is not correlated with LP; most of the larger circles are located on the left of the plot. b | A plot of the connectome of mouse SNc dopamine neurons as in part a, based on the work of Ogawa et al. and Watabe-Uchida et al., is shown. Again, there is no clear correlation between the strength of the synaptic connection with SNc and the probability of manifesting postsynaptic, intraneuronal LP in humans with cPD. c | The schematic summarizes the conclusion that, if there is spread of α-syn, it is not strictly determined by synaptic connectivity, but rather must be dictated by other factors, such as vulnerability. In the diagram, a synaptic network is depicted with neurons that are resistant to α-syn spread (light blue) and those that are vulnerable (dark blue). An α-syn seeding event will then result in the spread of LP in a retrograde manner only through vulnerable neurons (depicted by the arrows). BNST, bed nucleus of the stria terminalis; CeA, central nucleus of the amygdala; Ctx, cortex; DCN, deep cerebellar nuclei; DRN, dorsal raphe nucleus; GPe, globus pallidus externa; GPi/SNr, GP interna–SN pars reticulata; GRN, gigantocelluar reticular nucleus; IZ, intermediate reticular zone; LH, lateral hypothalamus; LRN, lateral reticular nucleus; MCtx, motor region of the cerebral cortex; MRF, midbrain reticular nucleus; NAc, nucleus accumbens; OT, olfactory tubercle; PAG, periaqueductal grey; PBN, parabrachial nucleus; POA, preoptic area; PPNglu, glutamatergic neurons of the pedunculopontine nucleus; PPNACh, cholinergic neurons of the pedunculopontine nucleus; PVH, paraventricular hypothalamic nucleus; RF, reticular formation; RRF/A8, retrorubral fields/A8 dopaminergic cell group; SC, superior colliculus; SSCtx, somatosensory cortex; STN, subthalamic nucleus; Str, striatum; SVN, spinal vestibular nucleus; ZI, zona incerta.
Figure 3
Figure 3. Staging of neurodegeneration in clinical Parkinson disease
a | The schematics represent the progression of neuronal cell loss following the onset of clinical Parkinson disease (cPD), based on the literature. The anatomical distribution of neuronal loss increases with time, and the darker the colour, the more neuronal loss evident in each region. b | Transverse sections of the midbrain, as indicated in the left brain schematic in part a (dotted line), are shown; the normal distribution of tyrosine hydroylase-immunopositive dopaminergic neurons is shown in the left panels, and the pattern is schematized in the right panels. Heavily pigmented neurons of the substantia nigra pars compacta (SNc) are depicted in green; less pigmented neurons of the ventral tegmental area (VTA) are depicted in blue; neurons of the SN pars reticulata (SNr) are depicted in pink. The initial loss of ventral-tier SNc observed in patients with stage 4 cPD is depicted in the middle panel, with greater cell loss observed over time at later stages, as indicated in the right panel. 3N, third nerve; AM, amygdala; BF, magnocellular nuclei of the basal forebrain; Cl, claustrum; cp, cerebral peduncle; DMV, dorsal motor nucleus of the vagus; IZ, intermediate reticular zone; LC, locus coeruleus and sub-coeruleus; LH, lateral hypothalamus; MRN, median raphe nucleus; PGRN/GRN, paragigantocellular and gigantocellular reticular nucleus; PPN, pedunculopontine nucleus; preSMA, presupplementary motor area; R, red nucleus; SNd, dorsal tier of the SNc; SNv, ventral tier of the SNc.
Figure 4
Figure 4. How cell-autonomous factors might contribute to Lewy pathology and cell death in clinical Parkinson disease
The schematic summarizes the key features of vulnerable neurons and how these features might contribute to Lewy pathology (LP) and neuronal death in clinical Parkinson disease (cPD). These mechanisms are divided into two classes: Ca2+ loading and/or mitochondrial dysfunction (red), and proteostatic dysfunction (purple). The arrows indicate causality. Ca2+ loading and/or mitochondrial dysfunction: vulnerable neurons are typically autonomous pacemakers (example spiking is shown near the cell body) with large fluctuations in cytosolic Ca2+ (dendritic Ca2+ oscillations are also shown) that are not strongly buffered (reflecting feedforward control of oxidative phosphorylation); this design leads to increased mitochondrial oxidant stress and damage. Mitochondrial damage could be exacerbated by age, environmental toxins and genetic mutations affecting mitochondrial quality control (light blue boxes). In addition, a large axonal arbor leads to elevated mitochondrial oxidant stress and damage. Accumulation of mitochondrial defects and/or damage leads to senescence and/or cell death. Proteostatic dysfunction: in vulnerable neurons, α-synuclein (α-syn; which is encoded by SNCA) aggregation could be increased by elevated α-syn expression due to the long and highly branched axon, uptake of α-syn from synaptically coupled cells or genetic mutations. As described in the text, elevated cytosolic Ca2+, reactive oxygen species (ROS) and reactive nitrogen species (RNS), or uptake of aggregated α-syn could promote formation of intracellular α-syn aggregates, leading to LP. In addition, decreased autophagic capacity resulting from increased mitophagy (due to mitochondrial damage), genetic mutations or ageing could impair clearance of aggregates, increasing their prominence. Decreased autophagy, as reviewed in the text, could also promote cell death. Last, α-syn aggregates could contribute to mitochondrial dysfunction, oxidant stress and elevated cytosolic Ca2+ levels, further promoting pathology. Solid arrows indicate connections between events that are well established in mammalian models; dashed arrows indicate connections between mechanisms for which there is good but not unequivocal support. GBA, glucosylceramidase; LRRK2, leucine-rich repeat serine/threonine-protein kinase 2; PARK2, parkin.

References

    1. Berg D, et al. Time to redefine PD? Introductory statement of the MDS task force on the definition of Parkinson’s disease. Mov Disord. 2014;29:454–462. This article reviews clinical and biological knowledge on PD showing that LP is not essential for cPD and occurs in a large proportion of patients who may not have cPD. - PMC - PubMed
    1. Hornykiewicz O. Dopamine miracle: from brain homogenate to dopamine replacement. Mov Disord. 2002;17:501–508. - PubMed
    1. Goedert M, Spillantini MG, Del Tredici K, Braak H. 100 years of Lewy pathology. Nat Rev Neurol. 2012;9:13–24. - PubMed
    1. Dijkstra AA, et al. Stage-dependent nigral neuronal loss in incidental Lewy body and Parkinson’s disease. Mov Disord. 2014;29:1244–1251. This paper describes a negative correlation between neuronal density and local α-syn burden in the SN of patients with PD and shows that the severity of neurodegeneration and local burden of α-syn pathological conditions are closely coupled during disease progression. - PubMed
    1. Hawkes CH, Del Tredici K, Braak H. Parkinson’s disease: a dual-hit hypothesis. Neuropathol Appl Neurobiol. 2007;33:599–614. - PMC - PubMed

Substances