. 2017 Oct;31(10):2094-2103.
doi: 10.1038/leu.2017.29. Epub 2017 Jan 20.

Next Generation Flow for highly sensitive and standardized detection of minimal residual disease in multiple myeloma

Affiliations

Next Generation Flow for highly sensitive and standardized detection of minimal residual disease in multiple myeloma

J Flores-Montero et al. Leukemia. 2017 Oct.

Abstract

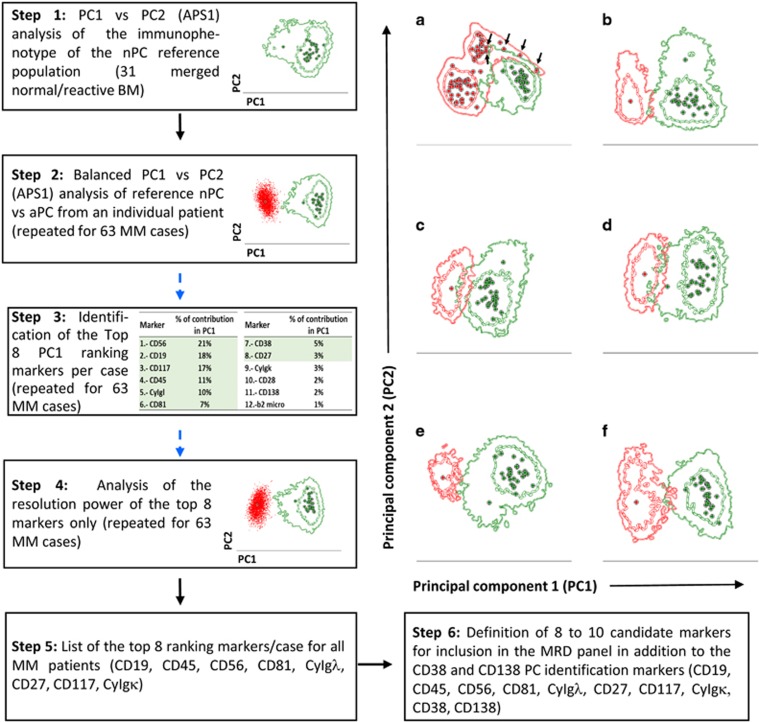
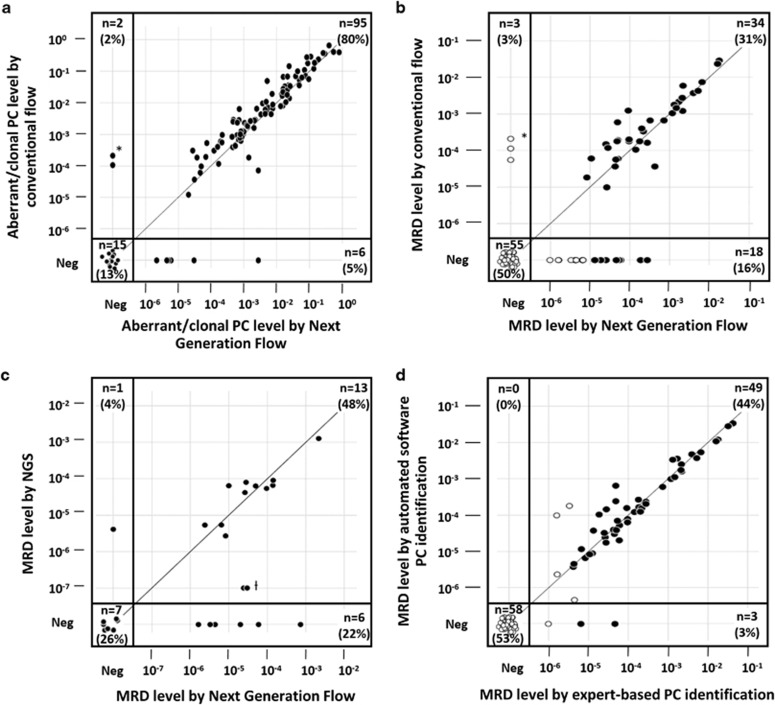
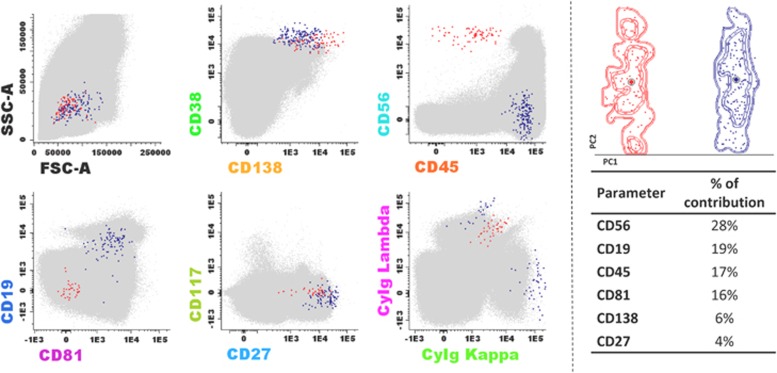
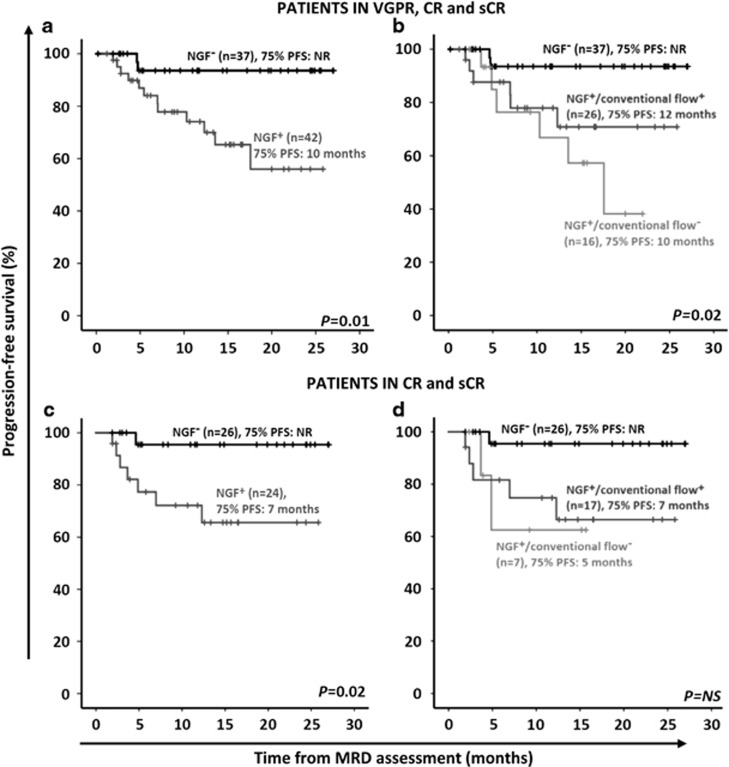
Flow cytometry has become a highly valuable method to monitor minimal residual disease (MRD) and evaluate the depth of complete response (CR) in bone marrow (BM) of multiple myeloma (MM) after therapy. However, current flow-MRD has lower sensitivity than molecular methods and lacks standardization. Here we report on a novel next generation flow (NGF) approach for highly sensitive and standardized MRD detection in MM. An optimized 2-tube 8-color antibody panel was constructed in five cycles of design-evaluation-redesign. In addition, a bulk-lysis procedure was established for acquisition of ⩾107 cells/sample, and novel software tools were constructed for automatic plasma cell gating. Multicenter evaluation of 110 follow-up BM from MM patients in very good partial response (VGPR) or CR showed a higher sensitivity for NGF-MRD vs conventional 8-color flow-MRD -MRD-positive rate of 47 vs 34% (P=0.003)-. Thus, 25% of patients classified as MRD-negative by conventional 8-color flow were MRD-positive by NGF, translating into a significantly longer progression-free survival for MRD-negative vs MRD-positive CR patients by NGF (75% progression-free survival not reached vs 7 months; P=0.02). This study establishes EuroFlow-based NGF as a highly sensitive, fully standardized approach for MRD detection in MM which overcomes the major limitations of conventional flow-MRD methods and is ready for implementation in routine diagnostics.


Conflict of interest statement

G-EG and RF are employees of Cytognos SL, Salamanca, Spain. JJMvD received research support and traveling support from Roche, Amgen and Becton Dickinson. SB received research support from Roche, Celgene, Becton Dickinson and AbbVie as well as honoraria from Roche and AbbVie. JF-M, LS-F, OG-S, J-JP-M, AC-M, CJ, JM-L, M-VM, VvdV, JC, LS, NP, M-BV, RGS, MG, RP, M-CdC, JB, J-JL, CA, AB, AG-M, JL, PL, CA-S, JS-M, BD and AO declare no conflict of interest.

Figures

Figure 1
Figure 1
Diagram illustrating the process used for the selection and evaluation of markers for the NGF MM MRD panel. Left and lower right panels show the sequential steps followed to select those markers providing the best resolution between aPCs and nPC, including principal component 1 (PC1) vs PC2 —automatic population separator (APS1)— plots illustrating the described comparisons for steps 1, 2 and 4, respectively. (right; a) An APS1 plot corresponding to the simultaneous evaluation of 31 normal/reactive BM samples vs all 63 MM patients studied at diagnosis, in which the resolution power of the EuroFlow diagnostic PCD antibody panel combination is illustrated. Please note that PC from five samples (highlighted by the black arrows) showed suboptimal separation in the overall comparison; nonetheless, when individually compared vs the normal/reactive reference PC pool (bf), these cases also showed sufficient phenotypic discrimination from nPC. Markers contributing to PC1 (and their percentage contribution) for each panel on the right include: (a) CD19(20%), CD56(17%), CD81(13%), CD45(11%), CD117(10%), CD27(8%), CyIgλ(5%), CD38(5%), CyIgκ(4%), β2 micro(3%), CD138(3%), CD28(1%); (b) CyIgκ(27%), CyIgλ(13%), β2 micro(12%), CD38(11%), CD56(10%), CD138(7%), CD28(16%), CD45(4%), CD27(4%), CD117(4%), CD19(2%), CD81(0%); (c) CyIgκ(20%), CD45(16%), CD56(11%), CD28(10%), CD19(10%), CD27(8%), CD117(6%), CD81(6%), CD38(6%), CyIgλ(4%), CD138(3%), β2 micro(0%); (d), CD19(29%), β2 micro(13%), CyIgκ(13%), CD56(13%), CD45(11%), CD38(5%), CD27(4%), CyIgλ(3%), CD28(3%), CD138(2%), CD117(2%), CD81(2%); (e) CD19(23%), β2 micro(13%), CD45(12%), CyIgλ(11%), CD81(9%), CD56(7%), CyIgκ(6%), CD38(6%), CD28(4%), CD138(4%), CD27(4%), CD117(1%); (f) CD19(20%), CD117(19%), CD81(14%), CD45(13%), CD56(12%), CyIgλ(9%), β2 micro(6%), CD38(3%), CD27(2%), CD28(1%), CD138(1%), CyIgκ(0%). In all PC1 vs PC2 plots, solid circles represent median values for the 12 fluorescence-associated parameters evaluated, inner (dotted) and outer (solid) lines represent the first and second standard deviations for individual PC. nPC populations are depicted in green while aPC are shown as red dots, circles and lines, respectively.
Figure 2
Figure 2
Validation of the new NGF method for MRD detection in MM against both conventional 8-color flow-MRD (a, b) and NGS (c), including expert-based vs automated NGF-MRD data analysis (d). In a, the comparison between NGF and conventional flow-MRD is shown for diagnostic and follow-up samples from patients with stable/progressive disease and partial response (n=118), while in b the two flow methods are specifically compared for follow-up samples from MM patients in VGPR and CR/sCR (n=110). (d) The correlation between expert-based vs automatic PC identification MRD levels in the same 110 BM samples as those of b. In turn, c shows the correlation between NGS and NGF MRD levels for those 27 (low level) MRD samples analyzed by both methods. *Samples proven polyclonal by Cy Ig κ/λ staining (2/2 and 2/3 in a and b, respectively). ƚSamples positive by NGS at the limit of quantitation of the technique. White and black circles in b and d represent NGF MRD levels below and above the limit of quantitation of the technique, respectively.
Figure 3
Figure 3
Illustrating graphical representations of the performance of the NGF method based on the analysis of (merged) data files corresponding to a BM MM sample (>107 cells) with low level MRD stained with the NGF-MM MRD panel (Version 5). Left panels show classical bivariate dot plot representations in which PC (blue and red dots) were gated using a conventional manual analysis strategy. nPC (blue dots) display characteristic normal patterns of expression for the surface membrane markers used, with a cytoplasmic (Cy) Igκ vs CyIgλ ratio of 1.6. In contrast, clonal/aberrant PC (red dots) can be clearly discriminated from nPC based on their more homogeneous phenotypic profile, the presence of myeloma-associated phenotypes (CD138hi, CD38dim, CD19, CD81, CD117 and CD27dim) and a restricted pattern of expression of CyIgλ. Other non-PC BM populations are depicted as gray dots. In turn, the top right panel shows the results of principal component analysis –automatic population separator 1 (APS1) view of principal component 1 (PC1) vs PC2— demonstrating a clearly different overall immunophenotypic profile of normal and aPCs in this sample. In this later plot, circles represent median values for all phenotypic parameters measured in the two tubes but CyIgs, while inner (doted) and outer (solid) lines represent the first and second s.d. of the distribution of the PC events in the multidimensional space, respectively. The table in the right illustrates the top 6 parameters contributing to the separation between nPC and aPC in the above PC1 vs PC2 plot and their percentage contribution to the separation. Please note that, in this sample, PC corresponded to 0.005% of all nucleated BM cells; in turn, aberrant PC (127 PC events) corresponded to 0.001% of the whole BM cellularity with an assay sensitivity (in the quantitative range) of <5 × 10⁻⁶.
Figure 4
Figure 4
PFS curves of MM patients grouped according to their BM MRD status as assessed by NGF (a, c) and both NGF and conventional flow-MRD (b, d). In a and b the impact of the MRD status is shown for MM patients in VGPR, CR and sCR (n=79), while in c and d, PFS analyses was restricted to MM patients who were in CR and sCR at the moment of MRD assessment (n=50).

References

    1. Ocio EM, Richardson PG, Rajkumar SV, Palumbo A, Mateos MV, Orlowski R et al. New drugs and novel mechanisms of action in multiple myeloma in 2013: a report from the International Myeloma Working Group (IMWG). Leukemia 2014; 28: 525–542. - PMC - PubMed
    1. Bianchi G, Richardson PG, Anderson KC. Promising therapies in multiple myeloma. Blood 2015; 126: 300–310. - PMC - PubMed
    1. Lonial S, Durie B, Palumbo A, San-Miguel J. Monoclonal antibodies in the treatment of multiple myeloma: current status and future perspectives. Leukemia 2016; 30: 526–535. - PMC - PubMed
    1. Rajkumar SV, Kumar S. Multiple myeloma: diagnosis and treatment. Mayo Clin Proc 2016; 91: 101–119. - PMC - PubMed
    1. Lahuerta JJ, Mateos MV, Martinez-Lopez J, Rosinol L, Sureda A, de la Rubia J et al. Influence of pre- and post-transplantation responses on outcome of patients with multiple myeloma: sequential improvement of response and achievement of complete response are associated with longer survival. J Clin Oncol 2008; 26: 5775–5782. - PubMed

Publication types

MeSH terms