. 2017 Jan 5:10:298.
doi: 10.3389/fncel.2016.00298. eCollection 2016.

Neuronal Cell Bodies Remotely Regulate Axonal Growth Response to Localized Netrin-1 Treatment via Second Messenger and DCC Dynamics

Affiliations

Neuronal Cell Bodies Remotely Regulate Axonal Growth Response to Localized Netrin-1 Treatment via Second Messenger and DCC Dynamics

Agata Blasiak et al. Front Cell Neurosci. .

Abstract

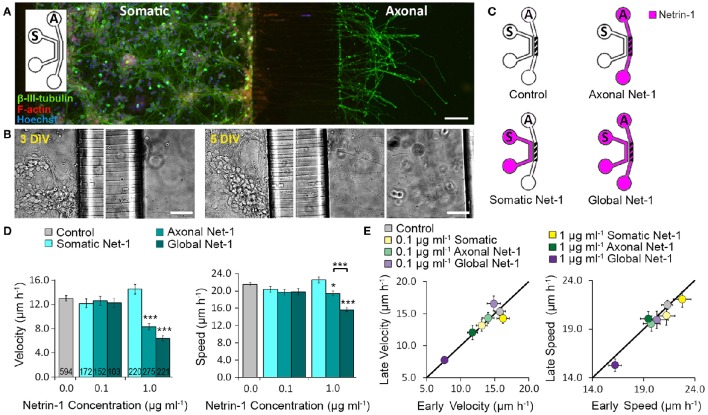
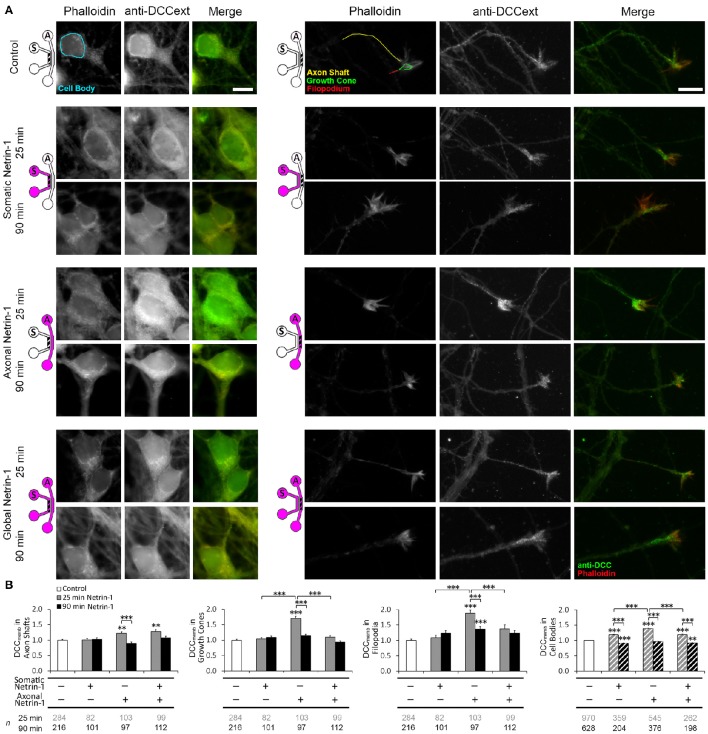
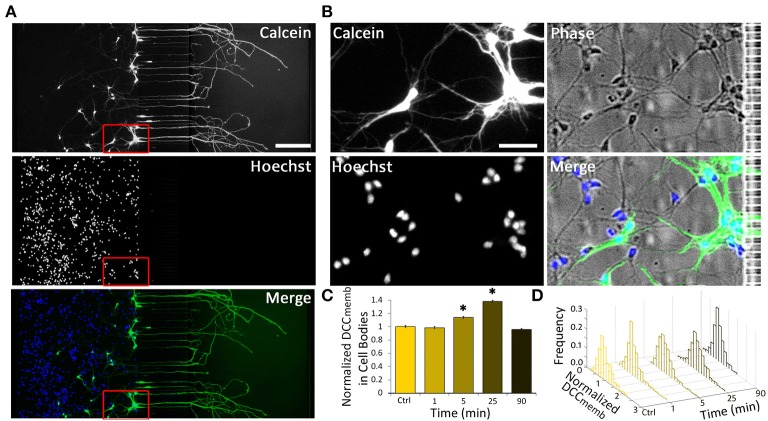
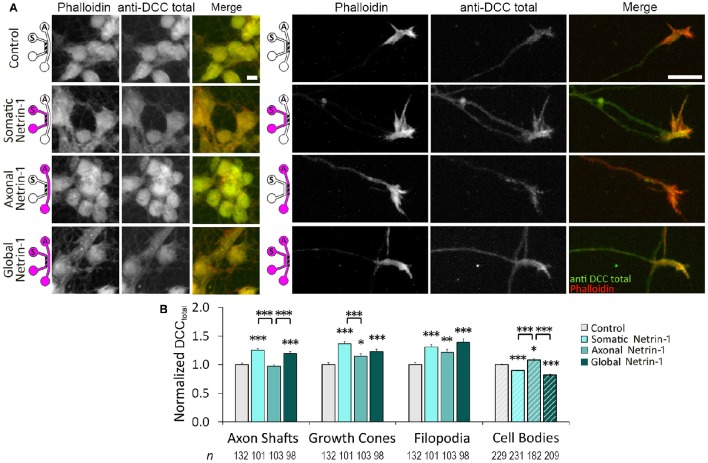
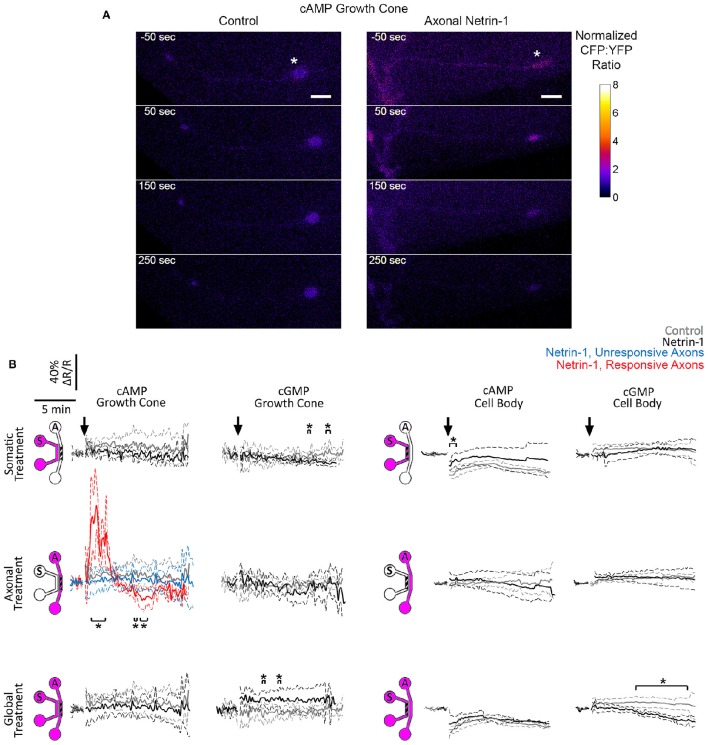
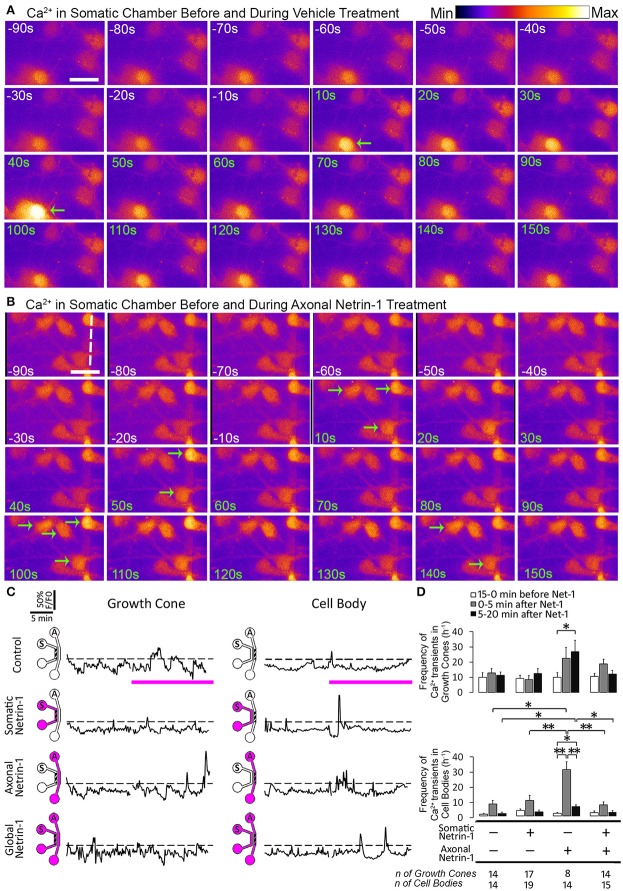
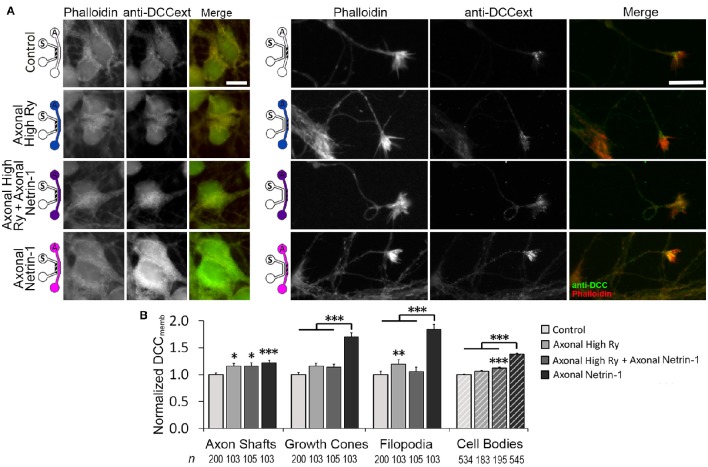
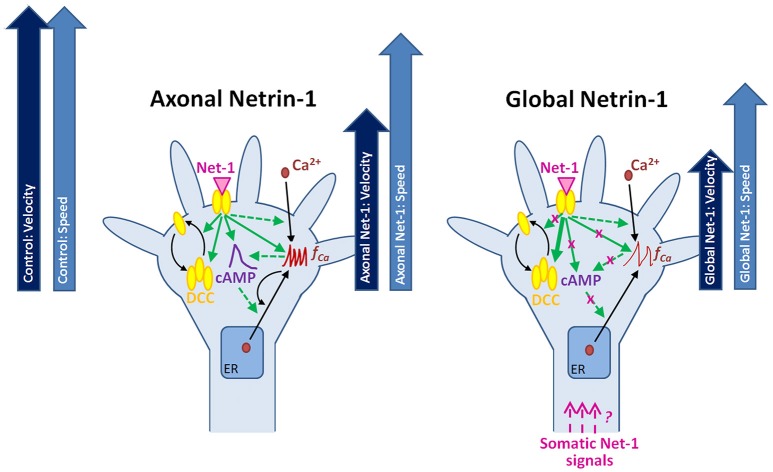
Netrin-1 modulates axonal growth direction and speed. Its best characterized receptor, Deleted in Colorectal Cancer (DCC), is localized to growth cones, but also observed in the cell bodies. We hypothesized that cell bodies sense Netrin-1 and contribute to axon growth rate modulation, mediated by the second messenger system. We cultured mouse cortical neurons in microfluidic devices to isolate distal axon and cell body microenvironments. Compared to isolated axonal treatment, global Netrin-1 treatment decreased the axon elongation rate and affected the dynamics of total and membranous DCC, calcium, and cyclic nucleotides. Signals induced by locally applied Netrin-1 propagated in both anterograde and retrograde directions, demonstrated by the long-range increase in DCC and by the increased frequency of calcium transients in cell bodies, evoked by axonal Netrin-1. Blocking the calcium efflux from endoplasmic reticulum suppressed the membranous DCC response. Our findings support the notion that neurons sense Netrin-1 along their entire lengths in making axonal growth decisions.

Keywords: calcium signaling; compartmentalization; guidance cues; microfluidics; pathfinding.


Figures

Figure 1
Figure 1
Axon elongation depends on the localization of Netrin-1 treatment. (A) Neurons cultured in the bicompartmental device (inset) send neurites from the somatic (S) to the axonal (A) compartment through microchannels. Scale bar = 80 μm. (B) Neuronal growth profile at 3 and 5 days in vitro (DIV). Scale bars = 50 μm. (C) Modes of Netrin-1 treatment. The axon elongation was measured in the axonal compartment (hatch). (D) Average velocity and speed (mean ± s.e.m.) for increasing Netrin-1 concentrations and different compartments of delivery. The numbers on bars represent the number of individual axons from N ≥ 2 independent experiments (Table S1); statistical significance compared to controls unless indicated otherwise; *p < 0.05, ***p < 0.001. (E) Comparison of axon growth in the first (early) and last (late) 0.5 h of imaging. Data for axonal Netrin-1 treatment are re-presented with permission from Blasiak et al. (2015). Copyright 2015 American Chemical Society.
Figure 2
Figure 2
Netrin-1 modulates local and long-range DCC insertion into plasma membrane. (A) Membranous DCC staining in the control group and 25 and 90 min after isolated (axonal and somatic) or global Netrin-1 treatment. Schematics show which compartment, somatic (S) or axonal (A), underwent Netrin-1 treatment (pink) and which compartment was imaged (hatch). The ROIs were chosen in Phalloidin channel as shown by the color overlay in control. Scale bars = 10 μm. (B) Staining intensity (mean ± s.e.m.) was measured in the axonal compartment (solid fill) and in the somatic compartment (hatch fill), and normalized with the control signal. n is the number of individual ROIs from N ≥ 3 independent experiments (Table S2); statistical significance compared to controls unless indicated otherwise; **p < 0.01, ***p < 0.001. Axonal compartment data for axonal Netrin-1 treatment are re-presented with permission from Blasiak et al. (2015). Copyright 2015 American Chemical Society.
Figure 3
Figure 3
Axonal Netrin-1-induced change in membranous DCC in cell bodies is uniformly distributed within the somatic compartment. (A) Cell permeable Calcein AM labels entire neurons upon its uptake in the axonal compartment (green). Majority of neurons do not have an axon in the axonal compartment, as indicated by the nuclear stain (blue). Scale bar = 200 μm. (B) The boxed area in (A) is magnified to reveal neurons labeled and not labeled with Calcein near microchannels. Scale bar = 50 μm. (C) Membranous DCC staining intensity in cell bodies normalized by the control value for increasing duration of 1.0 μg ml−1 axonal Netrin-1 treatment. Error bars represent s.e.m.; n > 200 for each time point from N ≥ 3 distinct cultures (Table S3); statistical significance compared to controls with Kolmogorov-Smirnov test with Dunn-Sidak correction for multiple comparisons; *p < 0.05. (D) Membranous DCC signal intensity distribution for each time point.
Figure 4
Figure 4
Netrin-1 treatment modulates local and long-range total DCC. (A) Total DCC staining upon 90 min-long somatic, axonal, or global treatment with 1.0 μg ml−1 Netrin-1 or vehicle (control). The schematics show which compartment, somatic (S) or axonal (A), underwent Netrin-1 treatment (pink) and which compartment was imaged (hatch). Scale bars = 10 μm. (B) DCC staining intensity (mean ± s.e.m.) was measured in the ROIs in the axonal (solid fill) and somatic (hatch fill) compartments, and normalized with the control signal. n is the number of individual ROIs from N ≥ 3 independent experiments (Table S4); statistical significance compared to controls unless indicated otherwise; *p < 0.05, **p < 0.01, ***p < 0.001. Axonal compartment data for axonal Netrin-1 treatment are re-presented with permission from Blasiak et al. (2015). Copyright 2015 American Chemical Society.
Figure 5
Figure 5
Netrin-1 modulates cyclic nucleotides differentially for the local and global treatments. (A) Pseudo-colored cAMP CFP:YFP fluorescence intensity ratio (ΔR), normalized by the baseline ratio (R), in distal axons in response to axonal treatment with Netrin-1 or vehicle (control). Scale bars = 5 μm. (B) cAMP and cGMP signals in growth cones and in cell bodies in response to treatments (arrows) with vehicle (gray) or with local or global Netrin-1 treatments (black). Growth cone cAMP signals are given separately for responsive (red) and unresponsive (blue) axons. Data are given as mean with 95% confidence interval (broken lines). *p < 0.05. Measurements were done in N ≥ 2 distinct cultures (Table S5). For individual data traces, see Figure S4.
Figure 6
Figure 6
Axonal but not global Netrin-1 induces local and long-range changes in calcium activity. (A,B) Calcium activity in cell bodies before (white time overlay) and after (green time overlay) adding vehicle (A) or 1.0 μg ml−1 Netrin-1 (B) into axonal compartment at t = 0. Green arrows point at cell bodies that start firing. Broken line indicates the beginning of microchannels. Scale bar = 20 μm. (C) Representative calcium activity traces in response to treatment (pink bars) with vehicle (control) or with 1.0 μg ml−1 Netrin-1. Signals (F) exceeding 20% of the baseline fluorescence (F0; dashed lines) were considered positive. The schematics show which compartment, somatic (S) or axonal (A), underwent Netrin-1 treatment (pink) and which compartment was imaged (hatch). (D) Frequency of calcium transients (mean ± s.e.m.); n is the number of individual measurements from N ≥ 2 distinct cultures (Table S6); *p < 0.05, **p < 0.01.
Figure 7
Figure 7
Calcium efflux from internal stores is necessary for Netrin-1-driven DCC membrane insertion. (A) Membranous DCC (DCCmemb) staining intensity after 25 min of axonal treatments, as shown by the schematics: with vehicle (control; PBS for Netrin-1, water for Ryanodine), 100 μM ryanodine (High Ry; blue), 1.0 μg ml−1 Netrin-1 (pink), or combined (purple). The hatch shows imaging site—axonal (A) or somatic (S). Scale bars = 10 μm. (B) DCC staining intensity (mean ± s.e.m.) was measured in the ROIs in the axonal (solid fill) and somatic (hatch fill) compartments, and normalized with the control signal. n is the number of individual measurements from N ≥ 3 independent experiments (Table S7); statistical significance compared to controls unless indicated otherwise; *p < 0.05, **p < 0.01, ***p < 0.001. Axonal compartment data for axonal Netrin-1 treatment are re-presented with permission from Blasiak et al. (2015). Copyright 2015 American Chemical Society.
Figure 8
Figure 8
Putative mechanisms for the neuronal response to locally and globally applied Netrin-1. Axonal and global Netrin-1 treatments differentially regulate membranous and total DCC levels, and the dynamics of second messengers. Arrows indicate the character and strength of the change as measured in our experiments (solid lines) and based on the literature (broken lines). Axonal Netrin-1 increases cAMP level, the frequency of Ca2+ transients and the total and membranous DCC levels in growth cones. cAMP supports Ca2+ efflux from the endoplasmic reticulum (ER); high level of Ca2+ leads to calcium-induced calcium release (CICR). Global Netrin-1 increases total DCC levels, but not membranous DCC levels, cAMP or the frequency of calcium transients. CICR is inhibited. Axonal Netrin-1 slightly affects the axon speed, and severely decreases axon velocity (block arrows). Global Netrin-1 significantly decreases both, axon speed and velocity. Differences in axonal and global Netrin-1 responses suggest that neurons sense Netrin-1 along their entirety and alter their response accordingly; however, the mechanisms of anterograde propagation of Netrin-1-induced signals are unknown.

Similar articles

Cited by

References

    1. Albus C. A., Rishal I., Fainzilber M. (2013). Cell length sensing for neuronal growth control. Trends Cell Biol. 23, 305–310. 10.1016/j.tcb.2013.02.001 - DOI - PubMed
    1. Averaimo S., Nicol X. (2014). Intermingled cAMP, cGMP and calcium spatiotemporal dynamics in developing neuronal circuits. Front. Cell. Neurosci. 8:376. 10.3389/fncel.2014.00376 - DOI - PMC - PubMed
    1. Bartoe J. L., McKenna W. L., Quan T. K., Stafford B. K., Moore J. A., Xia J., et al. . (2006). Protein interacting with C-kinase 1/protein kinase Cα-mediated endocytosis converts netrin-1-mediated repulsion to attraction. J. Neurosci. 26, 3192–3205. 10.1523/JNEUROSCI.3469-05.2006 - DOI - PMC - PubMed
    1. Bin J. M., Han D., Lai Wing Sun K., Croteau L. P., Dumontier E., Cloutier J. F., et al. . (2015). Complete loss of Netrin-1 results in embryonic lethality and severe axon guidance defects without increased neural cell death. Cell Rep. 12, 1099–1106. 10.1016/j.celrep.2015.07.028 - DOI - PubMed
    1. Blasiak A., Lee G. U., Kilinc D. (2015). Neuron subpopulations with different elongation rates and DCC dynamics exhibit distinct responses to isolated Netrin-1 treatment. ACS Chem. Neurosci. 6, 1578–1590. 10.1021/acschemneuro.5b00142 - DOI - PubMed

LinkOut - more resources