. 2017 Jan 5:7:663.
doi: 10.3389/fimmu.2016.00663. eCollection 2016.

Lysosome-Dependent Activation of Human Dendritic Cells by the Vaccine Adjuvant QS-21

Affiliations

Lysosome-Dependent Activation of Human Dendritic Cells by the Vaccine Adjuvant QS-21

Iain Welsby et al. Front Immunol. .

Abstract

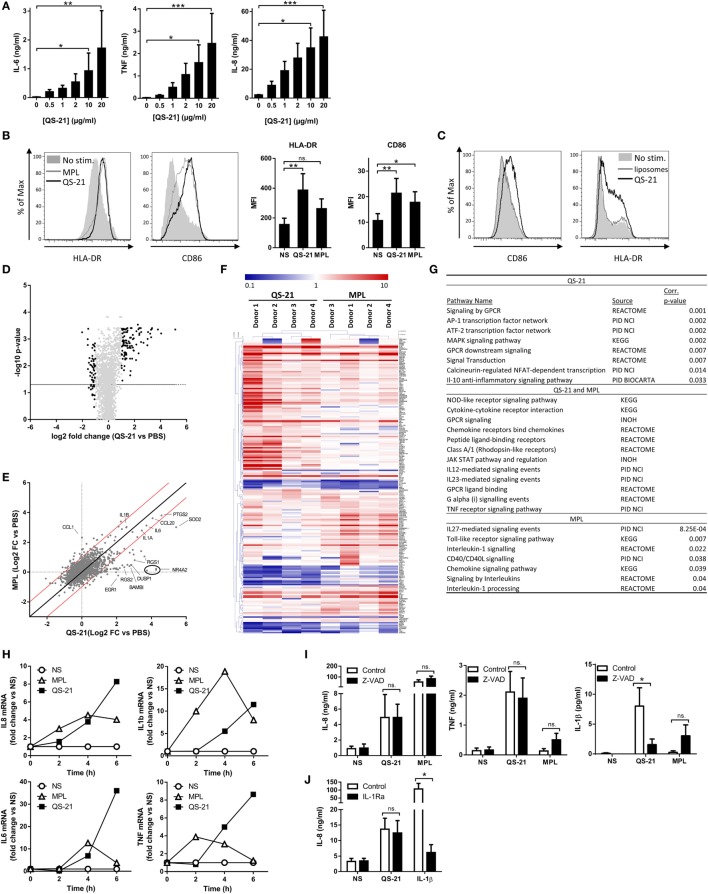
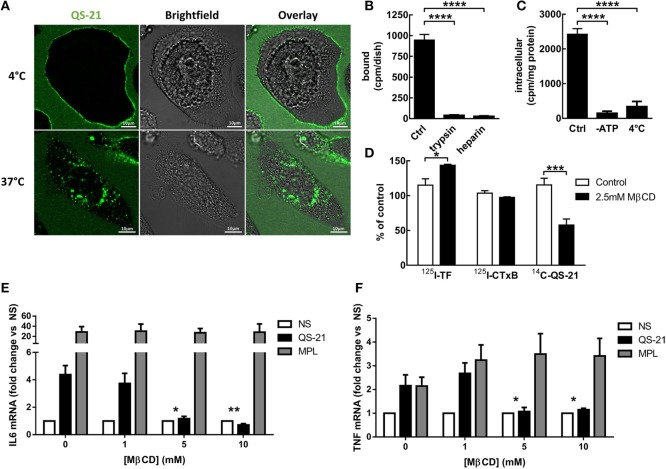
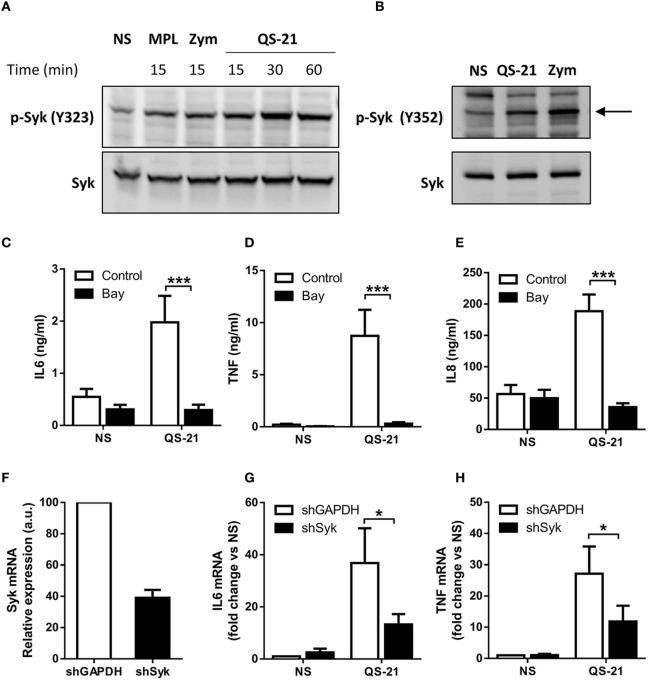
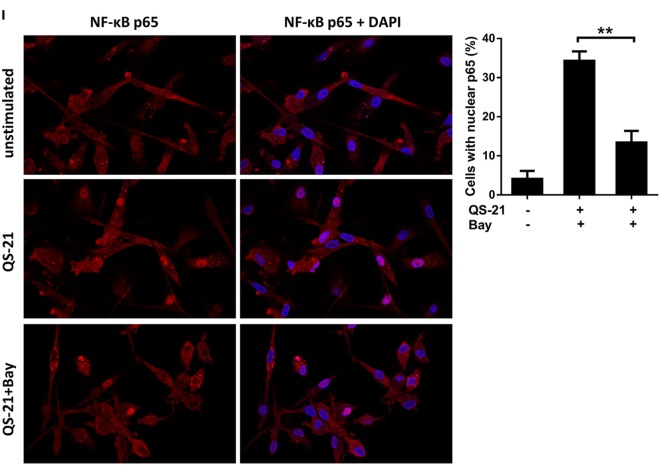
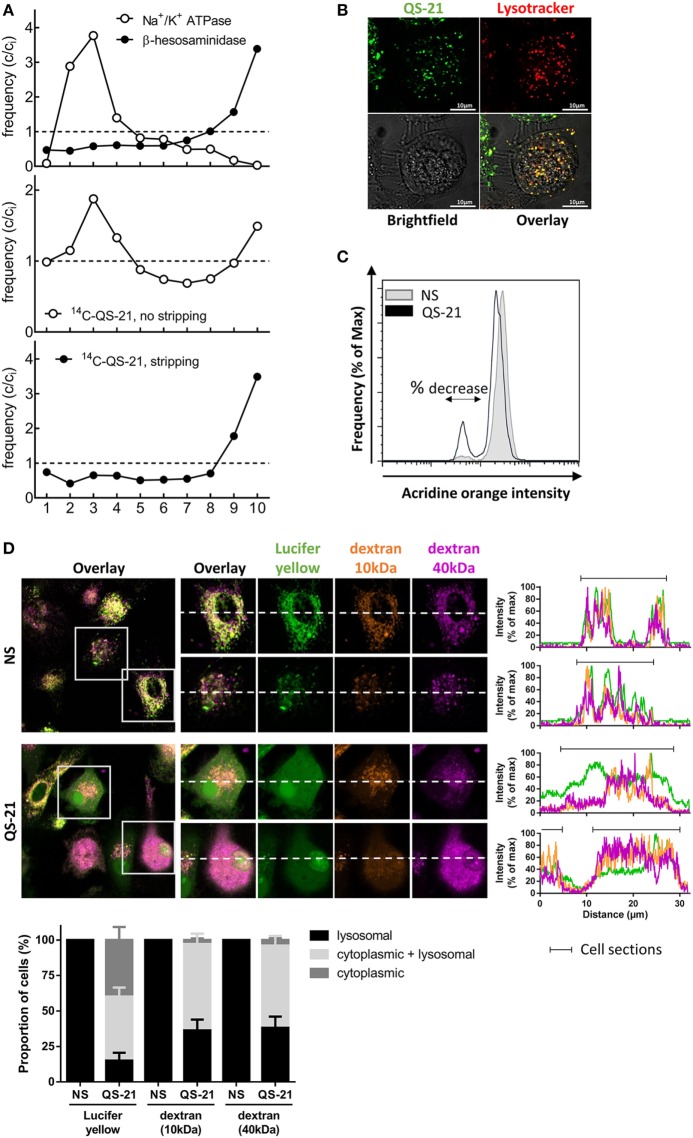
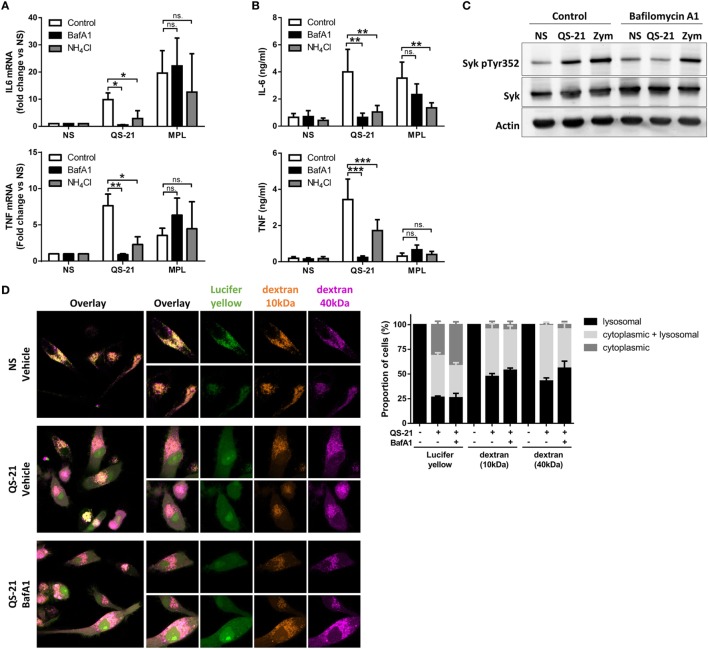
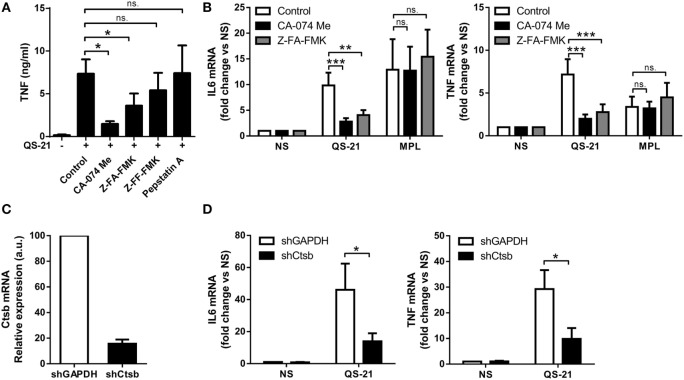
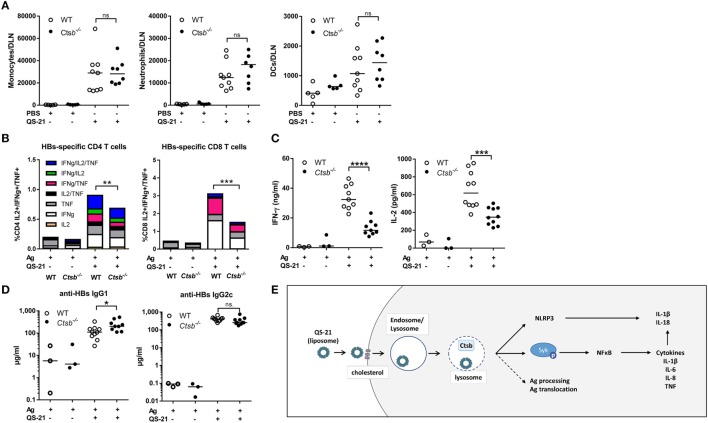
The adjuvant properties of the saponin QS-21 have been known for decades. It is a component of the Adjuvant System AS01 that is used in several vaccine candidates. QS-21 strongly potentiates both cellular and humoral immune responses to purified antigens, yet how it activates immune cells is largely unknown. Here, we report that QS-21 directly activated human monocyte-derived dendritic cells (moDCs) and promoted a pro-inflammatory transcriptional program. Cholesterol-dependent QS-21 endocytosis followed by lysosomal destabilization and Syk kinase activation were prerequisites for this response. Cathepsin B, a lysosomal cysteine protease, was essential for moDC activation in vitro and contributed to the adjuvant effects of QS-21 in vivo. Collectively, these findings provide new insights into the pathways involved in the direct activation of antigen-presenting cells by a clinically relevant QS-21 formulation.

Keywords: adjuvant; cathepsins; cytokine; dendritic cells; lysosome; saponins; vaccine.


Figures

Figure 1
Figure 1
QS-21 directly activates human dendritic cells. (A) moDCs were stimulated with increasing concentrations of QS-21, and IL-6, TNF, and IL-8 were quantified in the culture supernatant after 24 h. Statistical significance was determined by a Friedman test followed by Dunn’s multiple comparisons. The means and SEM from four donors are shown. (B) moDCs were stimulated with QS-21 (10 µg/ml) or MPL (1 µg/ml) for 24 h, and surface marker expression was evaluated by flow cytometry. Representative histograms of HLA-DR and CD86 MFI and bar graphs representing the mean and SEM of cumulative data from eight donors are shown. (C) moDCs were stimulated with QS-21 (10 µg/ml) or liposomes for 24 h and CD86 and HLA-DR expression were evaluated by flow cytometry (D–F) moDCs from four donors were stimulated with QS-21 or MPL for 4 h and gene expression was analyzed by microarray. (D) Volcano plot of microarray data. Each point represents one gene plotted by log2 fold change (FC) vs. medium against −log10 of the p-value (average of four donors). The horizontal bar represents a p-value of 0.05. The light gray points represent genes with FC < 2 and FC > 0.5 and black points represent FC > 2 or FC < 0.5. (E) Scatter plot analysis of microarray data. Log transformed FC vs. medium of QS-21 is plotted against FC vs. medium of MPL (average of four donors). The dotted lines represent FC = 1, the solid black line represents FCQS-21 = FCMPL and the red lines represent a FCQS-21/FCMPL ratio of +2 or −2. (F) Hierarchical clustering and heatmap representation of differentially expressed genes (FC vs. medium >2 or <0.5) for the four donors. The color-coded scale representing fold change vs. medium (blue = downregulated vs. medium, red = upregulated vs. medium) is indicated at the top of the chart. (G) InnateDB analysis of pathway over-representation of significantly upregulated genes (p-value < 0.05 and fold change > 2) for cells stimulated with QS-21 (left) or MPL (right) using the hypergeometric algorithm and Benjamini–Hochberg correction for p-values. (H) moDCs were stimulated with QS-21 (10 µg/ml) or MPL (1 µg/ml) for the indicated durations, and IL-8, IL-1β, IL-6, and TNF transcript abundance was measured by qPCR. Data are from one donor representative of at least three independent experiments. (I) moDCs (n ≥ 5) were treated with Z-VAD-fmk (10 µM) and stimulated with QS-21 (10 µg/ml) or MPL (1 µg/ml), and IL-8, TNF, and IL-1β in the supernatant were measured by ELISA. (J) moDCs (n ≥ 5) were treated with recombinant IL-1 receptor antagonist (Anakinra—10 µg/ml) and stimulated with QS-21 (10 µg/ml) or IL-1β (10 ng/ml) and IL-8 was measured by ELISA. Statistical significance was determined by two-way ANOVA followed by Tukey’s multiple comparisons test.
Figure 2
Figure 2
QS-21 is internalized by cholesterol-dependent endocytosis. (A) Imaging: THP-1 cells were incubated with 10 µg/ml BODIPY-QS-21 for 1 h at either 4°C or 37°C, and fluorescence was visualized by vital confocal microscopy. (B) Surface stripping: THP-1 cells (n = 3) were incubated at 4°C for 1 h with 10 µg/ml 14C-QS-21, then extensively washed (Ctrl) or further stripped at 4°C by trypsin or heparin sulfate. (C) Endocytosis: Control or ATP-depleted THP-1 (n = 3) cells were incubated at 37°C for 4 h with 10 µg/ml 14C-QS-21, then stripped by trypsin as at (B). Parallel cells were incubated at 4°C. Statistical significance was determined by a one-way ANOVA followed by Tukey’s multiple comparisons test. (D) Cholesterol dependence: THP-1 cells (n = 2–3) were cholesterol depleted or not by treatment with 2.5 mM methyl-β-cyclodextrin (MβCD) for 4 h, extensively washed, then incubated with 14C-QS-21 for 1 h or 125I-transferrin or 125I-cholera toxin/B subunit (CTxB) for 15 min, surface-stripped by trypsin and counted. Statistical significance was determined by a two-way ANOVA followed by Sidak’s multiple comparisons test. (E,F) moDCs (n = 8) were treated with the indicated concentration of MβCD for 1 h, extensively washed and stimulated with QS-21 or MPL for 4 h. IL-6 (E) and TNF (F) mRNA abundance was measured by qPCR and normalized to β-actin expression. Statistical significance was determined by a Wilcoxon matched-pairs signed-rank test. The asterisks depict significant differences between 5–10 mM MβCD and 0 mM MβCD for QS-21 stimulated cells.
Figure 3
Figure 3
Syk activation and signaling is indispensable for response to QS-21 in moDCs. (A,B) Immunoblot analysis of cytoplasmic extracts of moDCs stimulated with QS-21, MPL, or Zymosan (Zym) for the indicated durations. Blots were probed sequentially with pY323-SYK (A) or pY352-SYK (B), followed by total Syk. (C–E) moDCs were treated with Bay 61-3606 (10 µM) for 1 h and stimulated with QS-21 (10 µg/ml) for 24 h. IL-6 (C), TNF (D), and IL-8 (E) were quantified in the supernatant by ELISA. Statistical significance was determined by a Wilcoxon matched-pairs signed-rank test. (F–H) moDCs were transduced with lentiviruses coding for shRNAs targeting GAPDH or Syk, and Syk (F), IL-6 (G), and TNF (H) mRNA expression were measured by qPCR and normalized against β-actin expression. Statistical significance was determined by a Wilcoxon matched-pairs signed-rank test. (I) moDCs were seeded on coverslips, treated with Bay 61-3606 (10 µM) for 1 h and stimulated with 10 µg/ml QS-21 for 2 h. NF-κB p65 was visualized by immunofluorescence and nuclear p65 was quantified using ImageJ software. Data are representative of three experiments. Statistical significance was determined with a non-parametric Mann–Whitney t-test.
Figure 3
Figure 3
Syk activation and signaling is indispensable for response to QS-21 in moDCs. (A,B) Immunoblot analysis of cytoplasmic extracts of moDCs stimulated with QS-21, MPL, or Zymosan (Zym) for the indicated durations. Blots were probed sequentially with pY323-SYK (A) or pY352-SYK (B), followed by total Syk. (C–E) moDCs were treated with Bay 61-3606 (10 µM) for 1 h and stimulated with QS-21 (10 µg/ml) for 24 h. IL-6 (C), TNF (D), and IL-8 (E) were quantified in the supernatant by ELISA. Statistical significance was determined by a Wilcoxon matched-pairs signed-rank test. (F–H) moDCs were transduced with lentiviruses coding for shRNAs targeting GAPDH or Syk, and Syk (F), IL-6 (G), and TNF (H) mRNA expression were measured by qPCR and normalized against β-actin expression. Statistical significance was determined by a Wilcoxon matched-pairs signed-rank test. (I) moDCs were seeded on coverslips, treated with Bay 61-3606 (10 µM) for 1 h and stimulated with 10 µg/ml QS-21 for 2 h. NF-κB p65 was visualized by immunofluorescence and nuclear p65 was quantified using ImageJ software. Data are representative of three experiments. Statistical significance was determined with a non-parametric Mann–Whitney t-test.
Figure 4
Figure 4
QS-21 accumulates in lysosomes and promotes their destabilization. (A) Differentiated THP-1 cells were pulsed with 14C-QS-21 for 4 h followed by an overnight chase, and postnuclear particles were resolved by density gradients fractionation. Na+/K+-ATPase identifies the plasma membrane and N-acetyl-β-hexosaminidase activity identifies lysosomes. The abscissa axis represents the different fractions. The ordinate reflects enrichment (C/Ci > 1) or depletion (C/Ci < 1) vs. initial abundance (Ci = 1), indicated by dotted lines. (B) Differentiated THP-1 cells were co-incubated with BODIPY-QS-21 and Lysotracker Red then analyzed by vital confocal microscopy. (C) moDCs were incubated with 1 µg/ml acridine orange (AO), washed, and stimulated for 2 h with QS-21 (10 µg/ml). AO fluorescence was quantified by flow cytometry and a 610 nm filter. Cells with decreased AO fluorescence are indicated with the double arrow. One representative donor of 3 is shown. (D) moDCs were incubated with Lucifer Yellow, 10 kDa dextran-Alexa633 and 40 kDa dextran-Texas Red for 16 h then stimulated for QS-21 for 4 h. The localization of fluorescent markers was observed by confocal microscopy. The proportion of cells with punctate (lysosomal), diffuse (cytoplasmic) or both (punctate + diffuse) signal for the different fluorescent markers was determined with ImageJ. The data are representative of four donors.
Figure 5
Figure 5
QS-21-mediated dendritic cell activation and Syk phosphorylation depend on lysosomal maturation. (A,B) moDCs were treated with bafilomycin A1 (BafA1—250 nM) or NH4Cl (10 mM) for 1 h and stimulated with QS-21 (10 µg/ml) or MPL (1 µg/ml) for 4 h (A) or 24 h (B). TNF and IL-6 mRNA (A) and protein (B) were quantified by qPCR (n = 8) and ELISA (n = 11), respectively. Statistical significance was determined by two-way ANOVA followed by Tukey’s multiple comparisons test. (C) moDCs were treated with BafA1 for 1 h and stimulated with QS-21 (10 µg/ml) or zymosan as a positive control (Zym—50 µg/ml) for 2 h. Phospho-Syk (Y352), Syk, and β-actin were detected by sequential western blotting. One representative donor of 2 is shown. (D) moDCs were incubated with Lucifer Yellow, 10 kDa dextran-Alexa633, and 40 kDa dextran-Texas Red for 16 h then pretreated with BafA1 or DMSO (vehicle) and stimulated with QS-21 for 4 h. The localization of fluorescent markers was observed by confocal microscopy. The proportion of cells with punctate (lysosomal), diffuse (cytoplasmic), or both (punctate + diffuse) signals for the different fluorescent markers was determined with ImageJ. The data are representative of two donors.
Figure 6
Figure 6
Cathepsin B activity is required for an optimal response to QS-21. (A) moDCs were incubated with CA-074 Me (cathepsin B inhibitor), Z-FA-FMK (cathepsin B inhibitor), Z-FF-FMK (cathepsin B/L inhibitor), or pepstatin A (cathepsin D, cathepsin E, and pepsin inhibitor) for 1 h and stimulated with QS-21 for 24 h. TNF release into the supernatant was measured by ELISA. Statistical significance was determined with a Friedman test followed by Dunn’s multiple comparison test. (B) moDCs were pretreated with CA-074 Me or Z-FA-FMK for 1 h and stimulated with QS-21 or MPL for 6 h. IL-6 and TNF mRNA levels were quantified by qPCR and normalized to β-actin mRNA levels. Statistical significance was determined by two-way ANOVA followed by Tukey’s multiple comparisons test. (C,D) moDCs were transduced with lentiviruses coding for shRNAs targeting GAPDH (shGAPDH) or cathepsin B (shCtsb), and cathepsin B (C), IL-6 and TNF (D) mRNA expression were measured by qPCR and normalized against β-actin expression. Statistical significance was determined by a Wilcoxon matched-pairs signed-rank test.
Figure 7
Figure 7
QS-21 elicited antigen-specific CD4 and CD8 T cell responses are dependent on cathepsin B. (A) Monocyte (CD11b+ Ly6C+ Ly6G), neutrophil (CD11b+ Ly6Cint Ly6G+), and dendritic cell (CD11chi MHCIIhi) recruitment to the draining lymph node 24 h post intramuscular immunization with PBS or QS-21 assessed by flow cytometry. (B) WT and cathepsin B (Ctsb)-invalidated mice were immunized at day 0 and day 14 with hepatitis B surface (HBs) antigens or with HBs antigens adjuvanted with QS-21. At day 21, median cytokine production of HBsAg-specific splenic CD4 and CD8 T cells were evaluated by intracellular staining following ex vivo restimulation with antigenic peptides (Ag: n = 6, QS-21: n = 20). (C) IFN-γ and IL-2 production by HBs-specific spleen cells were measured by ELISA following restimulation with HBs peptides (Ag: n = 3, QS-21: n = 10). (D) Anti-HBs IgG1 and IgG2c titers in the serum at day 21 were measured by ELISA (Ag: n = 6, QS-21: n = 26). Each dot represents one mouse, and the horizontal bar represents the geometric mean. Statistical significance was determined by a non-parametric Mann–Whitney t-test. The data represent the pooled results of two independent experiments. (E) Proposed model: QS-21 is endocytosis via a cholesterol-dependent mechanism. It then traffics to lysosomes and induces their destabilization. This can induce inflammasome activation and Syk- and cathepsin B-dependent cell activation and cytokine production in moDCs. Lysosomal destabilization could also affect antigen processing and antigen translocation to the cytosol.

References

    1. Campbell JB, Peerbaye YA. Saponin. Res Immunol (1992) 143:526–30.10.1016/0923-2494(92)80064-R - DOI - PubMed
    1. Kensil CR, Patel U, Lennick M, Marciani D. Separation and characterization of saponins with adjuvant activity from Quillaja saponaria Molina cortex. J Immunol (1991) 146:431–7. - PubMed
    1. Kensil CR. Saponins as vaccine adjuvants. Crit Rev Ther Drug Carrier Syst (1996) 13:1–55. - PubMed
    1. Kensil CR, Wu JY, Soltysik S. Structural and immunological characterization of the vaccine adjuvant QS-21. Pharm Biotechnol (1995) 6:525–41.10.1007/978-1-4615-1823-5_22 - DOI - PubMed
    1. Newman MJ, Wu JY, Gardner BH, Munroe KJ, Leombruno D, Recchia J, et al. Saponin adjuvant induction of ovalbumin-specific CD8+ cytotoxic T lymphocyte responses. J Immunol (1992) 148:2357–62. - PubMed

LinkOut - more resources