. 2017 Jan 5:7:2012.
doi: 10.3389/fpls.2016.02012. eCollection 2016.

Transcriptome Analysis of the Cf-12-Mediated Resistance Response to Cladosporium fulvum in Tomato

Affiliations

Transcriptome Analysis of the Cf-12-Mediated Resistance Response to Cladosporium fulvum in Tomato

Dong-Qi Xue et al. Front Plant Sci. .

Abstract

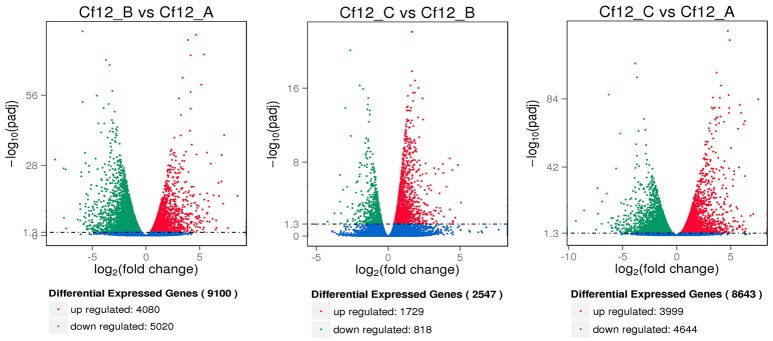
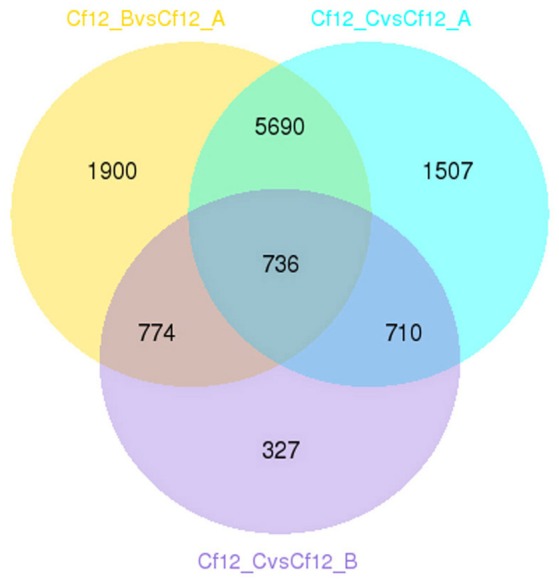
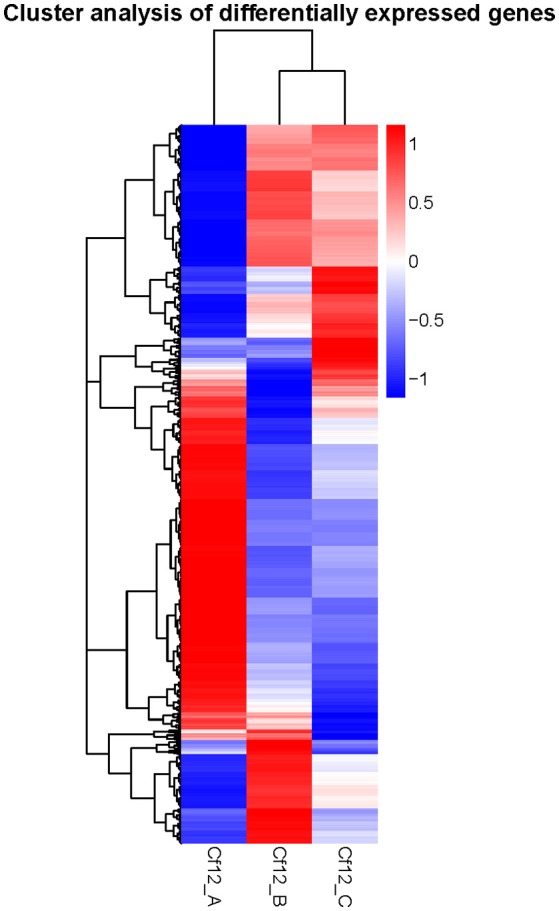
Cf-12 is an effective gene for resisting tomato leaf mold disease caused by Cladosporium fulvum (C. fulvum). Unlike many other Cf genes such as Cf-2, Cf-4, Cf-5, and Cf-9, no physiological races of C. fulvum that are virulent to Cf-12 carrying plant lines have been identified. In order to better understand the molecular mechanism of Cf-12 gene resistance response, RNA-Seq was used to analyze the transcriptome changes at three different stages of C. fulvum infection (0, 4, and 8 days post infection [dpi]). A total of 9100 differentially expressed genes (DEGs) between 4 and 0 dpi, 8643 DEGs between 8 and 0 dpi and 2547 DEGs between 8 and 4 dpi were identified. In addition, we found that 736 DEGs shared among the above three groups, suggesting the presence of a common core of DEGs in response to C. fulvum infection. These DEGs were significantly enriched in defense-signaling pathways such as the calcium dependent protein kinases pathway and the jasmonic acid signaling pathway. Additionally, we found that many transcription factor genes were among the DEGs, indicating that transcription factors play an important role in C. fulvum defense response. Our study provides new insight on the molecular mechanism of Cf resistance to C. fulvum, especially the unique features of Cf-12 in responding to C. fulvum infection.

Keywords: Cf-12 tomato; Cladosporium fulvum; RNA-Seq; differentially expressed genes; resistance response.


Figures

Figure 1
Figure 1
Lactophenol trypan blue stained-tomato leaf samples after inoculation with C. fulvum. (A) Morphology of Cladosporium fulvum mycelium and spores; (B) conidiospores germinates (2 or 3 dpi); (C,D) the hypha penetrates into the stomata of the Moneymaker (C) and Cf-2 tomato (D) (4 dpi); (E) the hyphae emerges through the stomata of the Moneymaker cultivar (8 dpi); (F) the hyphae increases and plugs the stomata on the Moneymaker cultivar (10 dpi); (G) cells surrounding the stoma had necrosis lesions on Cf-12 tomato (8 dpi); (H–J) a large number of necrotic spots appeared and the necrosis area increased on Cf-12 tomato (10–15 dpi); (K) thick gray-white mold layer on the abaxial surface of the infected leaf on the Moneymaker cultivar (15 dpi); (L) yellow necrotic spots on Cf-12 tomato. s, spore; gt, germ tube; hy, hypha; p, penetration of the stomata by the hypha; ec, plant epidermal cell walls; v, host vascular tissue; st, stomata; nl, necrotic lesion.
Figure 2
Figure 2
Volcano plot showing differentially expressed genes between different libraries. Padj < 0.05 was used as the threshold to judge the significance of the difference in gene expression. Red plots represent upregulated genes; green plots represent downregulated genes; blue plots represent genes with no significant difference.
Figure 3
Figure 3
Venn diagram of the relationship between DEG groups. The numbers indicate the DEG number in each DEG group shown in Table S5.
Figure 4
Figure 4
Hierarchical clustering of DEGs. The blue bands indicate low gene expression quantity, and the red bands represent high gene expression quantity.
Figure 5
Figure 5
The clustering of DEGs expression patterns. The six expression patterns of DEGs obtained by K-means clustering algorithm is shown, which are represented as upregulated (subcluster_4 and subcluster_5), transient (subcluster_3), and downregulated (subcluster_1, subcluster_2, and subcluster_6). Expression ratios are expressed as Log2.
Figure 6
Figure 6
Correlation of expression levels between RNA-Seq and qRT-PCR.
Figure 7
Figure 7
Scatter plot of the KEGG pathway enrichment of DEGs. Rich factor is the ratio of the DEG number to the background number in a certain pathway. The size of the dots represents the number of genes, and the color of the dots represents the range of the q-value.

References

    1. Anders S., Huber W. (2010). Differential expression analysis for sequence count data. Genome Biol. 11:R106. 10.1186/gb-2010-11-10-r106 - DOI - PMC - PubMed
    1. Bai B., Wu J., Sheng W. T., Zhou B., Zhou L. J., Zhuang W., et al. . (2015). Comparative analysis of anther transcriptome profiles of two different rice male sterile lines genotypes under cold stress. Int. J. Mol. Sci. 16, 11398–11416. 10.3390/ijms160511398 - DOI - PMC - PubMed
    1. Benjamini Y., Hochberg Y. (1995). Controlling the false discovery rate - a practical and powerful approach to multiple testing. J. R. Stat. Soc. 57, 289–300.
    1. Brading P. A., Hammond-Kosack K. E., Parr A., Jones J. D. (2000). Salicylic acid is not required for Cf-2 - and Cf-9 -dependent resistance of tomato to Cladosporium fulvum. Plant J. Cell Mol. Biol. 23, 305–318. 10.1046/j.1365-313x.2000.00778.x - DOI - PubMed
    1. Butler E. J., Jones S. G. (1949). Tomato Leaf Mould, Cladosporium fulvum Cooke. London: Macmillan.

LinkOut - more resources