

doi: 10.1021/acs.analchem.6b04278.
Epub 2016 Nov 22.
Analytical Techniques in Neuroscience: Recent Advances in Imaging, Separation, and Electrochemical Methods
Affiliations
- PMID: 28105819
- PMCID: PMC5260807
- DOI: 10.1021/acs.analchem.6b04278
Item in Clipboard
Analytical Techniques in Neuroscience: Recent Advances in Imaging, Separation, and Electrochemical Methods
Anal Chem.
.
No abstract available
Figures
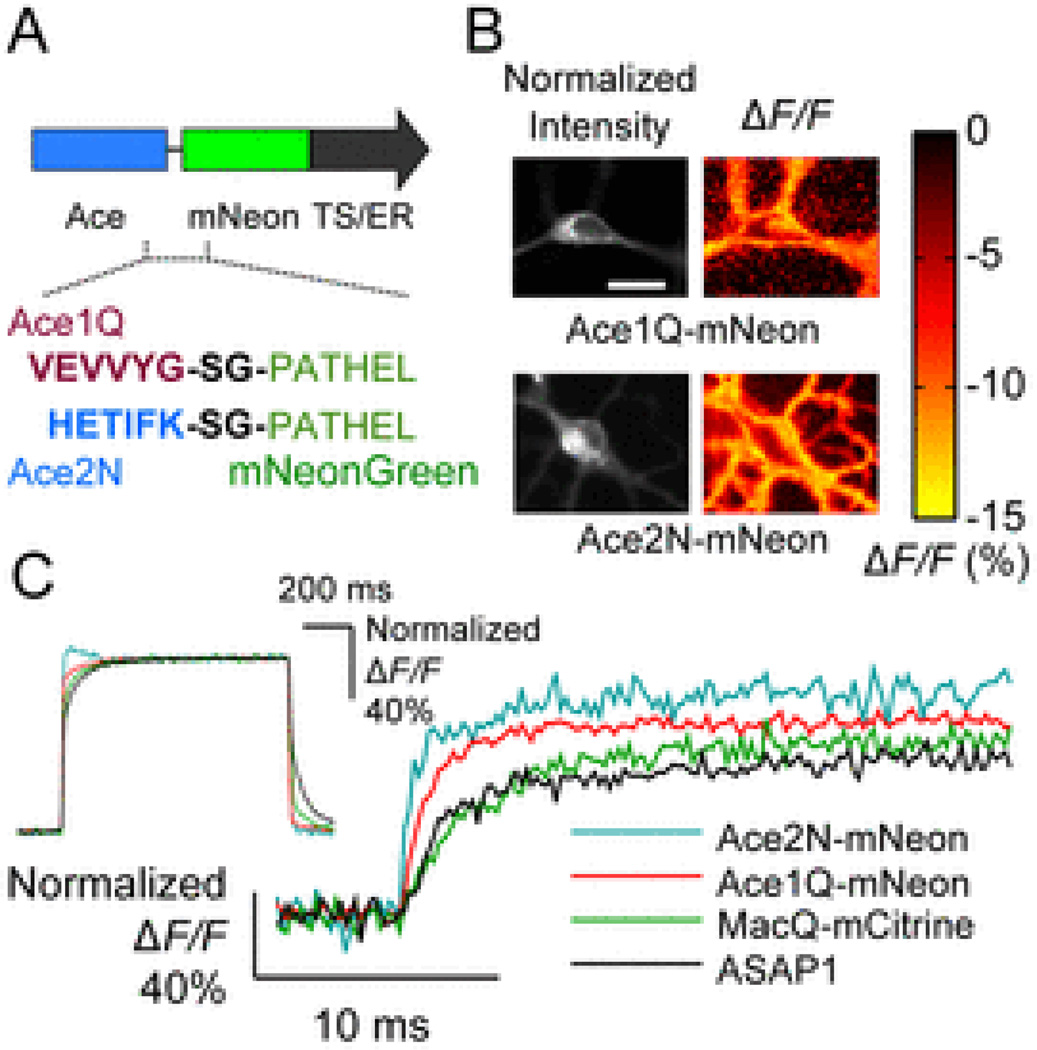
Ace FRET-opsin sensors report membrane voltage with ~1 millsecond response times. (A) Linker sequences bridging Ace mutants (Ace1Q and Ace2N) to mNeonGreen. Endoplasmic reticulum (ER) export sequence and Golgi export trafficking signal (TS) at the construct’s C terminus improves the sensor’s membrane localization and hence the signaling dynamic range. (B) Fluorescence signals from neurons expressing Ace1Q-mNeon or Ace2N-mNeon. (Left) Baseline fluorescence emissions from mNeonGreen. (Right) Spatial maps of the fluorescence response (ΔF/F) to a voltage step of approximately 100 mV. Areas of fluorescence and voltage response were generally co-localized. Scale bar: 20 µm. Illumination intensity: 15 mW·mm−2. (C) Step responses of the Ace sensors, ASAP1 and MacQ-mCitrine in cultured HEK293T cells to +100 mV command voltage steps, normalized to each sensor’s maximum (or steady state) ΔF/F response to the command voltage. Ace1Q-mNeon and Ace2N-mNeon sensor responded ~ 5-6-fold faster than that of ASAP1 and MacQ-mCitrine. Illumination intensity: 15–50 mW mm−2. Image frame acquisition rate: 5 kHz. Inset traces were down-sampled to 250 Hz. Reprinted with permission from Gong, Y.; Huang, C.; Li, J. Z.; Grewe, B. F.; Zhang, Y.; Eismann, S.; Schnitzer, M. J. Science 2015, 350 (6266), 1361–1366 (ref 9). Copyright 2015, American Association for the Advancement of Science.
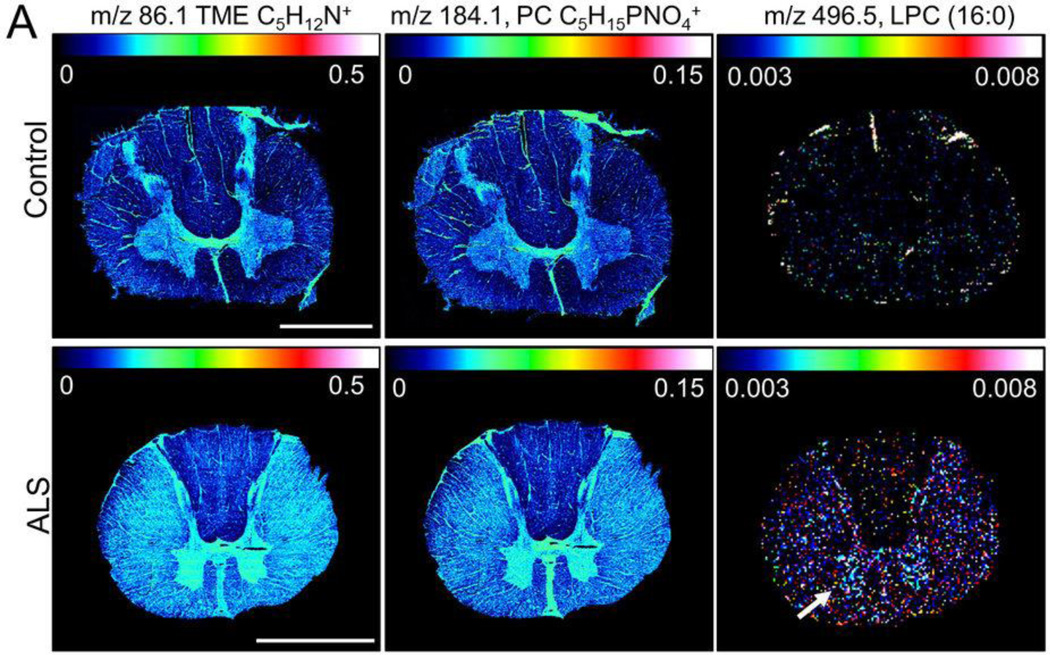
Single ion images of chemical species elevated in amyotrophic lateral sclerosis spinal cord. Multivariate statistics of regions of interest spectral data using two different multivariate approaches, statistical analysis of microarray data and partial least square discriminant analysis, resulted in detection of Lysophosphatidylcholine as well as its fragments, phosphatidylcholine -headgroup and trimethylethylimine, displaying amyotrophic lateral sclerosis associated increase in the grey matter. Scale bar = 4 mm. Reprinted with permission from Macmillan Publisher Ltd: Spatial Elucidation of Spinal Cord Lipid- and Metabolite- Regulations in Amyotrophic Lateral Sclerosis (ref 63). Copyright 2014.
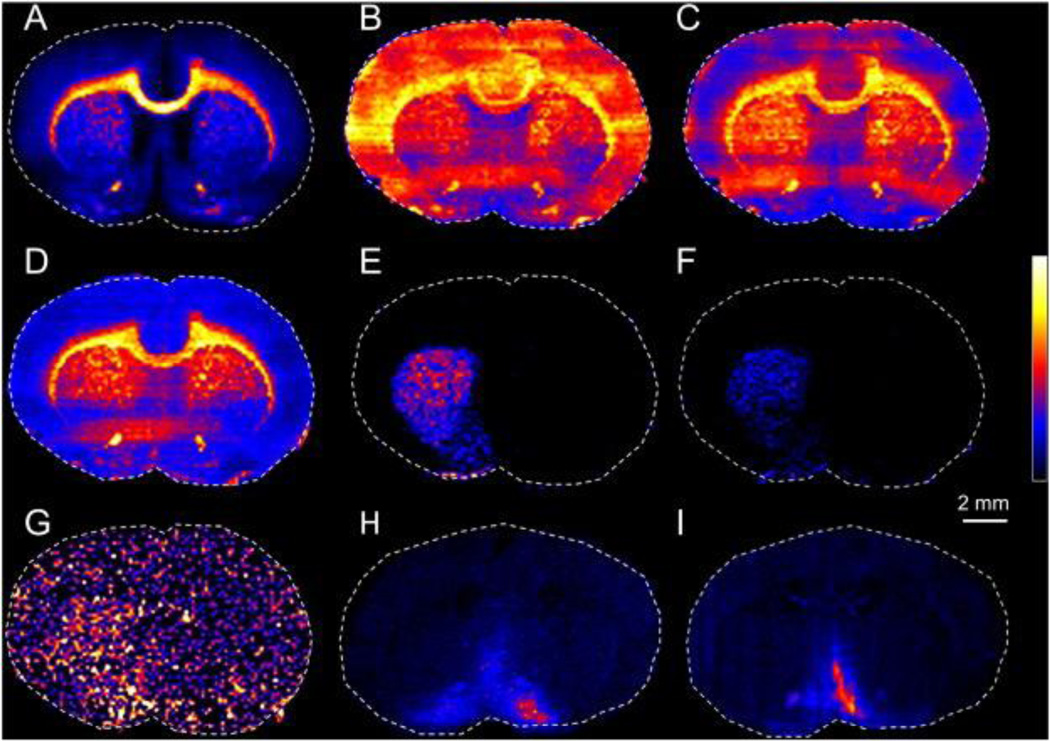
DESI-MS images of neurotransmitters in coronal rat brain tissue sections. DESI MSI ion intensity maps of (A) adenosine m/z 302.0667, (B) aspartate m/z 132.0304, (C) glutamate m/z 146.0461, (D) glutamine m/z 145.0621, (E) DA m/z 152.0719, (F) D3-DA m/z 155.0908, and (G) DOPAC m/z 167.0352 acquired in negative ionization mode. (H) The GABA molecular ion image m/z 104.0709 and (I) GABA MS/MS product ion image (m/z 87.0445) were acquired in positive ionization mode. Scale bar: 2 mm; spatial resolutions: (A–G, I) 150 µm and (H) 110 µm. Reprinted with permission from Neuroimage, 136, Shariatgorji, M.; Strittmatter, N.; Nilsson, A.; Källback, P.; Alvarsson, A.; Zhang, X.; Vallianatou, T.; Svenningsson, P.; Goodwin, R. J. A.; Andren, P. E., Simultaneous imaging of multiple neurotransmitters and neuroactive substances in the brain by desorption electrospray ionization mass spectrometry, 129–138 (ref 66). Copyright 2016, with permission from Elsevier.
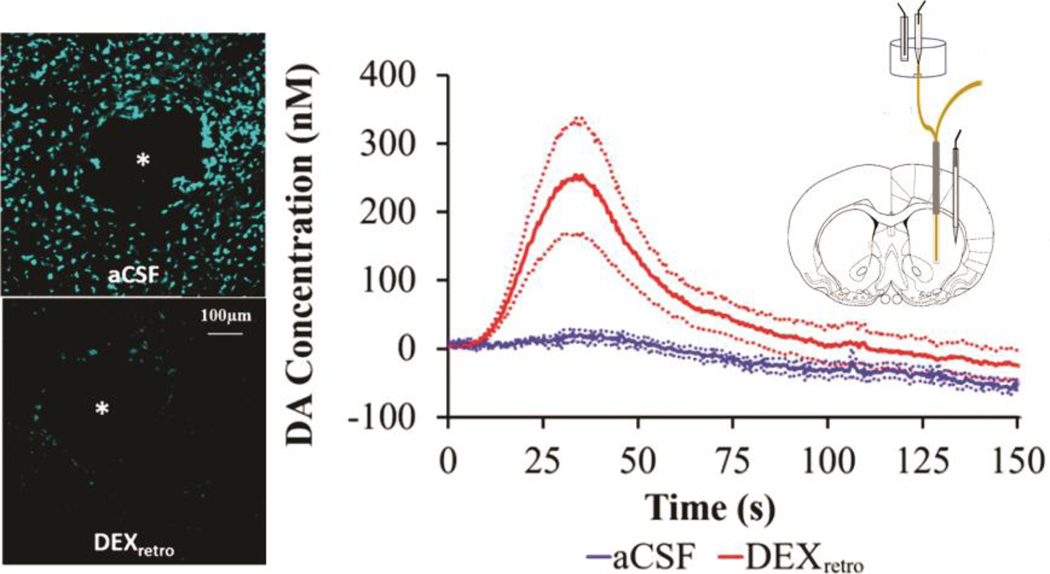
Administering dexamethasone via retrodialysis diminishes the damage caused by probe implantation. (Left) Immunoreactivity for ED-1 in sections containing the tracks of probes without (top) or with dexamethasone (bottom). (Right) Evoked DA responses (mean ± SEM, n = 6 per group) recorded at the outlet of microdialysis probes 5 days after implantation. Without dexamethasone (blue) the stimulus evoked no response. With dexamethasone (red), the stimulus evoked clear and reproducible responses. Adapted with permission from Varner, E. L.; Jaquins-Gerstl, A.; Michael, A. C. ACS Chem. Neurosci. 2016, 7 (6), 728–736 (ref 79). Copyright 2016, American Chemical Society.
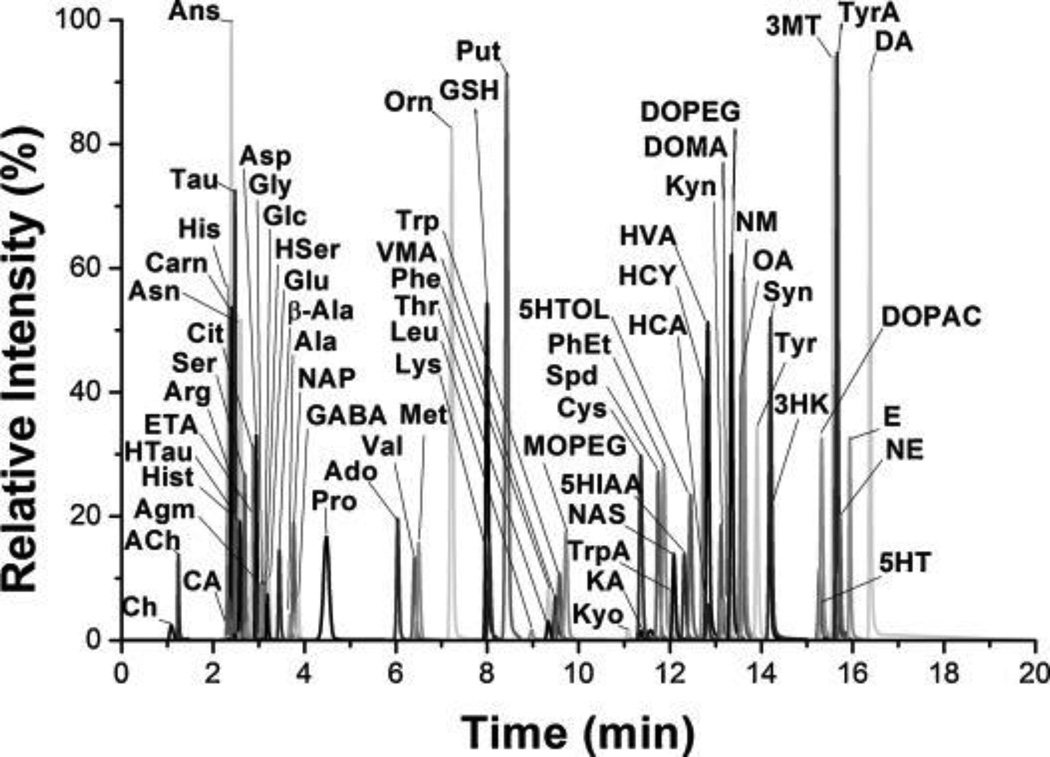
Reconstructed ion chromatogram of 70 compounds detected in 20 min. Extracted ion chromatograms for each compound at the highest concentration calibration standard run, were normalized to highest intensity and overlaid. Reprinted from Journal of Chromatography A, 1446, Wong, J.-M.T.; Malec, P. A.; Mabrouk,; O.S. Ro, J.; Dus, M.; Kennedy, R.T. Benzoyl chloride derivatization with liquid chromatography-mass spectrometry for targeted metabolomics of neurochemicals in biological samples, pages 78–90 (ref 99). Copyright 2016,with permission from Elsevier
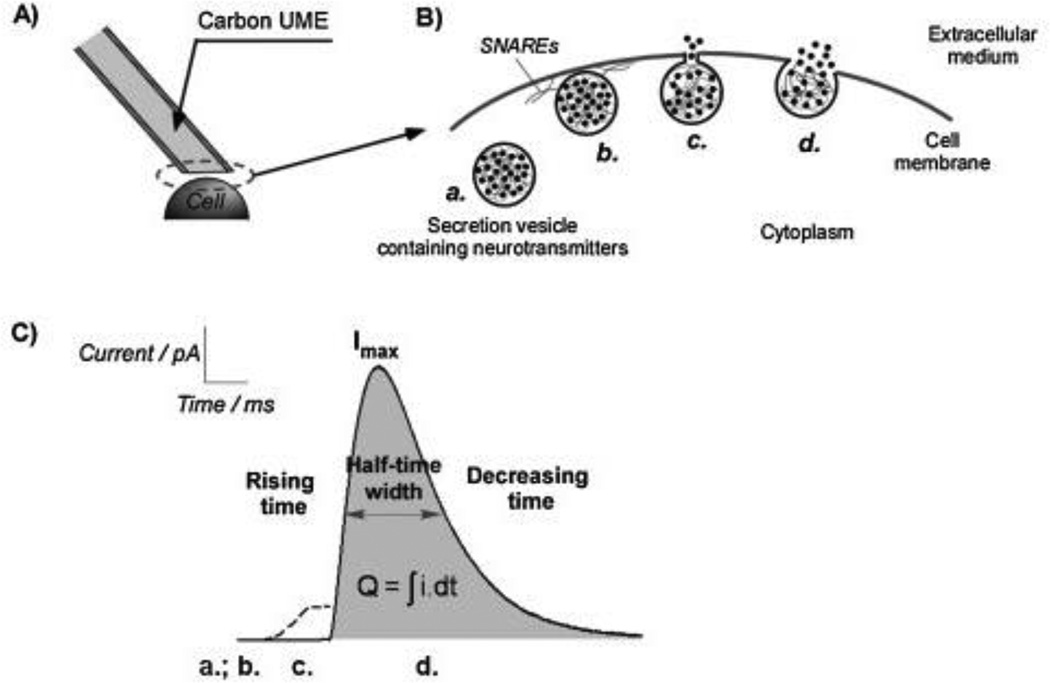
A) Scheme of the “artificial synapse” configuration. An ultramicroelectrode is positioned in the close vicinity of the emitting cell. If the species released can be oxidized (or reduced) at the electrode surface, amperometry at constant potential allows one to detect a variation of current that features the release in real time. B) Main steps of vesicular exocytosis: after an appropriate stimulation, available vesicles located into the cytoplasm (a.) dock to the cell membrane by the mean of SNAREs assemblies (b.). The subsequent mixing between cell and vesicular membranes induces the formation of a nanometric fusion pore (c.) which can expand and leads to a massive release (d.). C) Typical current spike (correlated to the some steps of exocytosis) recorded by amperometry at a carbon fiber ultramicroelectrode in the “artificial synapse” configuration. The usual extracted parameters (durations, area) are used to decipher the mechanism and its dynamics. Reprinted from Journal of Electrochimica Acta, 140, Frédéric Lemaître, Manon Guille Collignon, Christian Amatore. Recent advances in Electrochemical Detection of Exocytosis, pages 457–466 (ref 142). Copyright 2014, with permission from Elsevier.
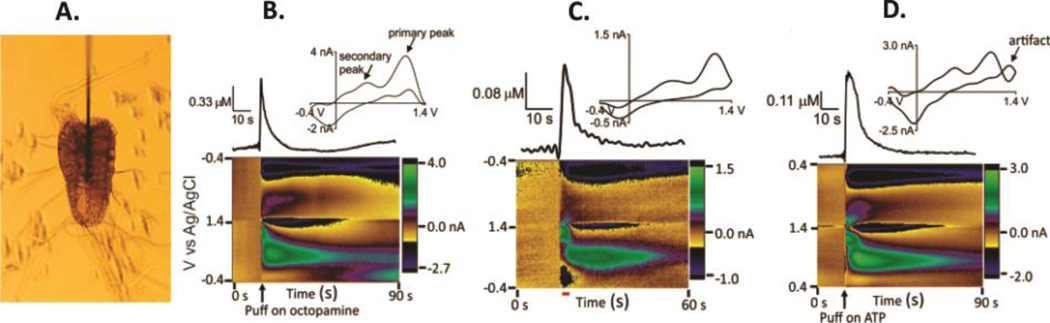
(A) 7 µm carbon fiber microelectrode inserted into the neuropil of an isolated ventral nerve cord for octopamine measurements. Comparison of puffed-on octopamine and different stimulations. Cyclic voltammograms (top), concentration vs time (center), and color plots (bottom) for (B) octopamine puffed into a larval ventral nerve cord, (C) CsChrimson (red light, 2 s) mediated release, and (D) P2X2 (0.5 pmol of ATP) mediated release in larval ventral nerve cord. All show similar peak characteristics with the primary peak around 1.1 V and secondary peak around 0.5 V with the slower scan waveform. Panels B-D Reproduced from Poojan Pyakurel,; Eve Privman Champaloux,; B. Jill Venton, ACS Chem. Neurosci., 2016, 7 (8), 1112–1119 (ref 193). Copyright 2016, American Chemical Society.
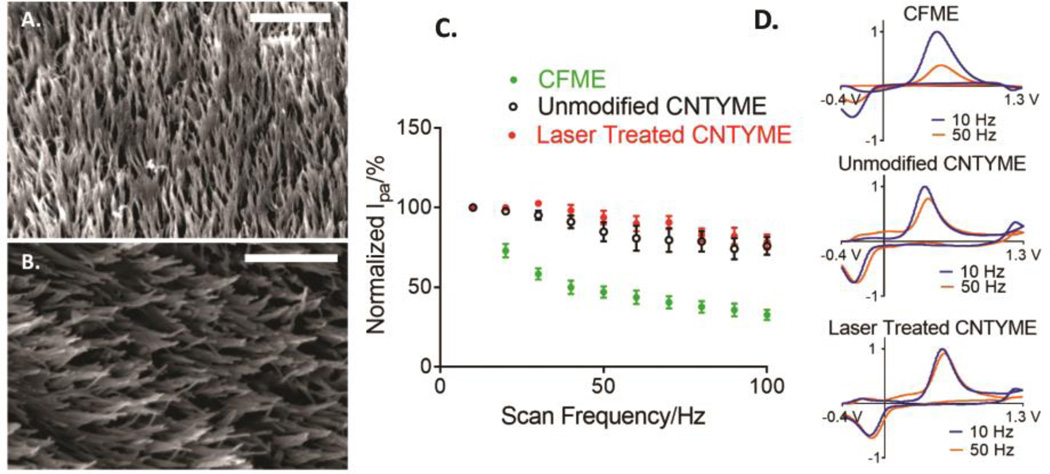
SEM images of (A) unmodified CNTYME and (B) laser treated CNTYME. Scale bar: 500 nm. Effect of scan repetition frequency for 1 µM dopamine detection at CFMEs, unmodified and laser treated CNTYMEs: (C) Peak oxidation current at CFMEs (green dot, n = 5), unmodified CNTYMEs (black dot, n = 5), and laser treated CNTYMEs (red dot, n = 5) with −0.4 to 1.3 V waveform and scan rate of 400 V/s. Peak currents were normalized to the current at 10 Hz, and error bars represent the standard error of the mean. (D) Example normalized CVs of 1 µM dopamine bolus injection at unmodified CNTYME, laser treated CNTYME, and a CFME at 10 Hz (blue line) and 50 Hz (orange line) scan repetition frequency. CVs are normalized to the 10 Hz signal. Reproduced from Cheng Yang,; Elefterios Trikantzopoulos,; Michael D. Nguyen,; Christopher B. Jacobs,; Ying Wang,; Masoud Mahjouri-Samani,; Ilia N. Ivanov,; B. Jill Venton, ACS Sens., 2016, 1 (5), pp 508–515 (ref 216). Copyright 2016, American Chemical Society.
Similar articles
-
Recent advances in microparticle continuous separation.IET Nanobiotechnol. 2008 Mar;2(1):1-13. doi: 10.1049/iet-nbt:20070025. IET Nanobiotechnol. 2008. PMID: 18298195 Review.
-
Neuroscience goes on a chip.Biosens Bioelectron. 2012 May 15;35(1):1-13. doi: 10.1016/j.bios.2012.02.012. Epub 2012 Feb 14. Biosens Bioelectron. 2012. PMID: 22387040 Review.
-
Integrated electrochemical DNA biosensors for lab-on-a-chip devices.Electrophoresis. 2009 Oct;30(19):3386-97. doi: 10.1002/elps.200900319. Electrophoresis. 2009. PMID: 19802851 Review.
-
Extraction, Enrichment, and in situ Electrochemical Detection on Lab-on-a-Disc: Monitoring the Production of a Bacterial Secondary Metabolite.ACS Sens. 2019 Feb 22;4(2):398-405. doi: 10.1021/acssensors.8b01277. Epub 2018 Dec 21. ACS Sens. 2019. PMID: 30525464
-
Stem cell transplantation in neuroscience: the role of molecular imaging.Stem Cell Rev Rep. 2012 Dec;8(4):1265-6. doi: 10.1007/s12015-012-9389-0. Stem Cell Rev Rep. 2012. PMID: 22661144 Review. No abstract available.
Cited by
-
Improving serotonin fast-scan cyclic voltammetry detection: new waveforms to reduce electrode fouling.Analyst. 2020 Nov 9;145(22):7437-7446. doi: 10.1039/d0an01406k. Analyst. 2020. PMID: 32955048 Free PMC article.
-
Design and Evaluation of a Lactate Microbiosensor: Toward Multianalyte Monitoring of Neurometabolic Markers In Vivo in the Brain.Molecules. 2022 Jan 14;27(2):514. doi: 10.3390/molecules27020514. Molecules. 2022. PMID: 35056837 Free PMC article.
-
Ultrafast neuronal imaging of dopamine dynamics with designed genetically encoded sensors.Science. 2018 Jun 29;360(6396):eaat4422. doi: 10.1126/science.aat4422. Epub 2018 May 31. Science. 2018. PMID: 29853555 Free PMC article.
-
Thin layer cell behavior of CNT yarn and cavity carbon nanopipette electrodes: Effect on catecholamine detection.Electrochim Acta. 2020 Nov 20;361:137032. doi: 10.1016/j.electacta.2020.137032. Epub 2020 Sep 5. Electrochim Acta. 2020. PMID: 32981947 Free PMC article.
-
Nanodiamond Coating Improves the Sensitivity and Antifouling Properties of Carbon Fiber Microelectrodes.ACS Sens. 2019 Sep 27;4(9):2403-2411. doi: 10.1021/acssensors.9b00994. Epub 2019 Aug 21. ACS Sens. 2019. PMID: 31387349 Free PMC article.
References
-
- Valentine ES. The War of the Soups and the Sparks: The Discovery of Neurotransmitters and the Dispute Over How Nerves Communicate. New York: Columbia University Press; 2006.
-
- Mao L. Anal. Chem. 2017
-
- Inoue M, Takeuchi A, Horigane S, Ohkura M, Gengyo-Ando K, Fujii H, Kamijo S, Takemoto-Kimura S, Kano M, Nakai J, Kitamura K, Bito H. Nat. Methods. 2015;12(1):64–70. - PubMed
Publication types
MeSH terms
Grants and funding
LinkOut - more resources
Full Text Sources
Other Literature Sources
