

Review
doi: 10.1021/acs.analchem.6b04260.
Epub 2016 Nov 18.
Nanopore Sensing
Affiliations
- PMID: 28105845
- PMCID: PMC5316487
- DOI: 10.1021/acs.analchem.6b04260
Item in Clipboard
Review
Nanopore Sensing
Anal Chem.
.
No abstract available
Figures
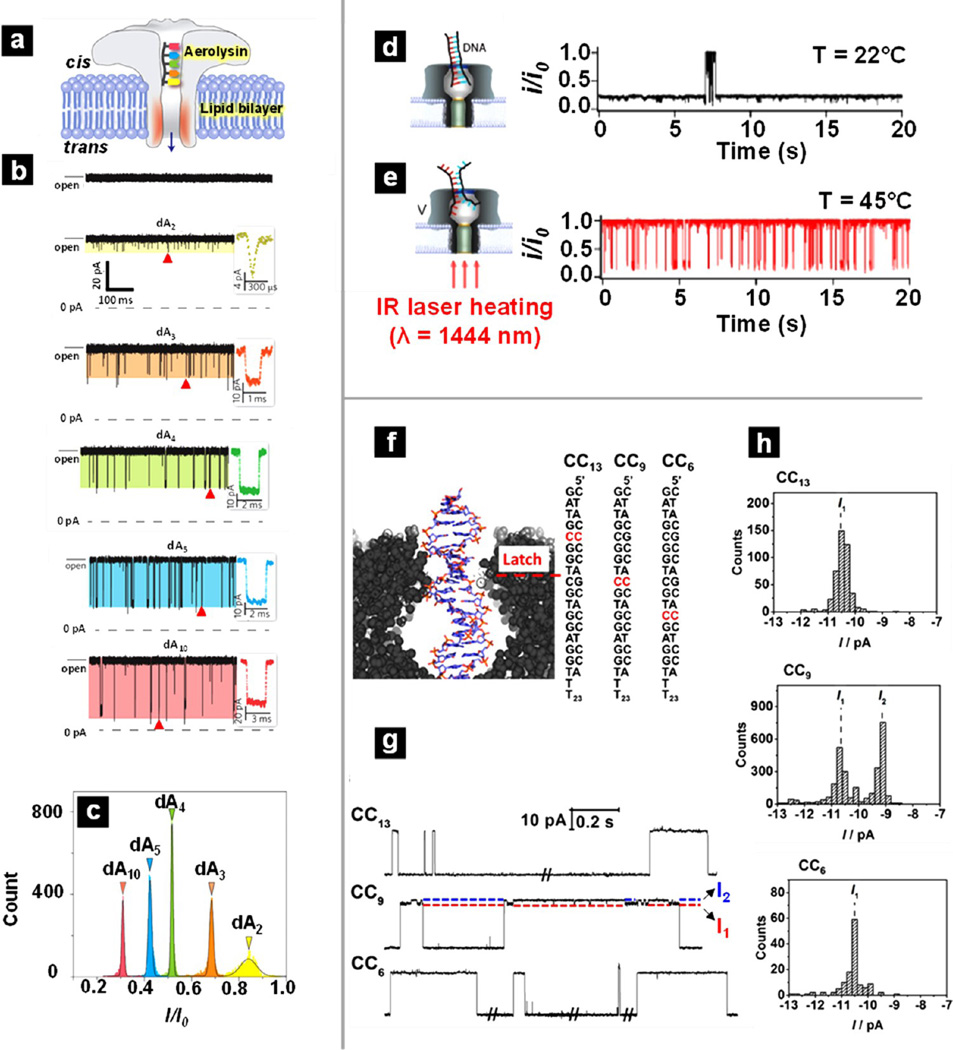
Applications of biological nanopores for the detection of nucleotides. (a–c) Detection of oligonucleotides (polydeoxyadenines (dAn), n = 2, 3, 4, 5, 10) with an aerolysin pore. (a) Schematic illustration of a short oligonucleotide passing through an aerolysin nanopore embedded in a lipid bilayer. (b) From top to bottom, representative current traces recorded without dAn and with the addition of dA2, dA3, dA4, dA5, and dA10. The red triangles denote typical blockades shown in the insets. (c) Histogram for the blockade events associated with dAn with Gaussian fits. (a–c) Reproduced from Cao, C.; Ying, Y.-L.; Hu, Z.-L.; Liao, D.-F.; Tian, H.; Long, Y.-T. Nat. Nanotechnol
2016
11, 713–718 (ref 49), with permission from Nature Publishing Group. (d, e) Indirect detection of dsDNA with an α-HL pore embedded in a lipid bilayer. Laser light is focused onto a lipid bilayer membrane that contains a single α-HL nanopore and initiates unzipping of dsDNA. (d) Illustration of dsDNA trapped within a α-HL pore and the corresponding current–time trace. (e) Illustration of unzipped DNA translocation through the α-HL pore and the corresponding current-time trace. (d, e) Reproduced from Angevine, C. E.; Seashols-Williams, S. J.; Reiner, J. E. Anal. Chem
2016, 88, 2645–2651 (ref 135). Copyright 2016 American Chemical Society. (f–h) Identification of a mismatched base pair in a dsDNA sequence by the latch constriction zone of α-HL. (f) Schematic illustration of a dsDNA trapped within the vestibule and three dsDNA duplex designs with a mismatched CC pair at different locations within the strand. Representative current–time traces (g) and histograms (h) of the current states for the different duplexes. (f–h) Reproduced from Johnson, R. P.; Fleming, A. M.; Beuth, L. R.; Burrows, C. J.; White, H. S. J. Am. Chem. Soc. 2016, 138, 594–603 (ref 140). Copyright 2016 American Chemical Society.
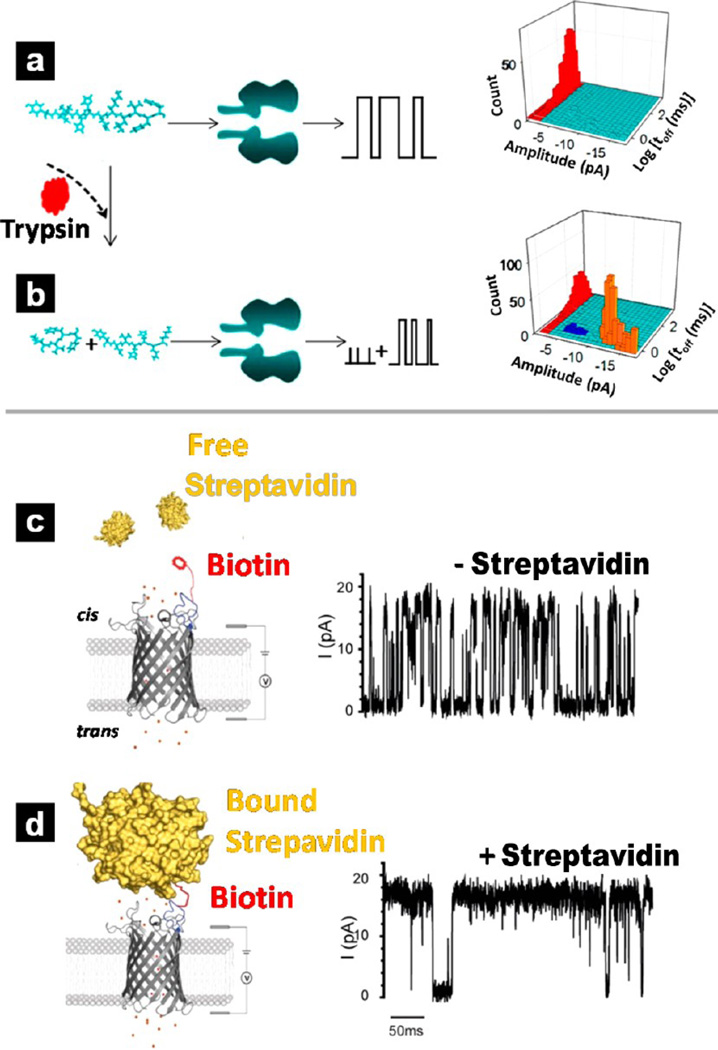
Applications of biological nanopores in the detection of proteins. (Top) Indirect detection of protein molecules with α-HL. Comparison of current modulations measured for the initial peptide substrate (a) and its cleaved products (b) can be performed to determine trypsin activities. 3D plots of event counts vs residence time vs blockade amplitude show a clear difference between whole peptide substrate (red), fragment 1 (blue), and fragment 2 (yellow). (a, b) Reproduced from Zhou, S.; Wang, L.; Chen, X.; Guan, X. ACS Sensors
2016, 1, 607–613 (ref 142). Copyright 2016 American Chemical Society. (Bottom) Detection of protein with an OmpG pore. (c) OmpG-PEG2-biotin pore without bound streptavidin and corresponding characteristic current trace; (d) OmpG-PEG2-biotin pore with bound streptavidin and corresponding characteristic current trace. (c, d) Reproduced from Fahie, M.; Chisholm, C.; Chen, M. ACS Nano
2015, 9, 1089–1098 (ref 43). Copyright 2015 American Chemical Society.

α-HL–polymerase sensor for DNA sequencing. (a) Schematic of the sensor design with phi29 DNA polymerase molecule conjugated to an α-HL nanopore. (b) Sequencing-by-synthesis (SBS) schematic that shows the sequential capture and detection of tagged nucleotides as they are incorporated into the growing DNA strand to produce nucleotide-specific current blockades. (c) Example of the homopolymer sequence reads. Reproduced from Fuller, C. W.; Kumar, S.; Porel, M.; Chien, M.; Bibillo, A.; Stranges, P. B.; Dorwart, M.; Tao, C.; Li, Z.; Guo, W.; et al. Proc. Natl. Acad. Sci. U. S. A. 2016, 113, 5233–5238 (ref 52). Copyright 2016 National Academy of Sciences.
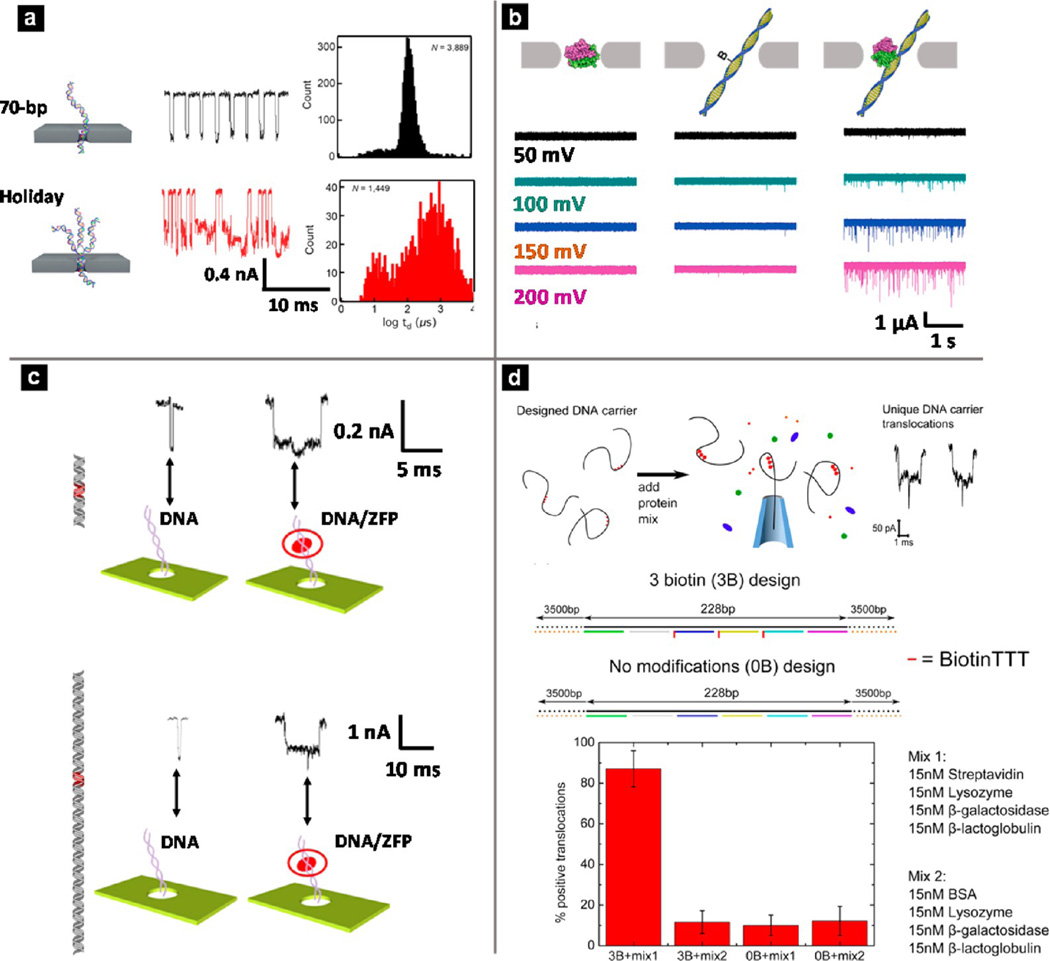
Different applications of solid-state nanopores. (a) Detection of various dsDNA conformations with a 2.5 nm SiNx nanopore. Schematic illustration, representative current trace, and log-dwell time histogram of DNA product (top) and one type of DNA misassembly (bottom). Reproduced from Carson, S.; Wick, S. T.; Carr, P. A.; Wanunu, M.; Aguilar, C. A. ACS Nano
2015, 9, 12417–12424 (ref 188). Copyright 2015 American Chemical Society. (b) Detection of short dsDNA molecules with a 7 nm SiNx nanopore. Translocation experiments of monovalent streptavidin (MS) only, dsDNA (bio90) only, and MS incubated with bio90 at a molar ratio of 8:1. (Left) Current traces for MS only; (center) bio90 only; (right) MS–bio90 mixture over a range of potentials. Reproduced from Carlsen, A. T.; Zahid, O. K.; Ruzicka, J. A.; Taylor, E. W.; Hall, A. R. Nano Lett
2014
14, 5488–5492 (ref 191). Copyright 2014 American Chemical Society. (c) Detection of zinc finger proteins (ZFPs) along a long strand DNA molecule with SiNx nanopores. (Top) Illustrations and representative current characteristics of two types of translocation events for a DNA–protein complex with ZFP bound in the center. (Bottom) Illustrations and representative current characteristics of two types of translocation events for a DNA–protein complex with ZFP bound at the 2-to-5 position. Reproduced from Yu, J.-S.; Lim, M.-C.; Huynh, D. T. N.; Kim, H.-J.; Kim, H.-M.; Kim, Y.-R.; Kim, K.-B. ACS Nano
2015
9, 5289–5298 (ref 200). Copyright 2015 American Chemical Society. (d) Detection of bound proteins with designed DNA carriers. (Top) Schematic illustration of the detection scheme. (Middle) Two DNA carrier designs, with three biotin sites (3B) and no biotin sites (0B). (Bottom) Plot of percentage of positive translocations with different protein mixture–DNA carrier combinations. Reproduced from Bell, N. A. W.; Keyser, U. F. J. Am. Chem. Soc
2015
137, 2035–2041 (ref 202). Copyright 2015 American Chemical Society.
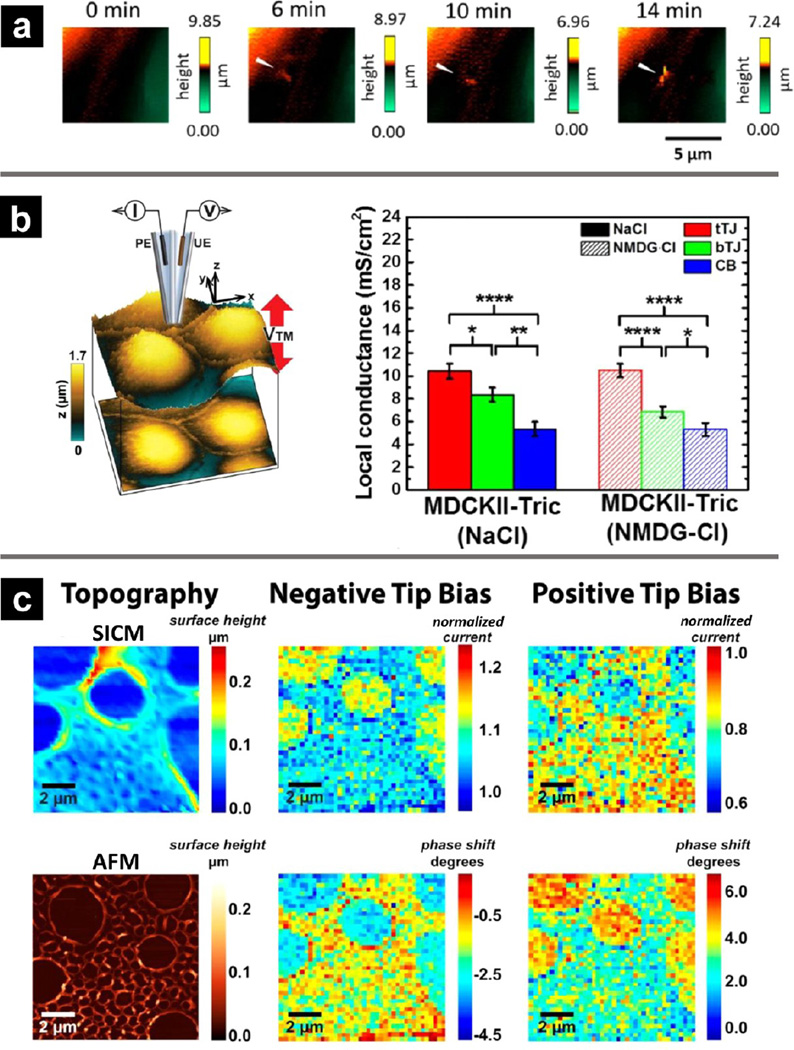
Representative applications of solid-state nanopore integration with scanning probe techniques. (a) SICM sequential topographical images of the protrusion formation process in living HUVECs after PMA stimulation. Reproduced from Nashimoto, Y.; Takahashi, Y.; Ida, H.; Matsumae, Y.; Ino, K.; Shiku, H.; Matsue, T. Anal. Chem
2015
87, 2542–2545 (ref 215). Copyright 2015 American Chemical Society. (b) (Left) Illustration of potentiometric scanning ion conductance microscopy (P-SICM) setup for measurement at a tricellular tight junction (tTJ). (Right) Apparent local conductance of tricellulin overexpression MDCKII cells in Ringer solution and in NMDG+ replacement solution. Reproduced from Zhou, L.; Gong, Y.; Sunq, A.; Hou, J.; Baker, L. A. Anal. Chem
2016, 88, 9630–9637 (ref 225). Copyright 2016 American Chemical Society. (c) Simultaneous topographical sensing and surface-charge sensing of a nonuniform polystyrene film on glass. (Left) SICM topography image of substrate with hopping mode at ΔV = 0 and AFM image of a similar area within the substrate. Normalized DC component and AC phase shift at negative tip bias (middle) and positive tip bias (right). Reproduced from Perry, D.; Al Botros, R.; Momotenko, D.; Kinnear, S. L.; Unwin, P. R. ACS Nano
2015
9, 7266–7276 (ref 230). Copyright 2015 American Chemical Society.
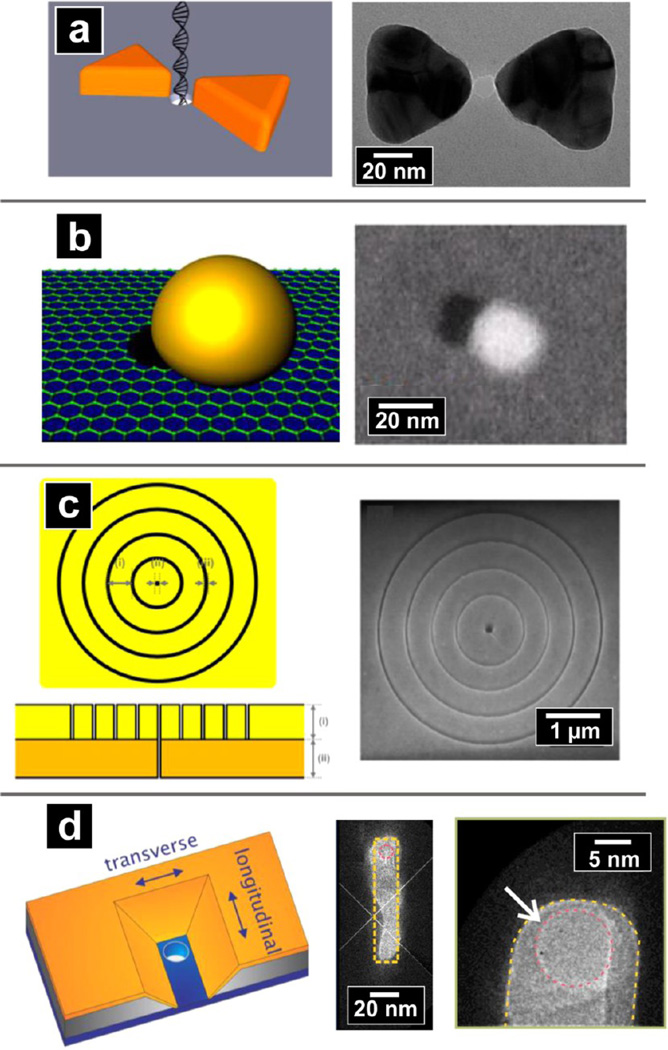
Representative configurations of plasmonic nanopores. (a) Schematic illustration of DNA molecule translocation through a gold bowtie antenna with a 10 nm nanopore at the gap center (left) and TEM image of the gold bowtie plasmonic nanopore device (right). Reproduced from Nicoli, F.; Verschueren, D.; Klein, M.; Dekker, C.; Jonsson, M. P. Nano Lett
2014
14, 6917–6925 (ref 103). Copyright 2014 American Chemical Society. (b) Schematic of a graphene nanopore with self-integrated optical antenna (left) and SEM image of a graphene nanopore with integrated nanoparticle (right). Reproduced from Nam, S.; Choi, I.; Fu, C.-c.; Kim, K.; Hong, S.; Choi, Y.; Zettl, A.; Lee, L. P. Nano Lett
2014
14, 5584–5589 (ref 245). Copyright 2014 American Chemical Society. (c) Schematic of a bullseye plasmonic nanopore with a top-down view of features milled into gold film (dimensions: (i) ring period 518 nm, (ii) pore diameter 80 nm, and (iii) ring width 80 nm) and a side-on cross-section of freestanding membrane (left). SEM image with a top-down view of the nanopore/ bullseye structure milled into the membrane. Reproduced from Crick, C. R.; Albella, P.; Ng, B.; Ivanov, A. P.; Roschuk, T.; Cecchini, M. P.; Bresme, F.; Maier, S. A.; Edel, J. B. Nano Lett
2014
15, 553–559 (ref 101). Copyright 2014 American Chemical Society. (d) Schematic of the “pore-in-cavity” plasmonic nanopore with a plasmonic cavity on top of a nanopore (left). TEM image of a silicon nitride membrane surrounded by the gold nanocavity with the designed boundary of the gold cavity indicated by the yellow dashed line (middle). Magnified TEM image of red dashed circle in middle panel, showing a typical 10 nm nanopore inside the gold nanocavity (right). Reproduced from Li, Y.; Nicoli, F.; Chen, C.; Lagae, L.; Groeseneken, G.; Stakenborg, T.; Zandbergen, H. W.; Dekker, C.; Van Dorpe, P.; Jonsson, M. P. Nano Lett
2015
15, 776–782 (ref 246). Copyright 2015 American Chemical Society.
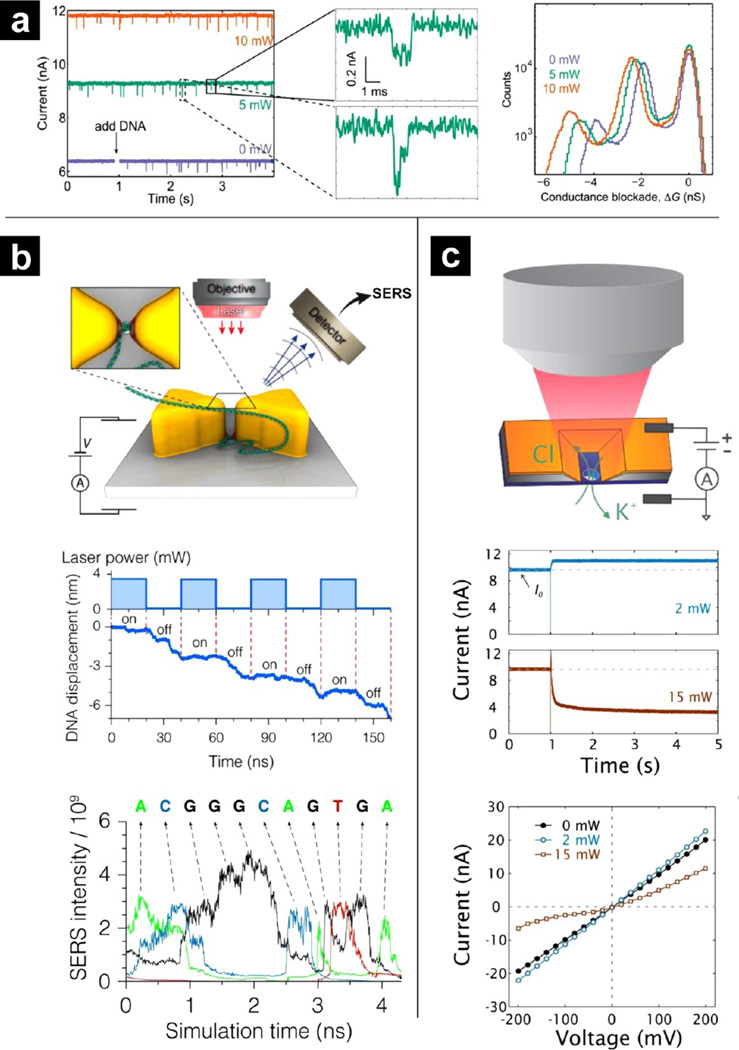
Representative applications of plasmonic nanopores. (a) Application in DNA translocation studies. (Left) Examples of current traces without (green) and with plasmonic excitation using laser power of 5 mW (purple) and 10 mW (orange). (Center) Magnified current signals for DNA translocation events. (Right) Corresponding histogram of conductance blockades for DNA translocation. Reproduced from Nicoli, F.; Verschueren, D.; Klein, M.; Dekker, C.; Jonsson, M. P. Nano Lett
2014
14, 6917–6925 (ref 103). Copyright 2014 American Chemical Society. (b) Proposed approach for DNA sequencing with a plasmonic nanopore. (Top) Schematic of proposed plasmonic nanopore device to trap and sequence DNA. (Middle) Duty cycle of laser illumination and simulated displacement of the DNA molecule. (Bottom) Raman intensity signals recorded during translocation of ssDNA through a single plasmonic hot spot. Reproduced from Belkin, M.; Chao, S.-H.; Jonsson, M. P.; Dekker, C.; Aksimentiev, A. ACS Nano
2015
9, 10598–10611 (ref 104). Copyright 2015 American Chemical Society. (c) Photoresistance control of a plasmonic nanopore. (Top) Schematic illustration of experiment setup that uses a plasmonic “pore-in-cavity” structure. (Middle) Ionic current traces of the nanopore when illuminated with different laser powers. (Bottom) Current–voltage curves that highlight rectification effects of high powered laser illumination. Reproduced from Li, Y.; Nicoli, F.; Chen, C.; Lagae, L.; Groeseneken, G.; Stakenborg, T.; Zandbergen, H. W.; Dekker, C.; Van Dorpe, P.; Jonsson, M. P. Nano Lett
2015
15, 776–782 (ref 246). Copyright 2015 American Chemical Society.

Representative examples of hybrid nanopore platforms. (Top) Carbon nanotubes (CNTs) within a lipid bilayer. (a) Schematic depiction of ssDNA translocation event through a CNT porin in the lipid bilayer. (b) Representative current traces in the absence (top) and presence (bottom) of ssDNA. (a, b) Reproduced from Geng, J.; Kim, K.; Zhang, J.; Escalada, A.; Tunuguntla, R.; Comolli, L. R.; Allen, F. I.; Shnyrova, A. V.; Cho, K. R.; Munoz, D. Nature
2014
514, 612–615 (ref 83), with permission from Nature Publishing Group. (Bottom) Membrane patch-ion channel probe. (c) Instrumental setup for dual-barrel ion channel probe-SICM measurements. (d) Current–time (I–T) traces recorded with the ICP barrel close (top) and far (bottom) from surface substrate. (c, d) Reproduced from Shi, W.; Zeng, Y.; Zhou, L.; Xiao, Y.; Cummins, T. R.; Baker, L. A. Faraday Discuss
2016, DOI: 10.1039/C6FD00133E (ref 80), with permission of The Royal Society of Chemistry.
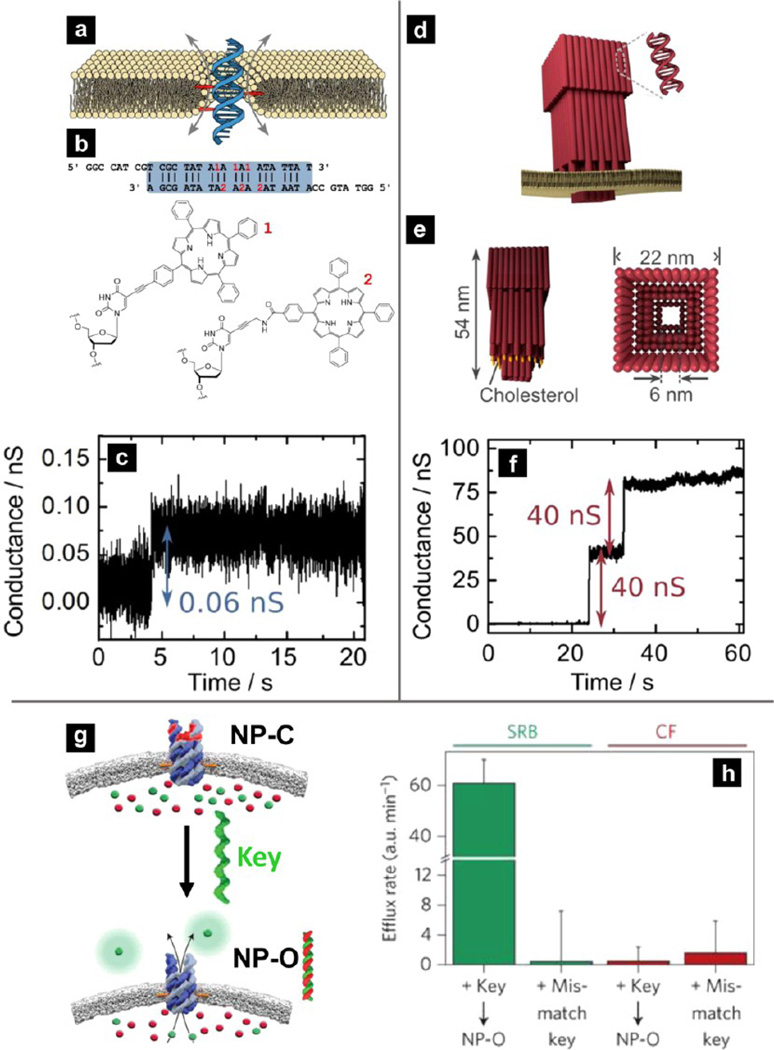
Representative DNA origami nanopores. (a) Envisioned placement and conductance mechanism of the DNA duplex (blue) with membrane anchors (red) that form a toroidal lipid pore (yellow). (b) Sequence of the nucleotide duplex, with the locations of tags within the sequence shown in red and their corresponding chemical structures. (c) Ionic current trace of duplex insertion in the lipid bilayer membrane. (a–c) Reproduced from Gopfrich, K.; Li, C.-Y.; Mames, I.; Bhamidimarri, S. P.; Ricci, M.; Yoo, J.; Mames, A.; Ohmann, A.; Winterhalter, M.; Stulz, E.; Aksimentiev, A.; Keyser, U. F. Nano Lett
2016
16, 4665–4669 (ref 84). Copyright 2016 American Chemical Society. (d) Envisioned positioning of the funnel-shaped DNA porin (red) in the lipid membrane (yellow) with each DNA duplex represented as a rod. (e) Side and top views of the DNA porin with 19 cholesterol tags (orange). (f) Ionic current trace of two consecutive DNA–origami porin insertions in the lipid bilayer membrane. (d–f) Reproduced from Gopfrich, K.; Li, C.-Y.; Ricci, M.; Bhamidimarri, S. P.; Yoo, J.; Gyenes, B.; Ohmann, A.; Winterhalter, M.; Aksimentiev, A.; Keyser, U. F. ACS Nano
2016
10, 8207–8214 (ref 85). Copyright 2016 American Chemical Society. (g) Schematic illustration of the ligand-trigger mechanism of a designed DNA porin. Conversion of the nanopore from CLOSED state (NP-C) to OPEN state (NP-O) is achieved through binding of the complementary “key” oligonucleotide to the “lock” oligonucleotide positioned at the lumen of the pore. (h) Flux histograms of CF and SRB through NP-C exposed to a mismatching key and NP-C after addition of a matching key to yield NP-O. (g, h) Reproduced from Burns, J. R.; Seifert, A.; Fertig, N.; Howorka, S. Nat. Nanotechnol
2016
11, 152–156 (ref 87), with permission from Nature Publishing Group.
References
-
- Venkatesan BM, Bashir R. Nat. Nanotechnol. 2011;6:615–624. - PubMed
-
- Miles BN, Ivanov AP, Wilson KA, Dogan F, Japrung D, Edel JB. Chem. Soc. Rev. 2013;42:15–28. - PubMed
-
- Kasianowicz JJ, Robertson JW, Chan ER, Reiner JE, Stanford VM. Annu. Rev. Anal. Chem. 2008;1:737–766. - PubMed
-
- Gyurcsanyi RE. TrAC, Trends Anal. Chem. 2008;27:627–639.
-
- Friedman AK, Baker LA. In Nanoelectrochemistry. Boca Raton, FL: CRC Press; 2015. pp. 395–438.
Publication types
MeSH terms
Grants and funding
LinkOut - more resources
Full Text Sources
Other Literature Sources
