

Review
doi: 10.1021/acs.analchem.6b04420.
Epub 2016 Dec 2.
Recent Advances in NMR-Based Metabolomics
Affiliations
- PMID: 28105846
- PMCID: PMC6263946
- DOI: 10.1021/acs.analchem.6b04420
Item in Clipboard
Review
Recent Advances in NMR-Based Metabolomics
Anal Chem.
.
No abstract available
Conflict of interest statement
The authors declare the following competing financial interest(s): Daniel Raftery reports holding equity and an executive role in Matrix-Bio, Inc.
Figures
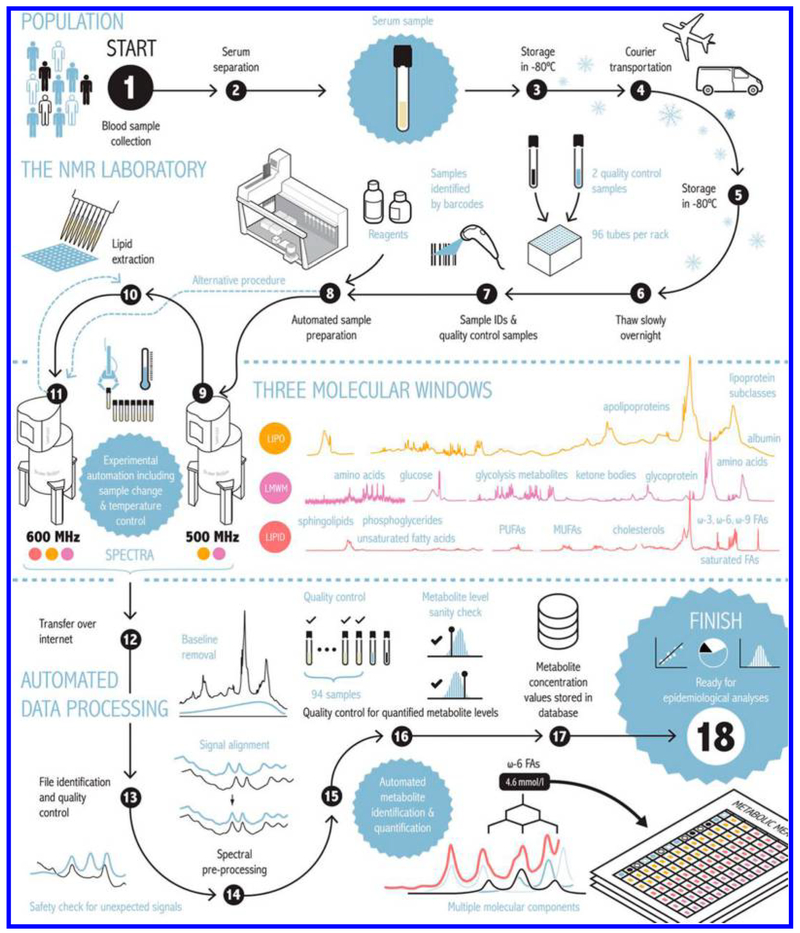
Automated high-throughput serum NMR metabolomics platform used to obtain molar concentrations of more than 200 metabolic measures. The samples are handled in 96-well plates, with every plate containing 2 quality control samples, a serum mimic and a mixture of two low-molecular-weight metabolites. All liquid handling steps for serum samples are performed by a PerkinElmer JANUS Automated Workstation equipped with an 8-tip dispensor arm with Varispan. This platform has two NMR spectrometers, each equipped with a SampleJet that holds 480 samples at a cooled (+6 °C) temperature that allow analysis of ≈80 000 samples annually. Reproduced from Soininen, P.; Kangas, A. J.; Würtz, P.; Suna, T.; Ala-Korpela, M.Circ. Cardiovasc. Genet. 2015, 8, 192–206 (ref 32). Copyright 2015 Wolters Kluwer Health, Inc.
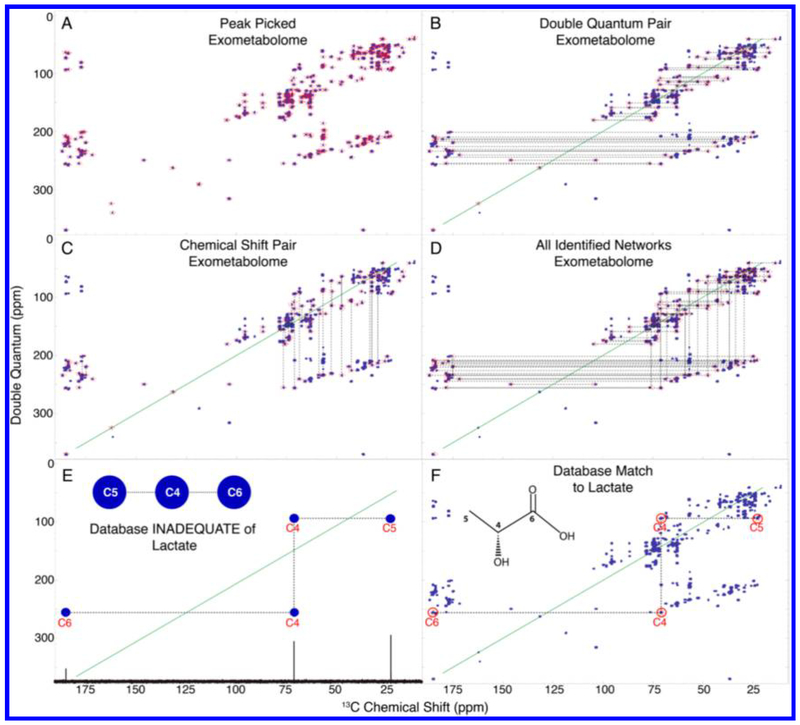
INETA (INADEQUATE network analysis) method for metabolite identification, which uses an INADEQUATE experiment for 13C enriched samples to connect peaks. Peaks are picked (A) and their double quantum signal pair is found (B). Peaks lacking a partner are not considered in the analysis. Vertical pairs are matched on the basis of chemical shifts (C). Vertical and horizontal pairs are connected to form a network. All networks are shown in part D. 1D 13C spectra and carbon connectivity information are downloaded from the BMRB, and a 2D INADEQUATE in silico database is generated by adding the chemical shifts of two directly bonded carbons (E). The INADEQUATE spectra of database matches or candidates can then be plotted onto the peak-picked experimental spectra (denoted by red circles above carbon numbers) to give positive identification (F). Reproduced from Clendinen, C. S.; Pasquel, C.; Ajredini, R.; Edison, A. S. Anal. Chem. 2015, 87, 5698–5706 (ref 41). Copyright 2015 American Chemical Society.
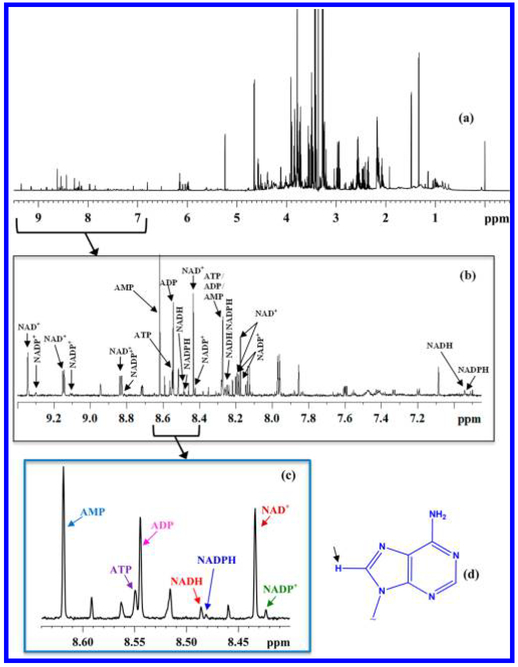
(a) Typical 800 MHz 1H NMR spectrum of a mouse liver tissue; (b) expanded spectral region with annotations for peaks for oxidized nicotinamide adenine dinucleotide (NAD+), oxidized nicotinamide adenine dinucleotide phosphate (NADP+), reduced nicotinamide adenine dinucleotide (NADH), reduced nicotinamide adenine dinucleotide phosphate (NADPH), adenosine triphosphate (ATP), adenosine diphosphate (ADP), and adenosine mono-phosphate (AMP); (c) expanded spectral region showing the characteristic fingerprint of the redox and energy coenzymes; and (d) adenine moiety with the lone hydrogen atom on the five membered ring indicated by an arrow; all peaks in the fingerprint region shown in part c arise from this hydrogen atom. Reproduced from Nagana Gowda, G. A.; Abell, L.; Lee, C. F.; Tian, R.; Raftery, D. Anal. Chem. 2016, 88, 4817–4824 (ref 70). Copyright 2016 American Chemical Society.
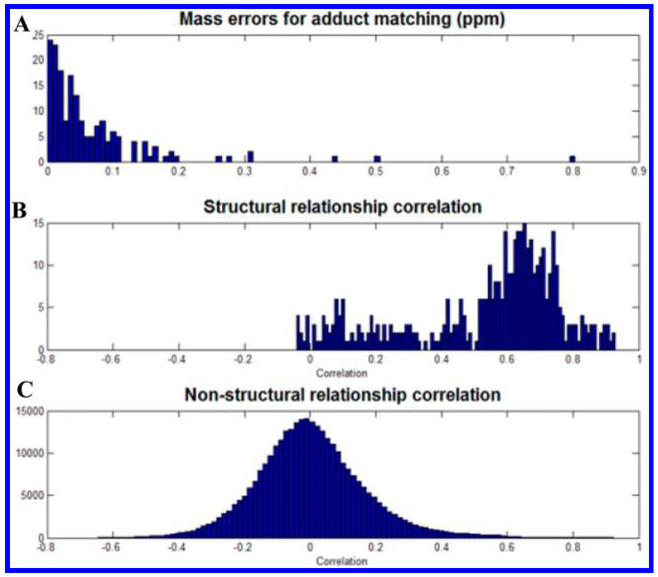
Statistical correlation between NMR and MS: (A) distribution of mass errors for MS peaks that matched to at least one assigned NMR bin, (B) structural correlations between NMR and MS, and (C) nonstructural correlations between NMR and MS. Reproduced from Hao, J.; Liebeke, M.; Sommer, U.; Viant, M. R.; Bundy, J. G.; Ebbels, T. M. Anal. Chem. 2016, 88, 2583–2589 (ref 75). Copyright 2016 American Chemical Society.
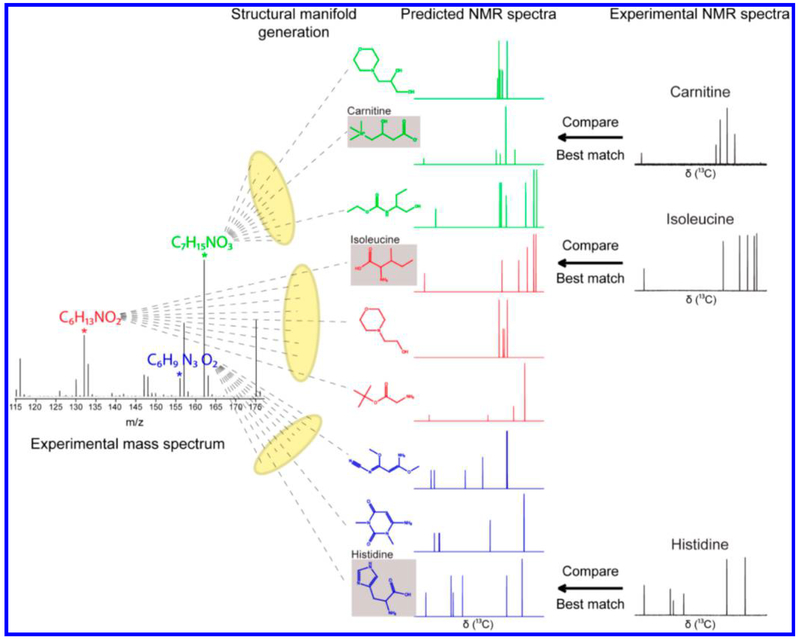
Schematic representation of the strategy for identifying metabolites in complex metabolomic mixtures by combining mass spectrometry with data from predicted and experimental 1D NMR spectroscopy. Reproduced from Bingol, K.; Bruschweiler-Li, L.; Yu, C.; Somogyi, A.; Zhang, F.; Brüschweiler, R.Anal. Chem. 2015, 87, 3864–3870 (ref 80). Copyright 2015 American Chemical Society.
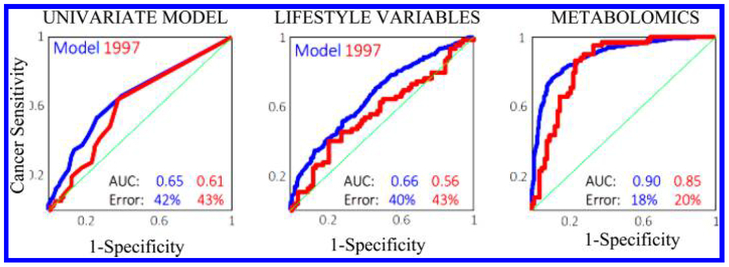
Comparison of the prediction accuracy for breast cancer incidence several years early obtained from three different models: a univariate model (left), a model of the 47 lifestyle variables (middle) and the model based on the combination of the serum NMR metabolite profile and lifestyle variables (right). Blue curve: Model from the data obtained in 1993–1996. Red curve: validation using independent data obtained in 1997. Reproduced from Bro, R.; Kamstrup-Nielsen, M. H.; Engelsen, S. B.; Savorani, F.; Rasmussen, M. A.; Hansen, L.; Olsen, A.; Tjønneland, A.; Dragsted, L. O. Metabolomics 2015, 11, 1376–1380 (ref 105).
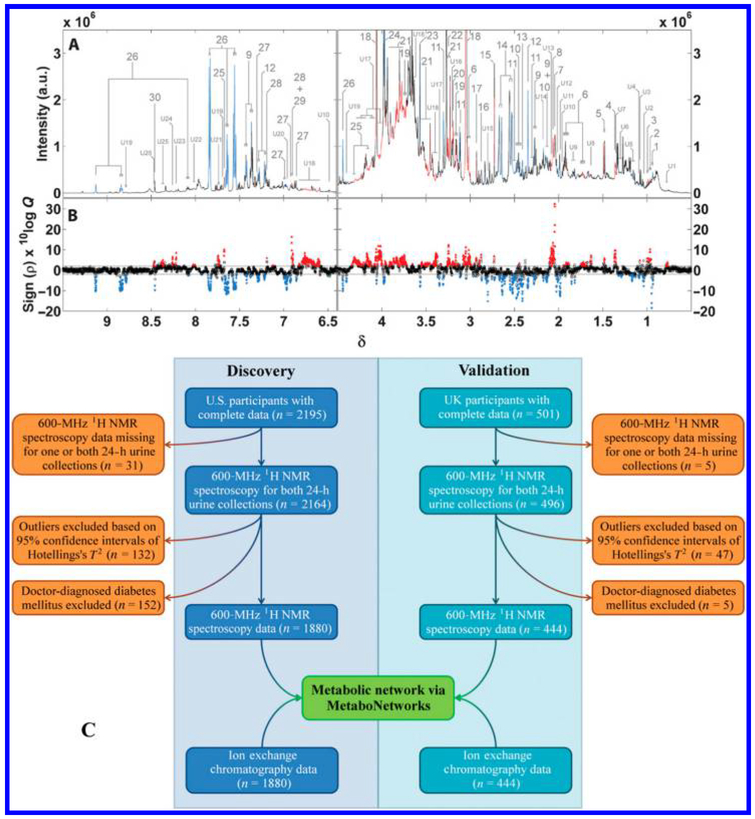
An international (U.S. and U.K.) study focused on urinary metabolic signatures of human adiposity. (A) An average spectrum of 1880 urine spectra from the U.S. cohort; (B) associations of BMI with urinary metabolites. Statistically significant peaks are colored red if directly associated with BMI and blue if inversely associated. (C) Overall study design. Reproduced from Elliott, P.; Posma, J. M.; Chan, Q.; Garcia-Perez, I.; Wijeyesekera, A.; Bictash, M.; Ebbels, T. M.; Ueshima, H.; Zhao, L.; van Horn, L.; Daviglus, M.; Stamler, J.; Holmes, E.; Nicholson, J. K. Sci. Transl. Med. 2015, 7, 285ra62 (ref 137). Copyright 2015 American Association for the Advancement of Science.
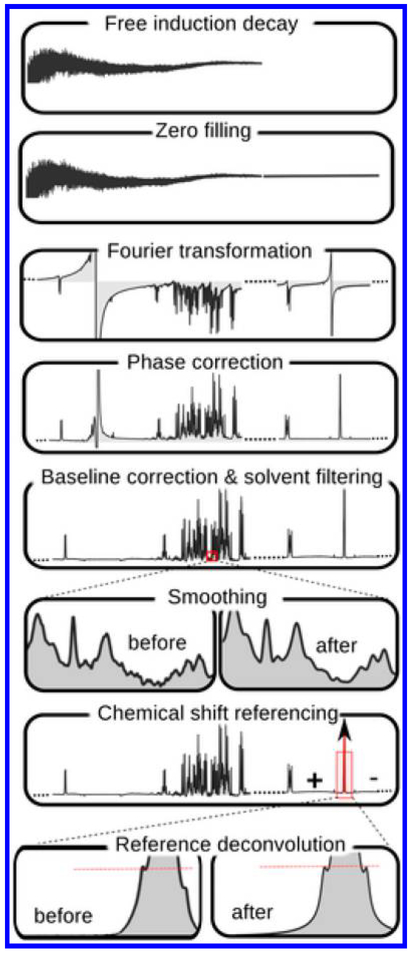
NMR spectral processing steps in BAYESIL for the automated identification and quantitation of metabolites. Reproduced from Ravanbakhsh, S.; Liu, P.; Bjorndahl, T. C.; Mandal, R.; Grant, J. R.; Wilson, M.; Eisner, R.; Sinelnikov, I.; Hu, X.; Luchinat, C.; Greiner, R.; Wishart, D. S. PLoS One 2015, 10, e0124219 (ref 161).
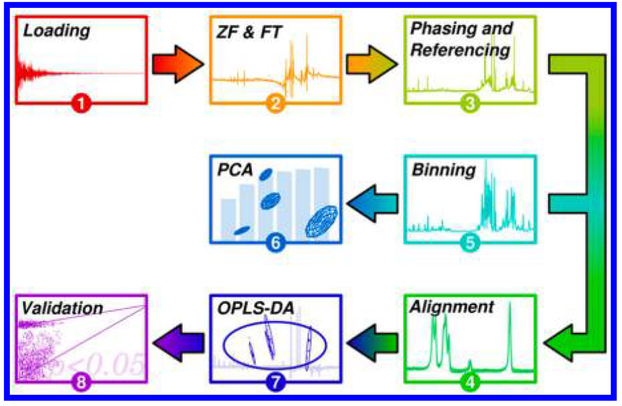
Flow diagram showing the steps handled by the MVAPACK software package. Reproduced from Worley, B.; Powers, R. ACS Chem. Biol. 2014, 9, 1138–1144 (ref 168). Copyright 2014 American Chemical Society.
Similar articles
-
The strengths and weaknesses of NMR spectroscopy and mass spectrometry with particular focus on metabolomics research.Methods Mol Biol. 2015;1277:161-93. doi: 10.1007/978-1-4939-2377-9_13. Methods Mol Biol. 2015. PMID: 25677154
-
Two elephants in the room: new hybrid nuclear magnetic resonance and mass spectrometry approaches for metabolomics.Curr Opin Clin Nutr Metab Care. 2015 Sep;18(5):471-7. doi: 10.1097/MCO.0000000000000206. Curr Opin Clin Nutr Metab Care. 2015. PMID: 26154280 Free PMC article. Review.
-
Nuclear magnetic resonance: a key metabolomics platform in the drug discovery process.Drug Discov Today Technol. 2015 Jun;13:39-46. doi: 10.1016/j.ddtec.2015.06.005. Epub 2015 Jul 14. Drug Discov Today Technol. 2015. PMID: 26190682 Review.
-
Special Issue: NMR-Based Metabolomics.Molecules. 2021 May 29;26(11):3283. doi: 10.3390/molecules26113283. Molecules. 2021. PMID: 34072383 Free PMC article.
-
Metabolomics Toward Biomarker Discovery.Methods Mol Biol. 2017;1619:467-475. doi: 10.1007/978-1-4939-7057-5_32. Methods Mol Biol. 2017. PMID: 28674904
Cited by
-
Bioactive Compounds from Marine Sponges and Algae: Effects on Cancer Cell Metabolome and Chemical Structures.Int J Mol Sci. 2022 Sep 14;23(18):10680. doi: 10.3390/ijms231810680. Int J Mol Sci. 2022. PMID: 36142592 Free PMC article. Review.
-
NMR-Based Metabolomics.Adv Exp Med Biol. 2021;1280:19-37. doi: 10.1007/978-3-030-51652-9_2. Adv Exp Med Biol. 2021. PMID: 33791972 Free PMC article.
-
The exposome paradigm to predict environmental health in terms of systemic homeostasis and resource balance based on NMR data science.RSC Adv. 2021 Sep 13;11(48):30426-30447. doi: 10.1039/d1ra03008f. eCollection 2021 Sep 6. RSC Adv. 2021. PMID: 35480260 Free PMC article. Review.
-
Geographical Origin Assessment of Extra Virgin Olive Oil via NMR and MS Combined with Chemometrics as Analytical Approaches.Foods. 2022 Jan 1;11(1):113. doi: 10.3390/foods11010113. Foods. 2022. PMID: 35010239 Free PMC article. Review.
-
Recent Advances in Targeted and Untargeted Metabolomics by NMR and MS/NMR Methods.High Throughput. 2018 Apr 18;7(2):9. doi: 10.3390/ht7020009. High Throughput. 2018. PMID: 29670016 Free PMC article. Review.
References
-
- Larive CK; Barding GA Jr; Dinges MM Anal. Chem 2015, 87, 133–146. - PubMed
-
- Nagana Gowda GA; Raftery D In Fundamentals of Advanced Omics Technologies: From Genes to Metabolites Comprehensive Analytical Chemistry; Simo C, Cifuentes A, García-Canas V, Eds.; Elsevier: New York, 2014; pp 187–211.
-
- Wolfender JL; Marti G; Thomas A; Bertrand SJ Chromatogr. A 2015, 1382, 136–164. - PubMed
Publication types
MeSH terms
Grants and funding
LinkOut - more resources
Full Text Sources
Other Literature Sources
