. 2016 Dec 13;17(Suppl 16):493.
doi: 10.1186/s12859-016-1308-y.

Spectral consensus strategy for accurate reconstruction of large biological networks

Affiliations

Spectral consensus strategy for accurate reconstruction of large biological networks

Séverine Affeldt et al. BMC Bioinformatics. .

Abstract

Background: The last decades witnessed an explosion of large-scale biological datasets whose analyses require the continuous development of innovative algorithms. Many of these high-dimensional datasets are related to large biological networks with few or no experimentally proven interactions. A striking example lies in the recent gut bacterial studies that provided researchers with a plethora of information sources. Despite a deeper knowledge of microbiome composition, inferring bacterial interactions remains a critical step that encounters significant issues, due in particular to high-dimensional settings, unknown gut bacterial taxa and unavoidable noise in sparse datasets. Such data type make any a priori choice of a learning method particularly difficult and urge the need for the development of new scalable approaches.

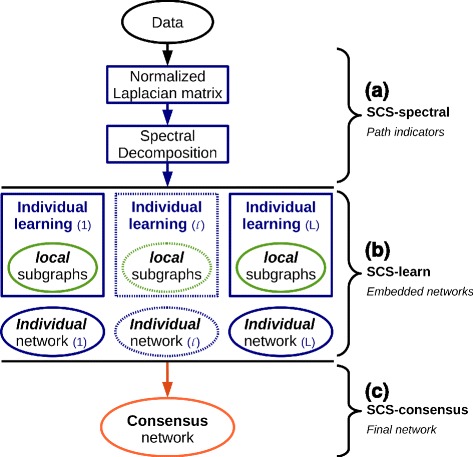
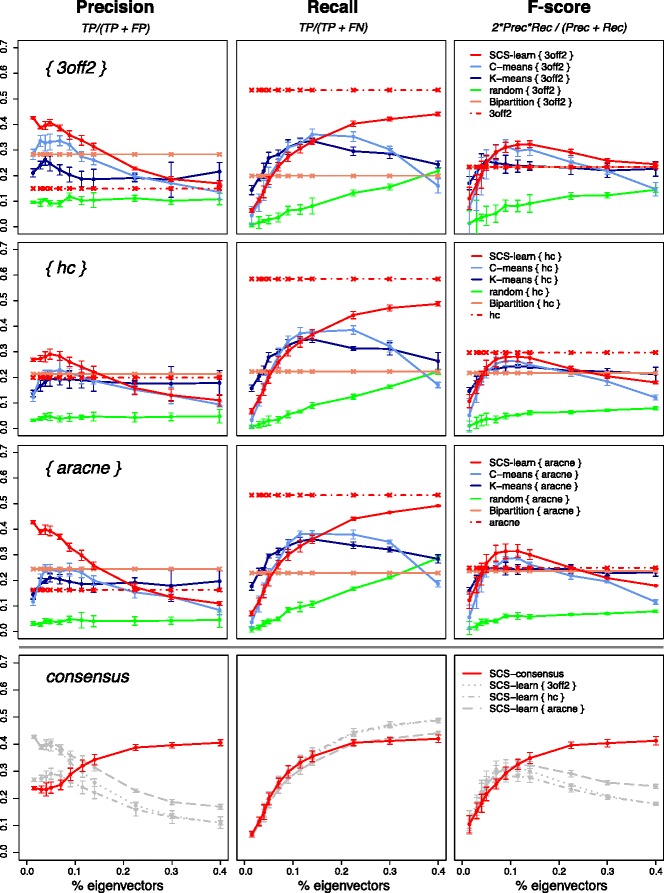
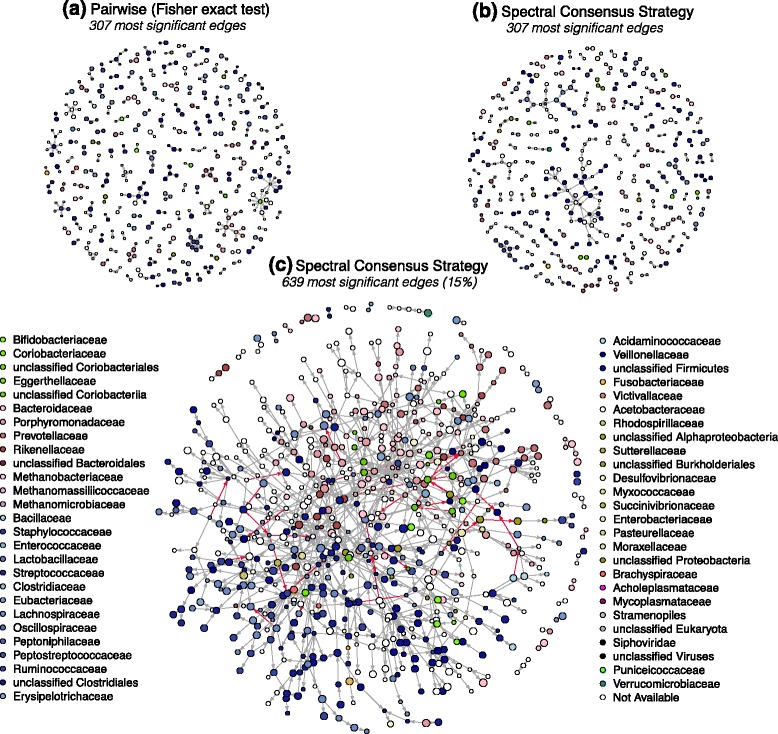
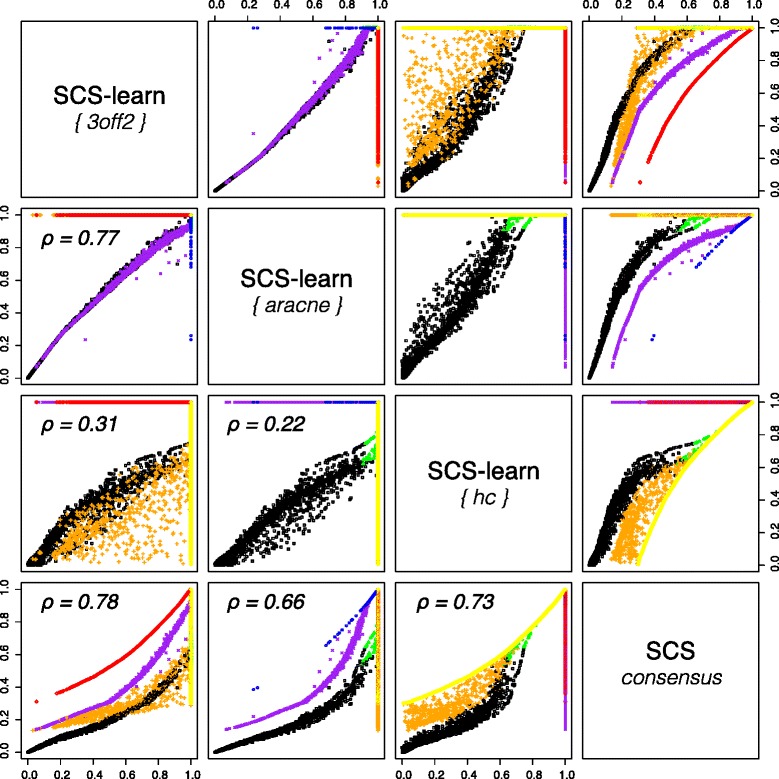
Results: We propose a consensus method based on spectral decomposition, named Spectral Consensus Strategy, to reconstruct large networks from high-dimensional datasets. This novel unsupervised approach can be applied to a broad range of biological networks and the associated spectral framework provides scalability to diverse reconstruction methods. The results obtained on benchmark datasets demonstrate the interest of our approach for high-dimensional cases. As a suitable example, we considered the human gut microbiome co-presence network. For this application, our method successfully retrieves biologically relevant relationships and gives new insights into the topology of this complex ecosystem.

Conclusions: The Spectral Consensus Strategy improves prediction precision and allows scalability of various reconstruction methods to large networks. The integration of multiple reconstruction algorithms turns our approach into a robust learning method. All together, this strategy increases the confidence of predicted interactions from high-dimensional datasets without demanding computations.

Keywords: Community-based method; High-dimensional data; Microbiota; Network reconstruction; Spectral theory.


Figures

Fig. 1
Fig. 1
Overview of the Spectral Consensus Strategy (SCS). The SCS method unfolds in three parts. a The SCS-spectral phase identifies sets of path-related variables based on the magnitude of the graph Laplacian eigenvector elements. b The SCS-learn phase performs multiple parallel local reconstructions using different learning methods. c The SCS-consensus phase provides a consensus network built on the individual outcomes from the SCS-learn step
Fig. 2
Fig. 2
SCS-learn and SCS-consensus evaluations for ANDES benchmark network [223 nodes, 338 edges, 〈k〉=3.03]. Precision, Recall and F-score results for an increasing proportion of eigenvectors (up to 40 %), subgraphs of 12 nodes (5 % variables) and 150 samples. Scores take misorientations into account. Each point is an average over 5 datasets (results for different subgraph and dataset sizes follow a similar trend, see Additional file 1). (SCS-learn, top three rows) Three learning algorithms are embedded to reconstruct a network from subgraphs whose vertices are selected from the magnitude of eigenvector elements (SCS-learn, red solid line), spectral fuzzy C-means partitioning (light blue solid line), spectral K-means clustering (dark blue solid line), random subsets (green solid line) and recursive bi-partitioning (salmon solid line). Results are compared to scores obtained without spectral or partitioning embedding (red dashed line). (SCS-consensus, bottom row) The SCS-learn reconstructions are combined in a consensus network (red solid line) and compared with individual SCS-learn outcomes (gray dashed lines). Scores are computed from the top 338 consensus edges (results for different number of consensus edges follow a similar trend, see Additional file 1)
Fig. 3
Fig. 3
Microbial co-presence ecosystem. Microbial ecosystem reconstructed with the pairwise Fisher’s exact test [47] (a) and the SCS approach (b,c). Data for 2, 101 co-abundant groups (CAGs) and n=663 patients recruited in the MetaHIT project were used. Edges depict co-presence (gray edges) or absence-presence (red edges) relationships. a Gut microbial ecosystem based on Fisher’s exact test between pairs of CAGs [47] (307 edges between 445 CAGs of at least 50 genes). b The same number of top-ranked edges (307) obtained with the SCS approach which involve 443 CAGs of at least 50 genes. c The 15 % most significant edges obtained with the SCS approach (654 nodes and 639 edges)
Fig. 4
Fig. 4
Edge rank correlations between SCS-learn and SCS-consensus outcomes for human gut microbial ecosystem. 6, 389 edges were predicted from a dataset of 663 observations and 2, 101 CAGs (MetaHIT project [47]). Rank of edges predicted by only one embedded learning method are given in blue (ARACNE, 159 edges), red (3off2, 498 edges) and yellow (hill-climbing, 2, 889 edges). Rank of edges predicted by two individual learning methods are given in green (ARACNE & hill-climbing, 31), orange (3off2 & hill-climbing, 573 edges) and purple (3off2 & ARACNE, 720 edges). Rank of edges predicted by all individual methods are given in black (1, 519 edges)

References

    1. Margolin AA, Nemenman I, Basso K, Wiggins C, Stolovitzky G, Favera RD, Califano A. Aracne: An algorithm for the reconstruction of gene regulatory networks in a mammalian cellular context. BMC Bioinformatics. 2006:7(Suppl 1). - PMC - PubMed
    1. Faith JJ, Hayete B, Thaden JT, Mogno I, Wierzbowski J, Cottarel G, Kasif S, Collins JJ, Gardner TS. Large-scale mapping and validation of escherichia coli transcriptional regulation from a compendium of expression profiles. PLoS Biol. 2007;5(1):8. doi: 10.1371/journal.pbio.0050008. - DOI - PMC - PubMed
    1. Friedman N, Linial M, Nachman I, Pe’er D. International Conference on Computational Molecular Biology. New York: Mary Ann Liebert, Inc.; 2000. Using Bayesian networks to analyze expression data. - PubMed
    1. Affeldt S, Verny L, Isambert H. 3off2: A network reconstruction algorithm based on 2-point and 3-point information statistics. BMC Bioinformatics. 2016;17(S-2):12. doi: 10.1186/s12859-015-0856-x. - DOI - PMC - PubMed
    1. Marbach D, Costello JC, Küffner R, Vega NM, Prill RJ, Camacho DM, Allison KR, Kellis M, Collins JJ, Stolovitzky G, et al. Wisdom of crowds for robust gene network inference. Nat Methods. 2012;9(8):796–804. doi: 10.1038/nmeth.2016. - DOI - PMC - PubMed

LinkOut - more resources