

Gene expression profiling of flax (Linum usitatissimum L.) under edaphic stress
- PMID: 28105944
- PMCID: PMC5123303
- DOI: 10.1186/s12870-016-0927-9
Gene expression profiling of flax (Linum usitatissimum L.) under edaphic stress
Abstract
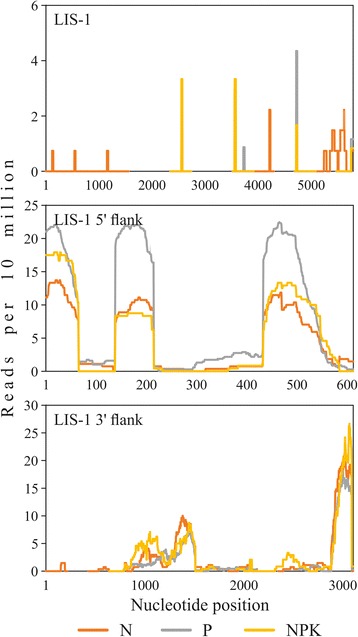
Background: Cultivated flax (Linum usitatissimum L.) is widely used for production of textile, food, chemical and pharmaceutical products. However, various stresses decrease flax production. Search for genes, which are involved in stress response, is necessary for breeding of adaptive cultivars. Imbalanced concentration of nutrient elements in soil decrease flax yields and also results in heritable changes in some flax lines. The appearance of Linum Insertion Sequence 1 (LIS-1) is the most studied modification. However, LIS-1 function is still unclear.
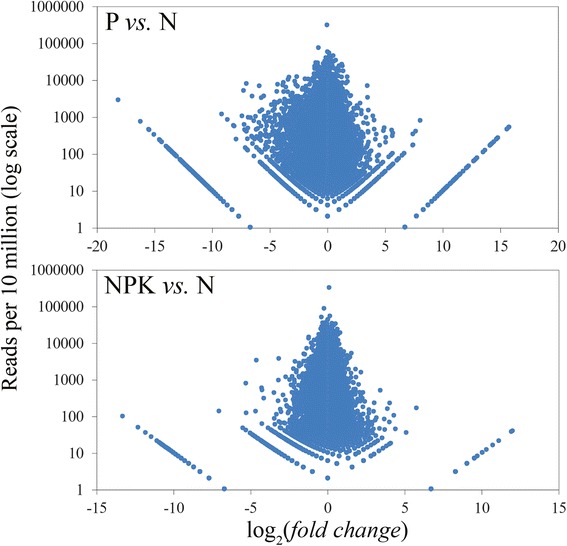
Results: High-throughput sequencing of transcriptome of flax plants grown under normal (N), phosphate deficient (P), and nutrient excess (NPK) conditions was carried out using Illumina platform. The assembly of transcriptome was performed, and a total of 34924, 33797, and 33698 unique transcripts for N, P, and NPK sequencing libraries were identified, respectively. We have not revealed any LIS-1 derived mRNA in our sequencing data. The analysis of high-throughput sequencing data allowed us to identify genes with potentially differential expression under imbalanced nutrition. For further investigation with qPCR, 15 genes were chosen and their expression levels were evaluated in the extended sampling of 31 flax plants. Significant expression alterations were revealed for genes encoding WRKY and JAZ protein families under P and NPK conditions. Moreover, the alterations of WRKY family genes differed depending on LIS-1 presence in flax plant genome. Besides, we revealed slight and LIS-1 independent mRNA level changes of KRP2 and ING1 genes, which are adjacent to LIS-1, under nutrition stress.
Conclusions: Differentially expressed genes were identified in flax plants, which were grown under phosphate deficiency and excess nutrition, on the basis of high-throughput sequencing and qPCR data. We showed that WRKY and JAS gene families participate in flax response to imbalanced nutrient content in soil. Besides, we have not identified any mRNA, which could be derived from LIS-1, in our transcriptome sequencing data. Expression of LIS-1 flanking genes, ING1 and KRP2, was suggested not to be nutrient stress-induced. Obtained results provide new insights into edaphic stress response in flax and the role of LIS-1 in these process.
Keywords: Edaphic stress; Excess nutrition; Flax; High-throughput sequencing; JAZ; LIS-1; Linum usitatissimum; Phosphate deficiency; WRKY; qPCR.
Figures

References
-
- Muir AD, Westcott ND. Flax: the genus Linum. London: Taylor & Francis; 2003.
-
- Bickel CL, Lukacs M, Cullis CA. The loci controlling plasticity in flax. Res Rep Biol. 2012;3:1–11. doi: 10.2147/RRB.S27198. - DOI
-
- Chen Y, Lowenfeld R, Cullis CA. An environmentally induced adaptive (?) insertion event in flax. Int J Genet Mol Biol. 2009;1(3):38–47.
-
- Cullis CA, Charlton L. The induction of ribosomal DNA changes in flax. Plant Sci Lett. 1981;20:213–7. doi: 10.1016/0304-4211(81)90264-9. - DOI
MeSH terms
Substances
LinkOut - more resources
Full Text Sources
Other Literature Sources
Miscellaneous
