. 2016 Nov 16;16(Suppl 3):245.
doi: 10.1186/s12870-016-0926-x.

Identification of nuclear genes controlling chlorophyll synthesis in barley by RNA-seq

Affiliations

Identification of nuclear genes controlling chlorophyll synthesis in barley by RNA-seq

Nickolay A Shmakov et al. BMC Plant Biol. .

Abstract

Background: Albinism in plants is characterized by lack of chlorophyll and results in photosynthesis impairment, abnormal plant development and premature death. These abnormalities are frequently encountered in interspecific crosses and tissue culture experiments. Analysis of albino mutant phenotypes with full or partial chlorophyll deficiency can shed light on genetic determinants and molecular mechanisms of albinism. Here we report analysis of RNA-seq transcription profiling of barley (Hordeum vulgare L.) near-isogenic lines, one of which is a carrier of mutant allele of the Alm gene for albino lemma and pericarp phenotype (line i:BwAlm).

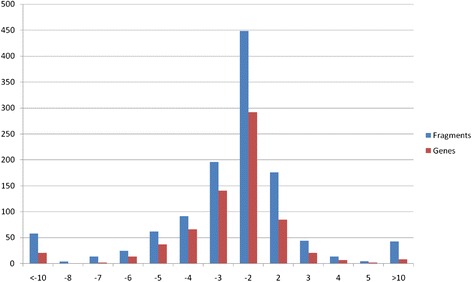
Results: 1221 genome fragments have statistically significant changes in expression levels between lines i:BwAlm and Bowman, with 148 fragments having increased expression levels in line i:BwAlm, and 1073 genome fragments, including 42 plastid operons, having decreased levels of expression in line i:BwAlm. We detected functional dissimilarity between genes with higher and lower levels of expression in i:BwAlm line. Genes with lower level of expression in the i:BwAlm line are mostly associated with photosynthesis and chlorophyll synthesis, while genes with higher expression level are functionally associated with vesicle transport. Differentially expressed genes are shown to be involved in several metabolic pathways; the largest fraction of such genes was observed for the Calvin-Benson-Bassham cycle. Finally, de novo assembly of transcriptome contains several transcripts, not annotated in current H. vulgare genome version.

Conclusions: Our results provide the new information about genes which could be involved in formation of albino lemma and pericarp phenotype. They demonstrate the interplay between nuclear and chloroplast genomes in this physiological process.

Keywords: Albino lemma; Barley; Chlorophyll synthesis; Differential expression; Gene network; IonTorrent sequencing platform; Near-isogenic lines; Nuclear genes; RNA-seq.


Figures

Fig. 1
Fig. 1
The spike phenotype of Bowman (a-d) and i:BwAlm(e-g). a, b, e, f appearance at visible light. c, d, g chlorophyll fluorescence patterns of selected areas
Fig. 2
Fig. 2
The stem node phenotype of Bowman (a-c) and i:BwAlm (d-f). a, d appearance at visible light. b, c, e, f chlorophyll fluorescence pattern of selected areas at low and high magnifications
Fig. 3
Fig. 3
Changes in transcription level of genes MLOC_17002 (a) and XLOC_012413 (b) as obtained with qPCR experiment
Fig. 4
Fig. 4
Dependence of the number of mapped reads with respect to mismatch parameter for TopHat2 alignment of short read libraries. The x-axis indicates the number of allowed mismatches for the mapping; the y-axis shows the percent of mapped reads for each library
Fig. 5
Fig. 5
Dependence of the number of mapped reads to the different types of expressed genome fragments on allowed mismatches. See Methods for more information
Fig. 6
Fig. 6
Libraries clustering. Six mappings performed with TopHat2 and six mappings performed using STAR were clusterized. Clustering was performed with UPGMA method basing on the count numbers of each transcribed genome fragment
Fig. 7
Fig. 7
Distribution of genome fragments and genes with difference in expression levels. Horizontal axis shows a log2FC of gene expression in line i:BwAlm compared to line Bowman. Vertical axis shows a number of genes (red) or genome fragments (blue) with respective changes in expression level
Fig. 8
Fig. 8
Consistency between edgeR and Cufflinks identification of differentially expressed genes. Consistency of list of genes with lower level of expression in line i:BwAlm is shown on the diagram a. The diagram b shows consistency of lists of genes with higher level of expression in line i:BwAlm. Genes detected with edgeR are shown in green, genes detected with Cufflinks are shown in red
Fig. 9
Fig. 9
Distribution of coverage level changes among plastid operons. Operons were categorized into four groups according to their expression levels in two barley lines. The group named log(FC) > 10 corresponds to genes that have zero expression in i:BwAlm line and non-zero expression in line Bowman
Fig. 10
Fig. 10
Changes of expression levels of selected gene sets between two barley lines. Genes that encode some of the photosystems I and II proteins and genes that have a functional association with vesicle transport according to the results of GO enrichment analysis were taken as an example. Genes encoding photosystem proteins have a lower level of expression in i:BwAlm line. Genes associated with vesicle transport have a higher level of expression in i:BwAlm line
Fig. 11
Fig. 11
Participation of differentially expressed genes in Calvin-Benson-Bassham cycle pathway. The scheme of pathway is taken from PMN database. Genes with higher level of expression in Bowman line are marked in red
Fig. 12
Fig. 12
Involvement of differentially expressed genes in chlorophyll cycle pathway. The diagram of pathway was taken from BarleyCyc online database. Genes with differential expression are shown in red on the respective stages of their protein products involvement
Fig. 13
Fig. 13
Involvement of differentially expressed genes in Xanthin cycle pathway. The diagram of pathway was taken from BarleyCyc online database. Genes with differential expression are shown in red on the respective stages of their protein products involvement
Fig. 14
Fig. 14
Distribution of functions of genes in differentially expressed plastid operons

References

    1. Zoschke R, Liere K, Borner T. From seedling to mature plant: Arabidopsis plastidial genome copy number, RNA accumulation and transcription are differentially regulated during leaf development. Plant J. 2007;50:710–22. doi: 10.1111/j.1365-313X.2007.03084.x. - DOI - PubMed
    1. Yagi Y, Shiina T. Recent advances in the study of chloroplast gene expression and its evolution. Front Plant Sci. 2014;5:1–7. doi: 10.3389/fpls.2014.00061. - DOI - PMC - PubMed
    1. Joyard J, Ferro M, Masselon C, Seigneurin-Berny D, Salvi D, Garin J, Rolland N. Chloroplast proteomics and the compartmentation of plastidial isoprenoid biosynthetic pathways. Mol Plant. 2009;2(6):1154–80. doi: 10.1093/mp/ssp088. - DOI - PubMed
    1. Robles P, Micol JL, Quesada V. Arabidopsis MDA1, a nuclear-encoded protein, functions in chloroplast development and abiotic stress responses. PLoS ONE. 2012;7(8):e42924. doi: 10.1371/journal.pone.0042924. - DOI - PMC - PubMed
    1. Abdallah F, Salamni F, Leister D. A prediction of the size and evolutionary origin of the proteome of chloroplasts of Arabidopsis. Trends Plant Sci. 2000;5:141–2. doi: 10.1016/S1360-1385(00)01574-0. - DOI - PubMed

LinkOut - more resources