. 2017 Feb;27(2):253-273.
doi: 10.1038/cr.2017.13. Epub 2017 Jan 20.

Phosphatidylinositol 3,4-bisphosphate regulates neurite initiation and dendrite morphogenesis via actin aggregation

Affiliations

Phosphatidylinositol 3,4-bisphosphate regulates neurite initiation and dendrite morphogenesis via actin aggregation

Shu-Xin Zhang et al. Cell Res. 2017 Feb.

Abstract

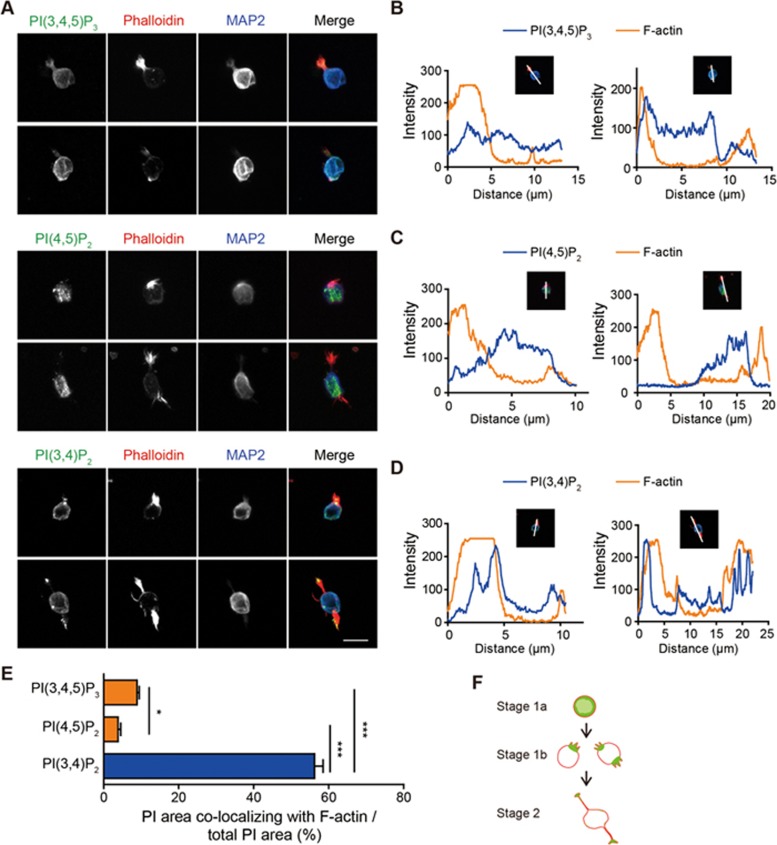
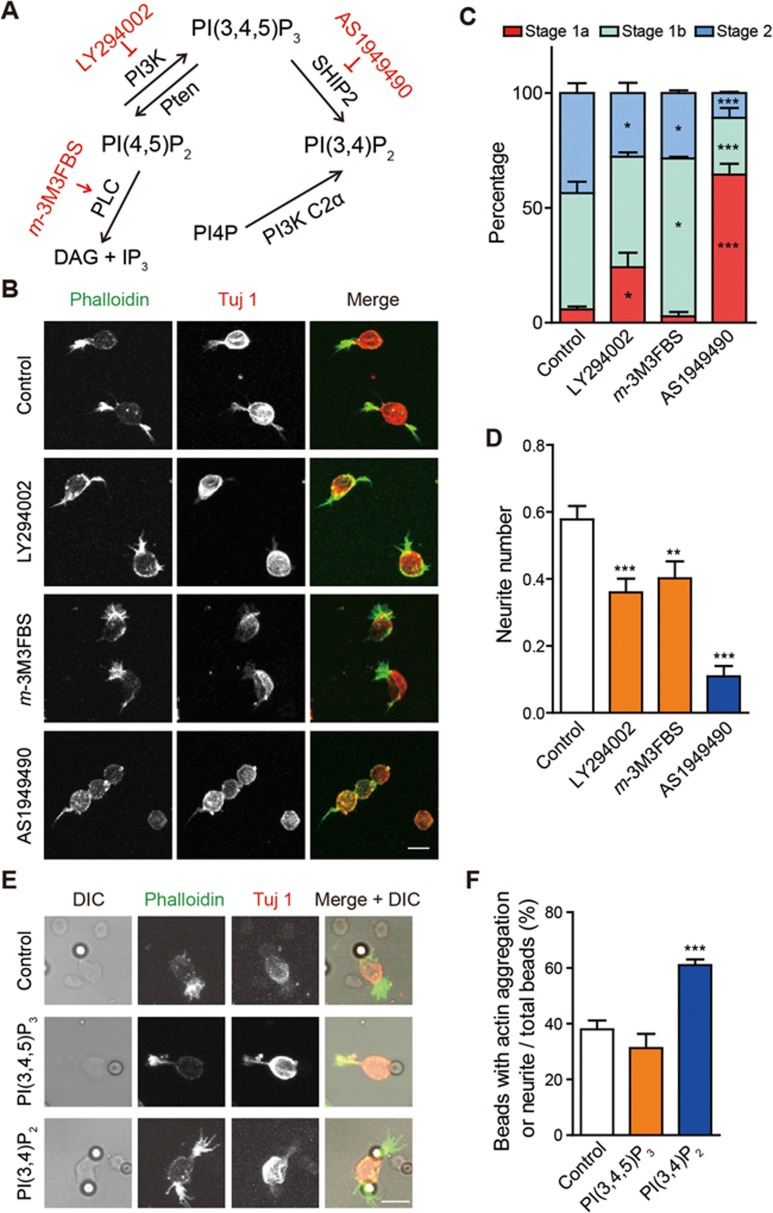
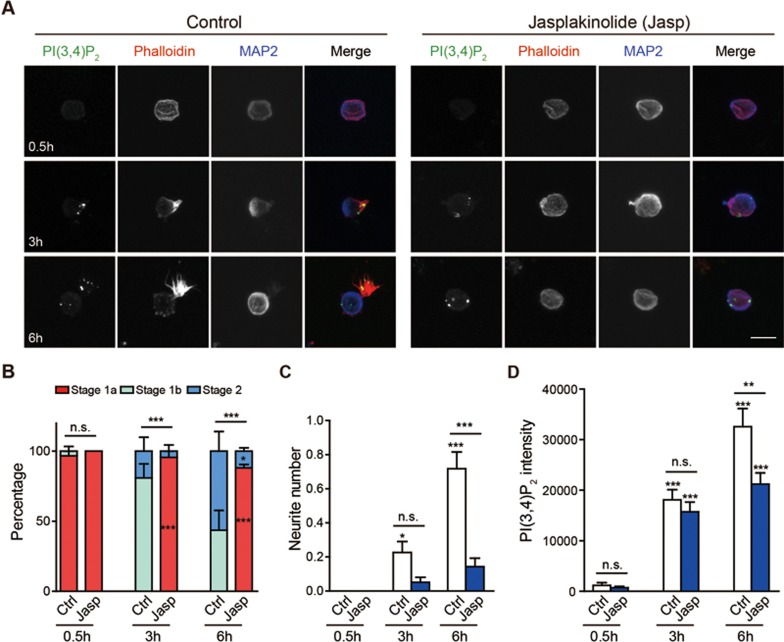
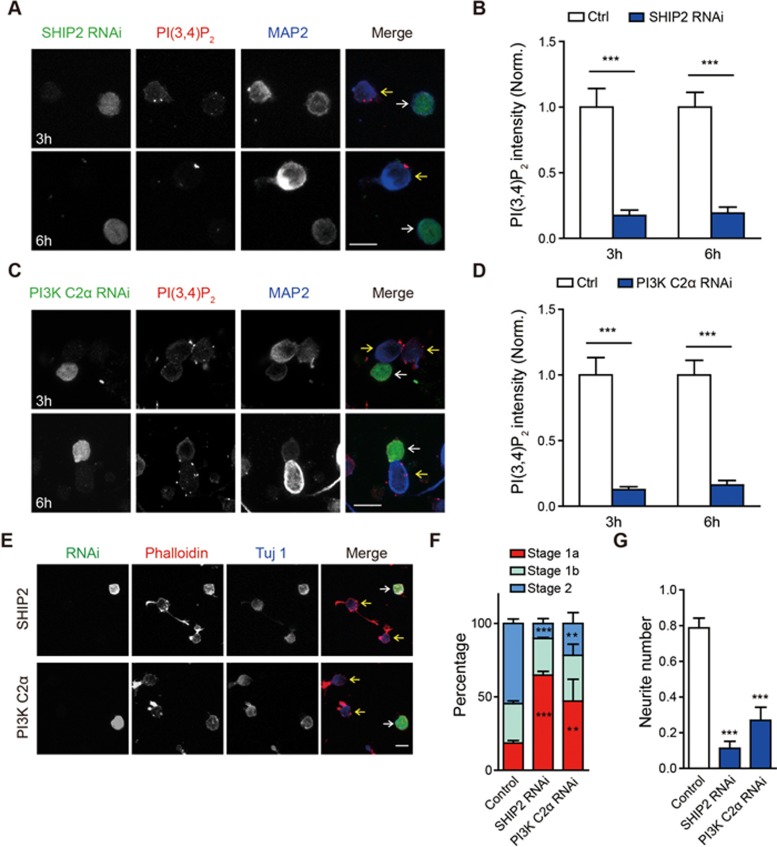
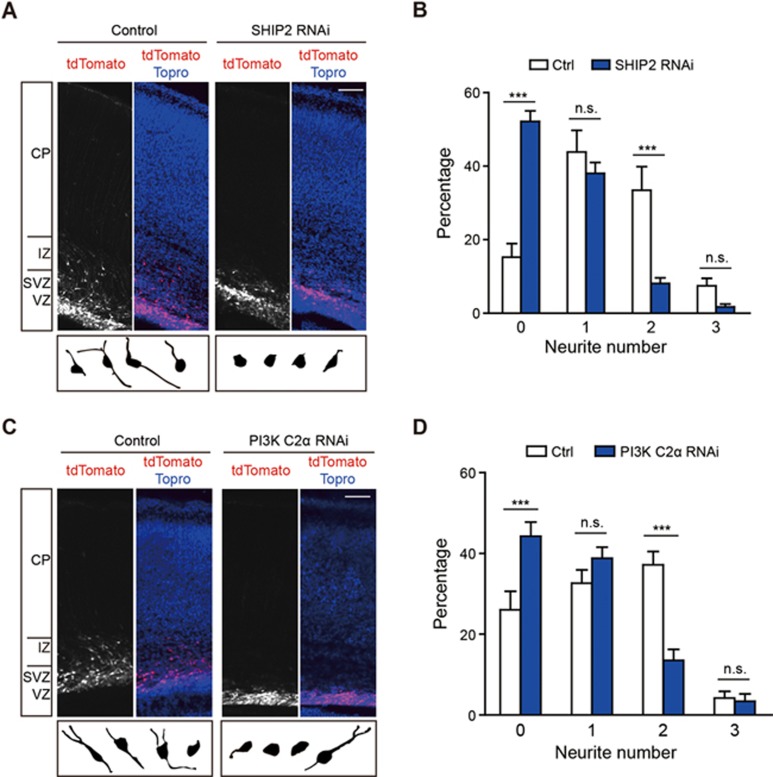
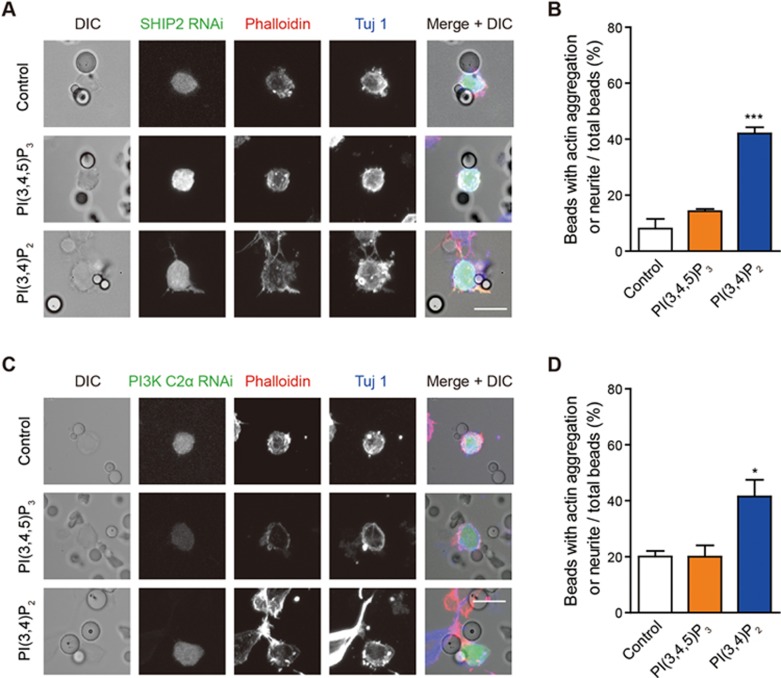
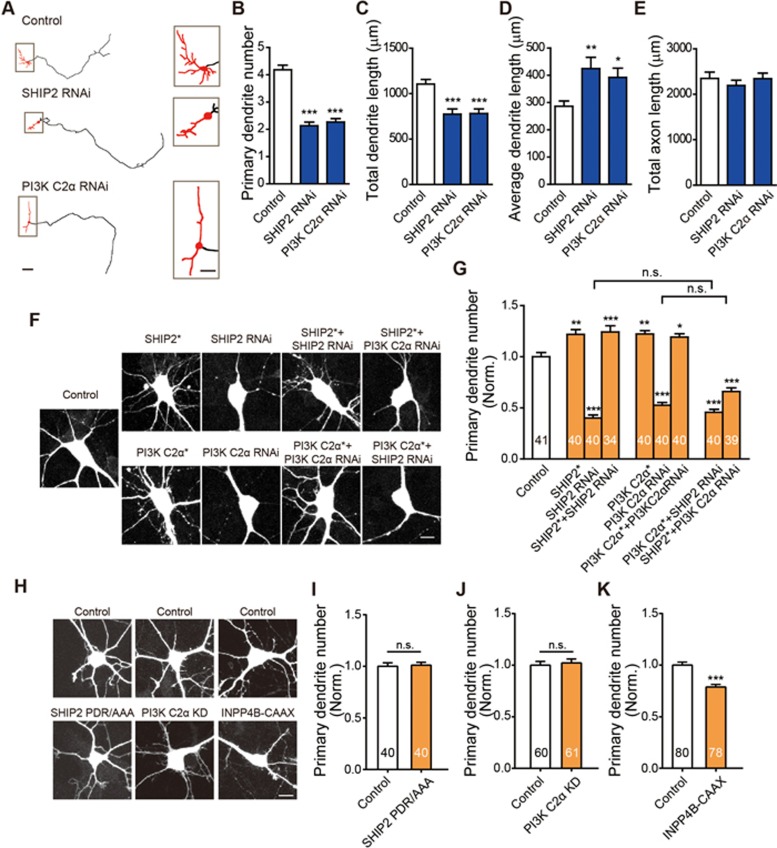
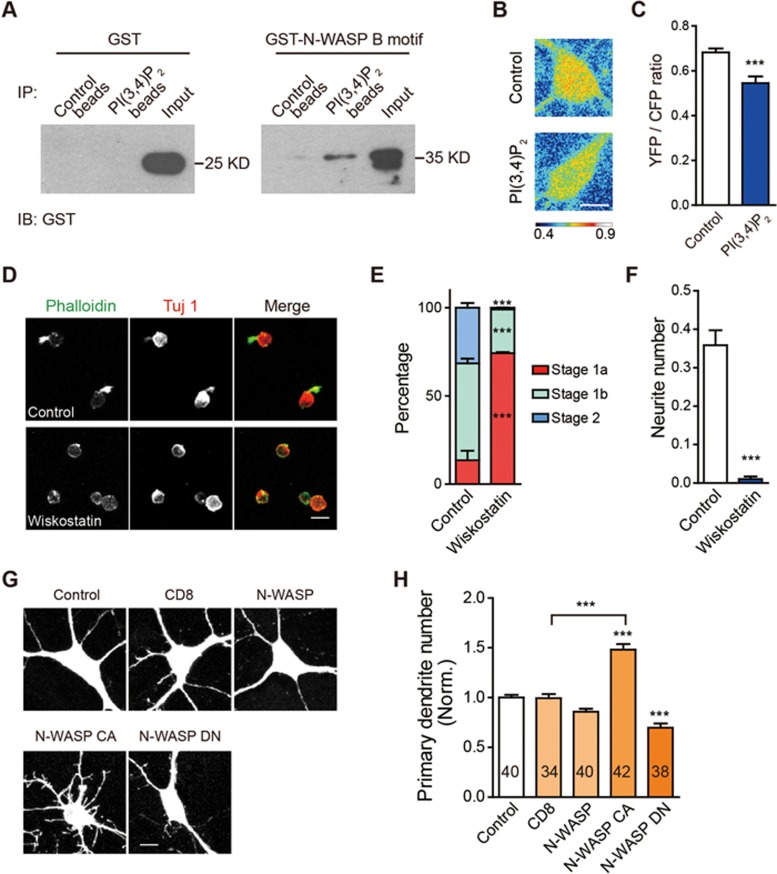
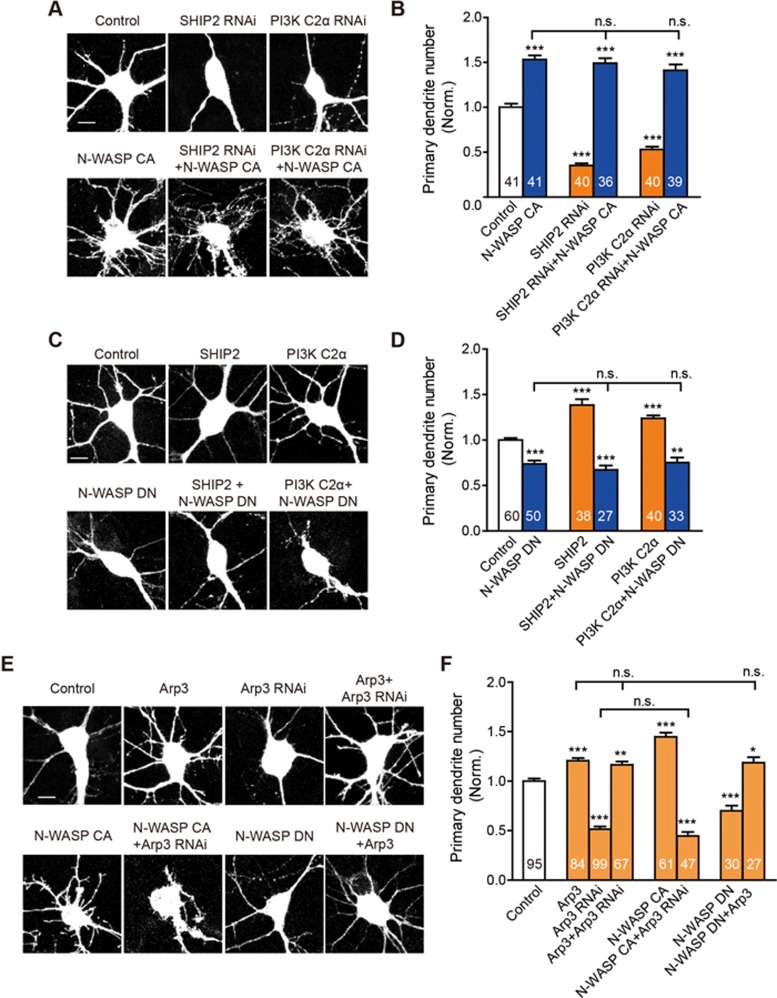
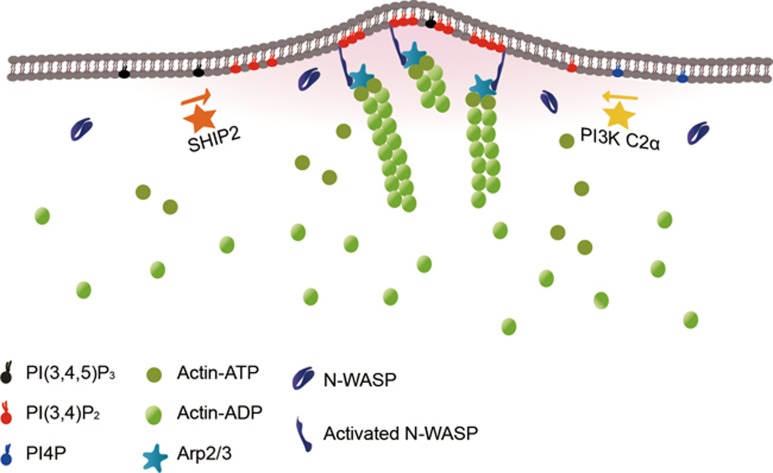
Neurite initiation is critical for neuronal morphogenesis and early neural circuit development. Recent studies showed that local actin aggregation underneath the cell membrane determined the site of neurite initiation. An immediately arising question is what signaling mechanism initiated actin aggregation. Here we demonstrate that local clustering of phosphatidylinositol 3,4-bisphosphate (PI(3,4)P2), a phospholipid with relatively few known signaling functions, is necessary and sufficient for aggregating actin and promoting neuritogenesis. In contrast, the related and more extensively studied phosphatidylinositol 4,5-bisphosphate or phosphatidylinositol (3,4,5)-trisphosphate (PIP3) molecules did not have such functions. Specifically, we showed that beads coated with PI(3,4)P2 promoted actin aggregation and neurite initiation, while pharmacological interference with PI(3,4)P2 synthesis inhibited both processes. PI(3,4)P2 clustering occurred even when actin aggregation was pharmacologically blocked, demonstrating that PI(3,4)P2 functioned as the upstream signaling molecule. Two enzymes critical for PI(3,4)P2 generation, namely, SH2 domain-containing inositol 5-phosphatase and class II phosphoinositide 3-kinase α, were complementarily and non-redundantly required for actin aggregation and neuritogenesis, as well as for subsequent dendritogenesis. Finally, we demonstrate that neural Wiskott-Aldrich syndrome protein and the Arp2/3 complex functioned downstream of PI(3,4)P2 to mediate neuritogenesis and dendritogenesis. Together, our results identify PI(3,4)P2 as an important signaling molecule during early development and demonstrate its critical role in regulating actin aggregation and neuritogenesis.


Figures

Figure 1
Figure 1
PI(3,4)P2 co-localizes with actin aggregates during neurite initiation. (A) Representative images of cultured rat hippocampal neurons fluorescently labeled for PI(3,4,5)P3, PI(4,5)P2 or PI(3,4)P2 (green channel), F-actin (phalloidin, red channel) and MAP2 (blue channel). Scale bar, 10 μm. (B-D) Fluorescence intensity of PI and F-actin in example neurons shown in A, measured along the white line indicated in the insets. (E) Quantification of percentage of co-localization between F-actin and PI(3,4,5)P3, PI(4,5)P2 or PI(3,4)P2; n = 123, 120 and 119 neurons, respectively; one-way ANOVA followed by Tukey's post hoc test. (F) Schematic of Stages 1a, 1b and 2 of neuronal development, where green shading represents F-actin aggregates. In this and all subsequent figures, error bars represent SEM, and *P< 0.05, **P< 0.01, ***P < 0.001, and n.s., not significant, as indicated on graphs.
Figure 2
Figure 2
PI(3,4)P2 is necessary and sufficient for inducing actin aggregation and neurite initiation. (A) Schematic showing the enzymes responsible for interconversion between PIs, as well as the pharmacological agents used in this study (shown in red). (B) Representative images of neurons treated with vehicle DMSO (Control), 100 μM LY294002, 50 μM m-3M3FBS or 70 μM AS1949490. Neurons were labeled for phalloidin (green) and Tuj 1 (red). (C, D) Quantification of developmental stages (C) and neurite number (D). n = 374, 228, 214 and 101 neurons, respectively; two-way ANOVA followed by Bonferroni's post hoc test in C, and one-way ANOVA followed by Dunnett's post hoc test in D. (E) Representative images of neurons treated with beads coated with carrier alone (control), carrier and PI(3,4,5)P2 or carrier and PI(3,4)P2. Neurons were labeled for phalloidin (green) and Tuj 1 (red); beads were visualized under DIC. (F) Quantification of neuritogenesis and actin aggregation. A total of 463 beads from 70 image frames were quantified in the control group, 108 beads from 40 frames in the PI(3,4,5)P3 group and 382 beads from 30 frames in the PI(3,4)P2 group; one-way ANOVA followed by Tukey's post hoc test. Scale bar, 10 μm.
Figure 3
Figure 3
PI(3,4)P2 clusters appear independent of actin aggregation or neurite initiation. (A) Representative images of neurons labeled for PI(3,4)P2 (green), phalloidin (red) and MAP2 (blue), and treated with DMSO (control) or 100 nM Jasplakinolide for 0.5, 3 or 6 h. Scale bar, 10 μm. (B-D) Quantification of neuronal developmental stages (B), neurite number (C) and PI(3,4)P2 intensity (D). n = 52, 53 and 53 neurons for the control groups, and 50, 58 and 63 neurons for the jasplakinolide groups for each time point. Two-way ANOVA followed by Bonferroni's post hoc test was used for comparing condition pairs at each time point in B, ***P< 0.001 for stage 1b at 3 and 6 h time points; one-way ANOVA followed by Tukey's post hoc test was used in C and D.
Figure 4
Figure 4
PI(3,4)P2 regulators SHIP2 and PI3K C2α are required for actin aggregation and neurite initiation. (A, C) Representative images of neurons cultured from embryos in utero electroporated with constructs coexpressing GFP and SHIP2 RNAi (A) or GFP and PI3K C2α RNAi (C). White arrows indicate RNAi-positive cells expressing GFP, and yellow arrows indicate nearby wild-type cells. Neurons were labeled for PI(3,4)P2 (red) and MAP2 (blue). Scale bar, 10 μm. (B, D) Quantification of neuronal PI(3,4)P2 intensity. n = 39 and 43 neurons for Ctrl groups, 50 and 42 neurons for SHIP2 RNAi groups for each time points in B. n = 39 and 35 neurons for Ctrl groups, 33 and 34 neurons for PI3K C2α RNAi groups for each time points in D. Unpaired t-tests in B and D. (E) Representative images of neurons cultured from embryos in utero electroporated with SHIP2 RNAi or PI3K C2α RNAi construct. Scale bar, 10 μm. (F, G) Quantification of neuronal developmental stages (F) and neurite number (G). n = 235, 80 and 52 for Ctrl, SHIP2 RNAi and PI3K C2α RNAi groups; two-way ANOVA followed by Bonferroni's post hoc test in F and one-way ANOVA followed by Dunnett's post hoc test in G.
Figure 5
Figure 5
SHIP2 and PI3K C2α are required for neurite initiation in vivo. (A, C) Representative images of rat E18.5 cortical slices from embryos in utero electroporated with constructs co-expressing tdTomato and SHIP2 RNAi (A) or tdTomato and PI3K C2α RNAi (C); tdTomato was used as a morphology marker. The bottom boxes show representative neurons traced from these cortical slices. CP, cortical plate; IZ, immediately zone; (S)VZ, (sub)ventricular zone. Scale bar, 100 μm. (B, D) Quantification of neurite number. In B, 215 neurons from 14 frames were quantified in the Ctrl group and 423 neurons from 15 frames in the SHIP2 RNAi group; in D, 221 neurons from 10 frames were quantified in the Ctrl group and 220 neurons from 10 frames in the PI3K C2α RNAi group; one-way ANOVA followed by Dunnett's post hoc test.
Figure 6
Figure 6
PI(3,4)P2-coated beads rescue SHIP2 RNAi and PI3K C2α RNAi effects. (A, C) Representative images of neurons cultured from embryos in utero electroporated with constructs co-expressing GFP and SHIP2 RNAi (A) or GFP and PI3K C2α RNAi (C), and treated with beads coated with carrier alone (control), carrier and PI(3,4,5)P3 or carrier and PI(3,4)P2. Neurons were labeled for phalloidin (red) and Tuj 1 (blue); beads were visualized under DIC. Scale bar, 10 μm. (B, D) Quantification of neuritogenesis and actin aggregation of SHIP2 RNAi neurons (B) or PI3K C2α RNAi neurons (D). In B, 123 beads from 73 image frames were quantified in the control group, 125 beads from 71 frames in the PI(3,4,5)P3 group and 107 beads from 73 frames in the PI(3,4)P2 group. In D, 90 beads from 59 image frames were quantified in the control group, 87 beads from 51 frames in the PI(3,4,5)P3 group and 82 beads from 52 frames in the PI(3,4)P2 group; one-way ANOVA followed by Dunnett's post hoc test.
Figure 7
Figure 7
SHIP2 and PI3K C2α are specifically required for dendritogenesis and are non-redundant in their functions. (A) Examples of neuronal tracings of DIV 3 neurons, dendrites shown in red, axons in black. Scale bar, 200 μm, or 100 μm for the boxed insets. (B-E) Quantification of primary dendrite number (B), total dendrite length (C), average dendrite length (D) and total axon length (E). n = 44, 46 and 45, respectively, for the three groups in each graph; one-way ANOVA followed by Dunnett's post hoc test. (F, H) Representative images of DIV5 neurons, conditions as indicated. Neurons were co-transfected with GFP to visualize their morphology. Scale bar, 10 μm. (G) Quantification of primary dendrite number of neurons shown in F. n as indicated inside bar graphs; one-way ANOVA followed by Tukey's post hoc test. (I-K) Quantification of primary dendrite number of neurons shown in H. n as indicated inside bar graphs; unpaired t-tests.
Figure 8
Figure 8
N-WASP regulates actin aggregation and dendritogenesis downstream of PI(3,4)P2. (A) Immunoblot using anti-GST antibody showing that N-WASP B motif specifically interacted with PI(3,4)P2. (B) Representative images of neurons expressing Stinger, a FRET-based N-WASP activity probe; neurons were treated with carrier alone (control) or carrier and PI(3,4)P2. Images are shown using Royal look-up table from Fiji/ImageJ. Scale bar, 10 μm. (C) Quantification of neuronal YFP/CFP ratio. n = 20 neurons for each group; unpaired t-test. (D) Representative images of neurons treated with DMSO vehicle (Control) or 1 μg/ml wiskostatin. Scale bar, 10 μm. (E, F) Quantification of neuronal developmental stages (E) and neurite number (F). n = 201 and 198 neurons for control and wiskostatin groups, respectively; in E, two-way ANOVA followed by Bonferroni's post hoc test was used; in F, unpaired t-test was used. (G) Representative images of DIV5 neurons, conditions as indicated. Neurons were co-transfected with GFP to visualize their morphology. Scale bar, 10 μm. (H) Quantification of primary dendrite number of neurons shown in G. n as indicated inside bar graphs, one-way ANOVA followed by Tukey's post hoc test.
Figure 9
Figure 9
N-WASP/Arp complex mediates PI(3,4)P2-dependent dendritogenesis. (A, C, E) Representative images of DIV 5 neurons, conditions as indicated. Neurons were co-transfected with GFP to visualize their morphology. Scale bar, 10 μm. (B, D, F) Quantification of primary dendrite number in A, C, E, respectively. n as indicated inside bar graphs; one-way ANOVA followed by Tukey's post hoc test.
Figure 10
Figure 10
A working model of the mechanism underlying PI(3,4)P2-dependent actin aggregation and neurite initiation.

Similar articles

Cited by

References

    1. Craig AM, Banker G. Neuronal polarity. Annu Rev Neurosci 1994; 17:267–310. - PubMed
    1. Dotti CG, Sullivan CA, Banker GA. The establishment of polarity by hippocampal neurons in culture. J Neurosci 1988; 8:1454–1468. - PMC - PubMed
    1. Arimura N, Kaibuchi K. Neuronal polarity: from extracellular signals to intracellular mechanisms. Nat Rev Neurosci 2007; 8:194–205. - PubMed
    1. Barnes AP, Polleux F. Establishment of axon-dendrite polarity in developing neurons. Annu Rev Neurosci 2009; 32:347–381. - PMC - PubMed
    1. Cheng PL, Poo MM. Early events in axon/dendrite polarization. Annu Rev Neurosci 2012; 35:181–201. - PubMed

MeSH terms

Substances