

Application of 3D and 2D quantitative shear wave elastography (SWE) to differentiate between benign and malignant breast masses
- PMID: 28106134
- PMCID: PMC5247720
- DOI: 10.1038/srep41216
Application of 3D and 2D quantitative shear wave elastography (SWE) to differentiate between benign and malignant breast masses
Abstract
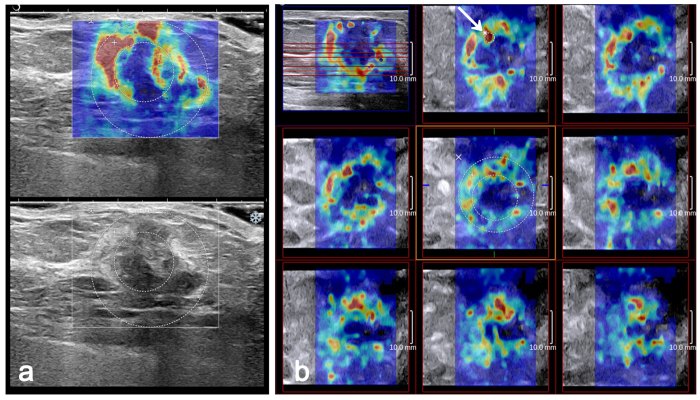
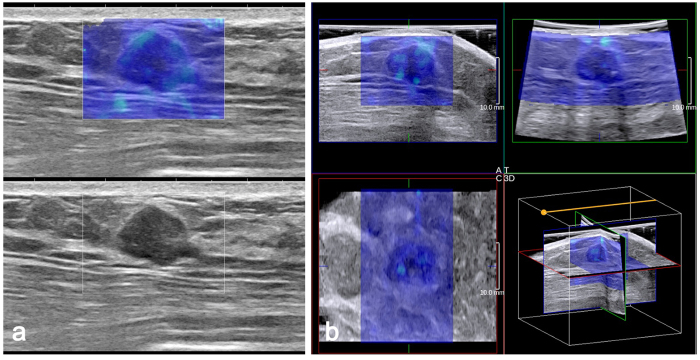
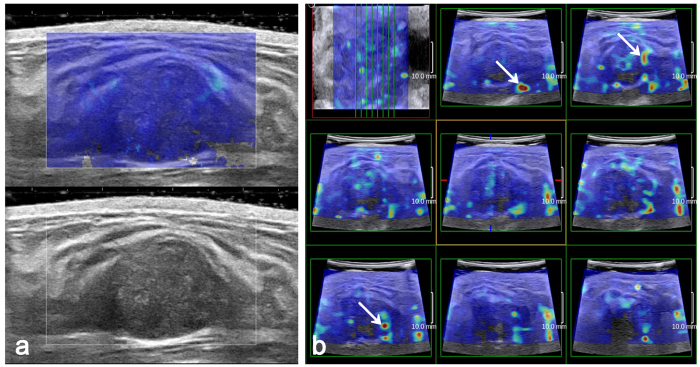
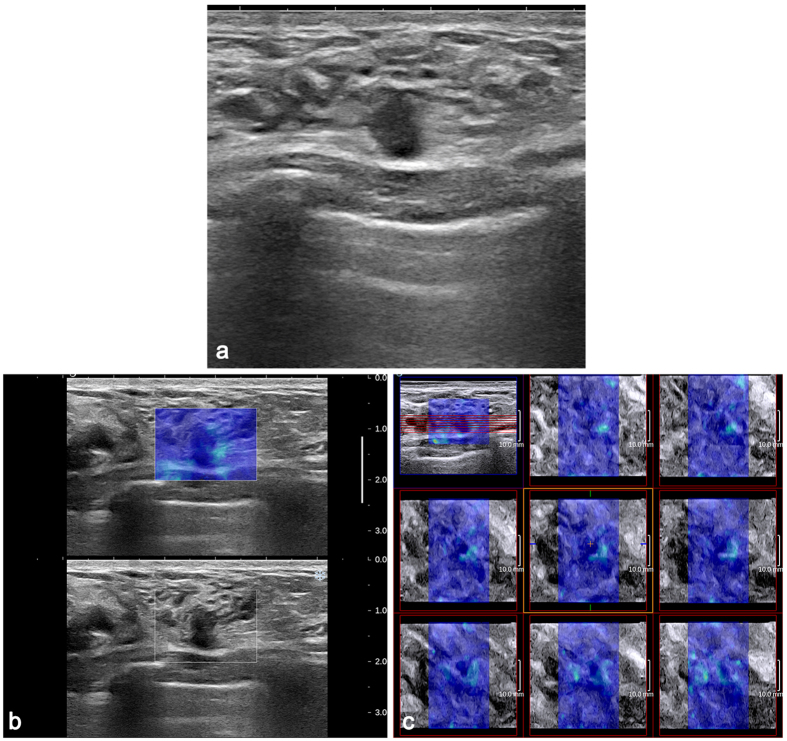
As breast cancer tissues are stiffer than normal tissues, shear wave elastography (SWE) can locally quantify tissue stiffness and provide histological information. Moreover, tissue stiffness can be observed on three-dimensional (3D) colour-coded elasticity maps. Our objective was to evaluate the diagnostic performances of quantitative features in differentiating breast masses by two-dimensional (2D) and 3D SWE. Two hundred ten consecutive women with 210 breast masses were examined with B-mode ultrasound (US) and SWE. Quantitative features of 3D and 2D SWE were assessed, including elastic modulus standard deviation (ESDE) measured on SWE mode images and ESDU measured on B-mode images, as well as maximum elasticity (Emax). Adding quantitative features to B-mode US improved the diagnostic performance (p < 0.05) and reduced false-positive biopsies (p < 0.0001). The area under the receiver operating characteristic curve (AUC) of 3D SWE was similar to that of 2D SWE for ESDE (p = 0.026) and ESDU (p = 0.159) but inferior to that of 2D SWE for Emax (p = 0.002). Compared with ESDU, ESDE showed a higher AUC on 2D (p = 0.0038) and 3D SWE (p = 0.0057). Our study indicates that quantitative features of 3D and 2D SWE can significantly improve the diagnostic performance of B-mode US, especially 3D SWE ESDE, which shows considerable clinical value.
Figures
References
-
- Siegel R., Naishadham D. & Jemal A. Cancer statistics, 2013. CA Cancer J. Clin. 63, 11–30 (2013). - PubMed
-
- Bassett L. W. Imaging of breast masses. Radiol. Clin. North Am. 38, 669–691 (2000). - PubMed
-
- Mendelson E. B. et al.. ACR Breast Imaging Reporting and Data System: Breast Imaging Atlas. (American College of Radiology, 2013).
-
- Kim E. K. et al.. Clinical application of the BI-RADS final assessment to breast sonography in conjunction with mammography. AJR Am. J. Roentgenol. 190, 1209–1215 (2008). - PubMed
-
- Berg W. A. Supplemental screening sonography in dense breasts. Radiol. Clin. North Am. 42, 845–851 (2004). - PubMed
Publication types
MeSH terms
LinkOut - more resources
Full Text Sources
Other Literature Sources
Medical
Research Materials
